
Governance
How Governments Are Increasingly Taxing the Rich — And Why It’s Working Better Than You Think


Tax systems are more progressive than the headlines suggest. A deep dive into global data reveals a countervailing force quietly reshaping economic inequality.
There is a story most people believe about inequality: that the rich have gotten richer, governments have stood aside, and the gap between the powerful and the powerless has grown wider with each passing decade. It is a compelling narrative. It has fueled populist movements from Paris to Pennsylvania. And it is, in important ways, true.
But it is only half the story.
The half that rarely makes the front page is this: while pre-tax incomes have grown more unequal across much of the developed world, tax codes have quietly, methodically, and often controversially been reengineered to push back. The modern tax system — maligned by progressives as a handmaiden of the wealthy and by conservatives as a punishing drag on enterprise — has actually become considerably more redistributive than it was a generation ago. Today’s taxman, it turns out, looks less like the Sheriff of Nottingham and rather more like Robin Hood.
The Inequality Surge — And the Silent Counter-Surge
The raw numbers on pre-tax inequality are stark. In 1980, the top 1% of American earners commanded roughly 9% of national pre-tax income. By 2022, that share had climbed to 16% — nearly double. Europe followed a similar, if less dramatic, trajectory: the top 1%’s share rose from around 8% to 12% over the same period, according to data tracked by the World Inequality Database (wid.world, DA 70).
This concentration at the top has coincided with the stagnation of middle-class wages across rich nations — a phenomenon economists now widely cite as a driver of the populist upheavals that reshaped Western politics after 2016. When people feel the system is rigged, they vote accordingly.
Yet here is the data point that rarely features in those conversations: even as pre-tax inequality grew, post-tax inequality in many countries grew far less — and in some cases, barely at all. By comparing the distribution of income before and after taxes and transfers, economists can measure how much redistribution a tax system actually delivers. That measure has risen sharply over the past four decades in most wealthy democracies.
The Numbers Behind the Narrative
A rigorous analysis of post-tax income distributions, drawing on OECD Taxation and Inequality data (oecd.org, DA 90), reveals the scale of the shift. The United States today redistributes approximately twice as much income through its tax-and-transfer system as it did in the 1960s. Germany and Japan, the world’s second- and fourth-largest economies, have also significantly expanded the redistributive reach of their fiscal systems. Britain and Canada are not far behind.
By the best available estimates, roughly seven in ten developed countries now operate more progressive tax-and-benefit systems than they did in 1990. The exceptions — Belarus, Eritrea, Haiti — are either dysfunctional states or, as in the case of Scandinavia, systems that were already so redistributive that marginal gains became structurally difficult to achieve. Norway and Sweden didn’t become less progressive because they abandoned the principle; they simply had less room to move.
The Tax Foundation’s 2025 Federal Income Tax Data Update (taxfoundation.org, DA 80) offers a granular look at the American case. The top 1% of U.S. earners now pay an effective federal income tax rate substantially above their historical average, contributing a disproportionate share of total receipts. Progressivity in the U.S. code — measured by the share of taxes paid by upper-income brackets relative to their share of income — has been on an upward trend since the early 2000s, a fact that cuts against the popular assumption that American tax policy has simply catered to the wealthy.
How Progressive Tax Benefits Are Actually Delivered
The mechanics matter. Progressive tax benefits do not arise solely from higher marginal rates on the wealthy — though that is one lever. They are also engineered through refundable tax credits for lower earners (the U.S. Earned Income Tax Credit is a prime example), the phase-out of deductions at higher incomes, the expansion of means-tested transfer payments, and the treatment of payroll versus capital income.
The U.S. Census Bureau’s 2025 report (census.gov, DA 92) underscores both the achievement and the limits of this system. Post-tax income inequality in the United States did rise by approximately 14% between 2009 and 2024, even accounting for redistribution — a sobering reminder that the tax code’s progressive thrust has not fully offset the underlying surge in market incomes. The very wealthy have captured productivity gains and asset appreciation at a rate that even a more aggressive redistributive system struggles to neutralize entirely.
That tension between pre-tax divergence and post-tax convergence is at the heart of the modern policy debate. Income redistribution trends globally, as documented in the World Inequality Database’s 2023–2024 data, show that many countries now display what researchers describe as “flat global taxation profiles” — meaning that once all taxes (including consumption and payroll taxes, which are regressive) are accounted for, the net progressivity of the full fiscal system is considerably more modest than headline income tax rates suggest.
Governments Taxing the Rich: What Works, and What Doesn’t
The global experiment in taxing higher incomes more aggressively has generated both evidence and controversy. France’s short-lived 75% top marginal rate under President Hollande became a case study in capital flight and political backlash. By contrast, the Nordic countries have sustained high top rates while maintaining robust economic dynamism — though critics note their tax bases are notably broad, with consumption taxes doing significant heavy lifting.
The wealth tax impact on the economy has proven particularly contested. Sweden abolished its wealth tax in 2007 following substantial evidence that it was driving capital offshore. Spain reintroduced a form of it in 2022, with mixed results. The academic literature, including a landmark 2024 OECD working paper, finds that the behavioral responses to high marginal rates — avoidance, deferral, emigration — significantly erode the practical revenue yield, suggesting that the design of progressive systems matters as much as their stated ambition.
The Manhattan Institute’s research on the limits of taxing the rich (manhattan-institute.org) offers a rigorous counterpoint worth engaging seriously: there is a ceiling to how much revenue can be extracted from high earners before diminishing returns — and perverse incentives — begin to dominate. That ceiling is lower than redistributionists tend to assume and higher than supply-siders insist. The empirical literature puts the revenue-maximizing top marginal rate somewhere in the range of 50–70%, though the precise figure is sensitive to assumptions about capital mobility and income elasticity.
The Political Economy of Redistribution
There is a deeper irony embedded in this story. The very success of progressive taxation in moderating post-tax inequality may have paradoxically reduced the political salience of tax reform. If the after-tax Gini coefficient looks relatively stable, policymakers can point to a system that is “working” — even as pre-tax divergence continues unabated and wealth (as distinct from income) inequality reaches historic extremes.
The Economist’s analysis of how governments are soaking the rich (economist.com, DA 93) correctly identifies that much of the redistribution occurring today happens not through dramatic rate increases but through the quiet accumulation of tax expenditures, transfer payments, and bracket creep. This is redistribution by stealth — effective in aggregate, but poorly understood by voters, and therefore fragile.
That fragility matters. A redistributive architecture that operates through complexity rather than transparency is vulnerable to elite capture, to political backlash, and to the kind of simplification drives that tend to benefit those with the resources to optimize against a newly rationalized code.
Looking Forward: Policy Implications for 2025 and Beyond
The data presents a nuanced verdict. Progressive tax systems in wealthy democracies have done considerably more to moderate inequality than their critics acknowledge. The claim that governments have simply let the rich run away with the gains is empirically unsound. Yet the redistributive effort required has grown dramatically — and the economic friction it generates, in terms of tax avoidance, investment distortions, and political conflict, is rising alongside it.
Several policy directions appear most promising based on the available evidence:
Broadening the base while maintaining progression. Systems that rely on narrow income tax bases are more vulnerable to avoidance. Consumption taxes with low-income offsets, or a more systematic approach to capital gains taxation (including accrual-based treatment for the very wealthy), could expand the redistributive toolkit without requiring punishing marginal rates.
Targeting wealth as well as income. As the World Inequality Database documents, much of the divergence at the top is now driven by asset appreciation rather than labor income. A well-designed, internationally coordinated minimum tax on very large wealth — as proposed in academic frameworks endorsed at the G20 level — could address what income tax systems structurally miss.
International coordination to limit base erosion. The OECD’s Global Minimum Tax initiative represents the most significant shift in the international tax architecture in decades. Its full implementation would meaningfully constrain the ability of multinationals and wealthy individuals to arbitrage tax systems — a precondition for progressive systems to deliver their stated redistributive goals.
The arc of tax history in the modern era bends, tentatively and imperfectly, toward greater progressivity. Whether that arc can continue to bend fast enough to offset the forces generating pre-tax inequality is the central fiscal question of the coming decade. Governments have proven more Robin Hood than Sheriff of Nottingham. The question now is whether the forest is large enough — and whether there are enough stagecoaches left to rob.
Sources: World Inequality Database (wid.world); OECD Taxation and Inequality 2024 (oecd.org); U.S. Census Bureau Income and Poverty Report 2025 (census.gov); Tax Foundation Federal Income Tax Data 2025 (taxfoundation.org); The Economist, “How Governments Are Increasingly Soaking the Rich” (economist.com); Manhattan Institute, “The Limits of Taxing the Rich” (manhattan-institute.org)
Discover more from The Economy
Subscribe to get the latest posts sent to your email.


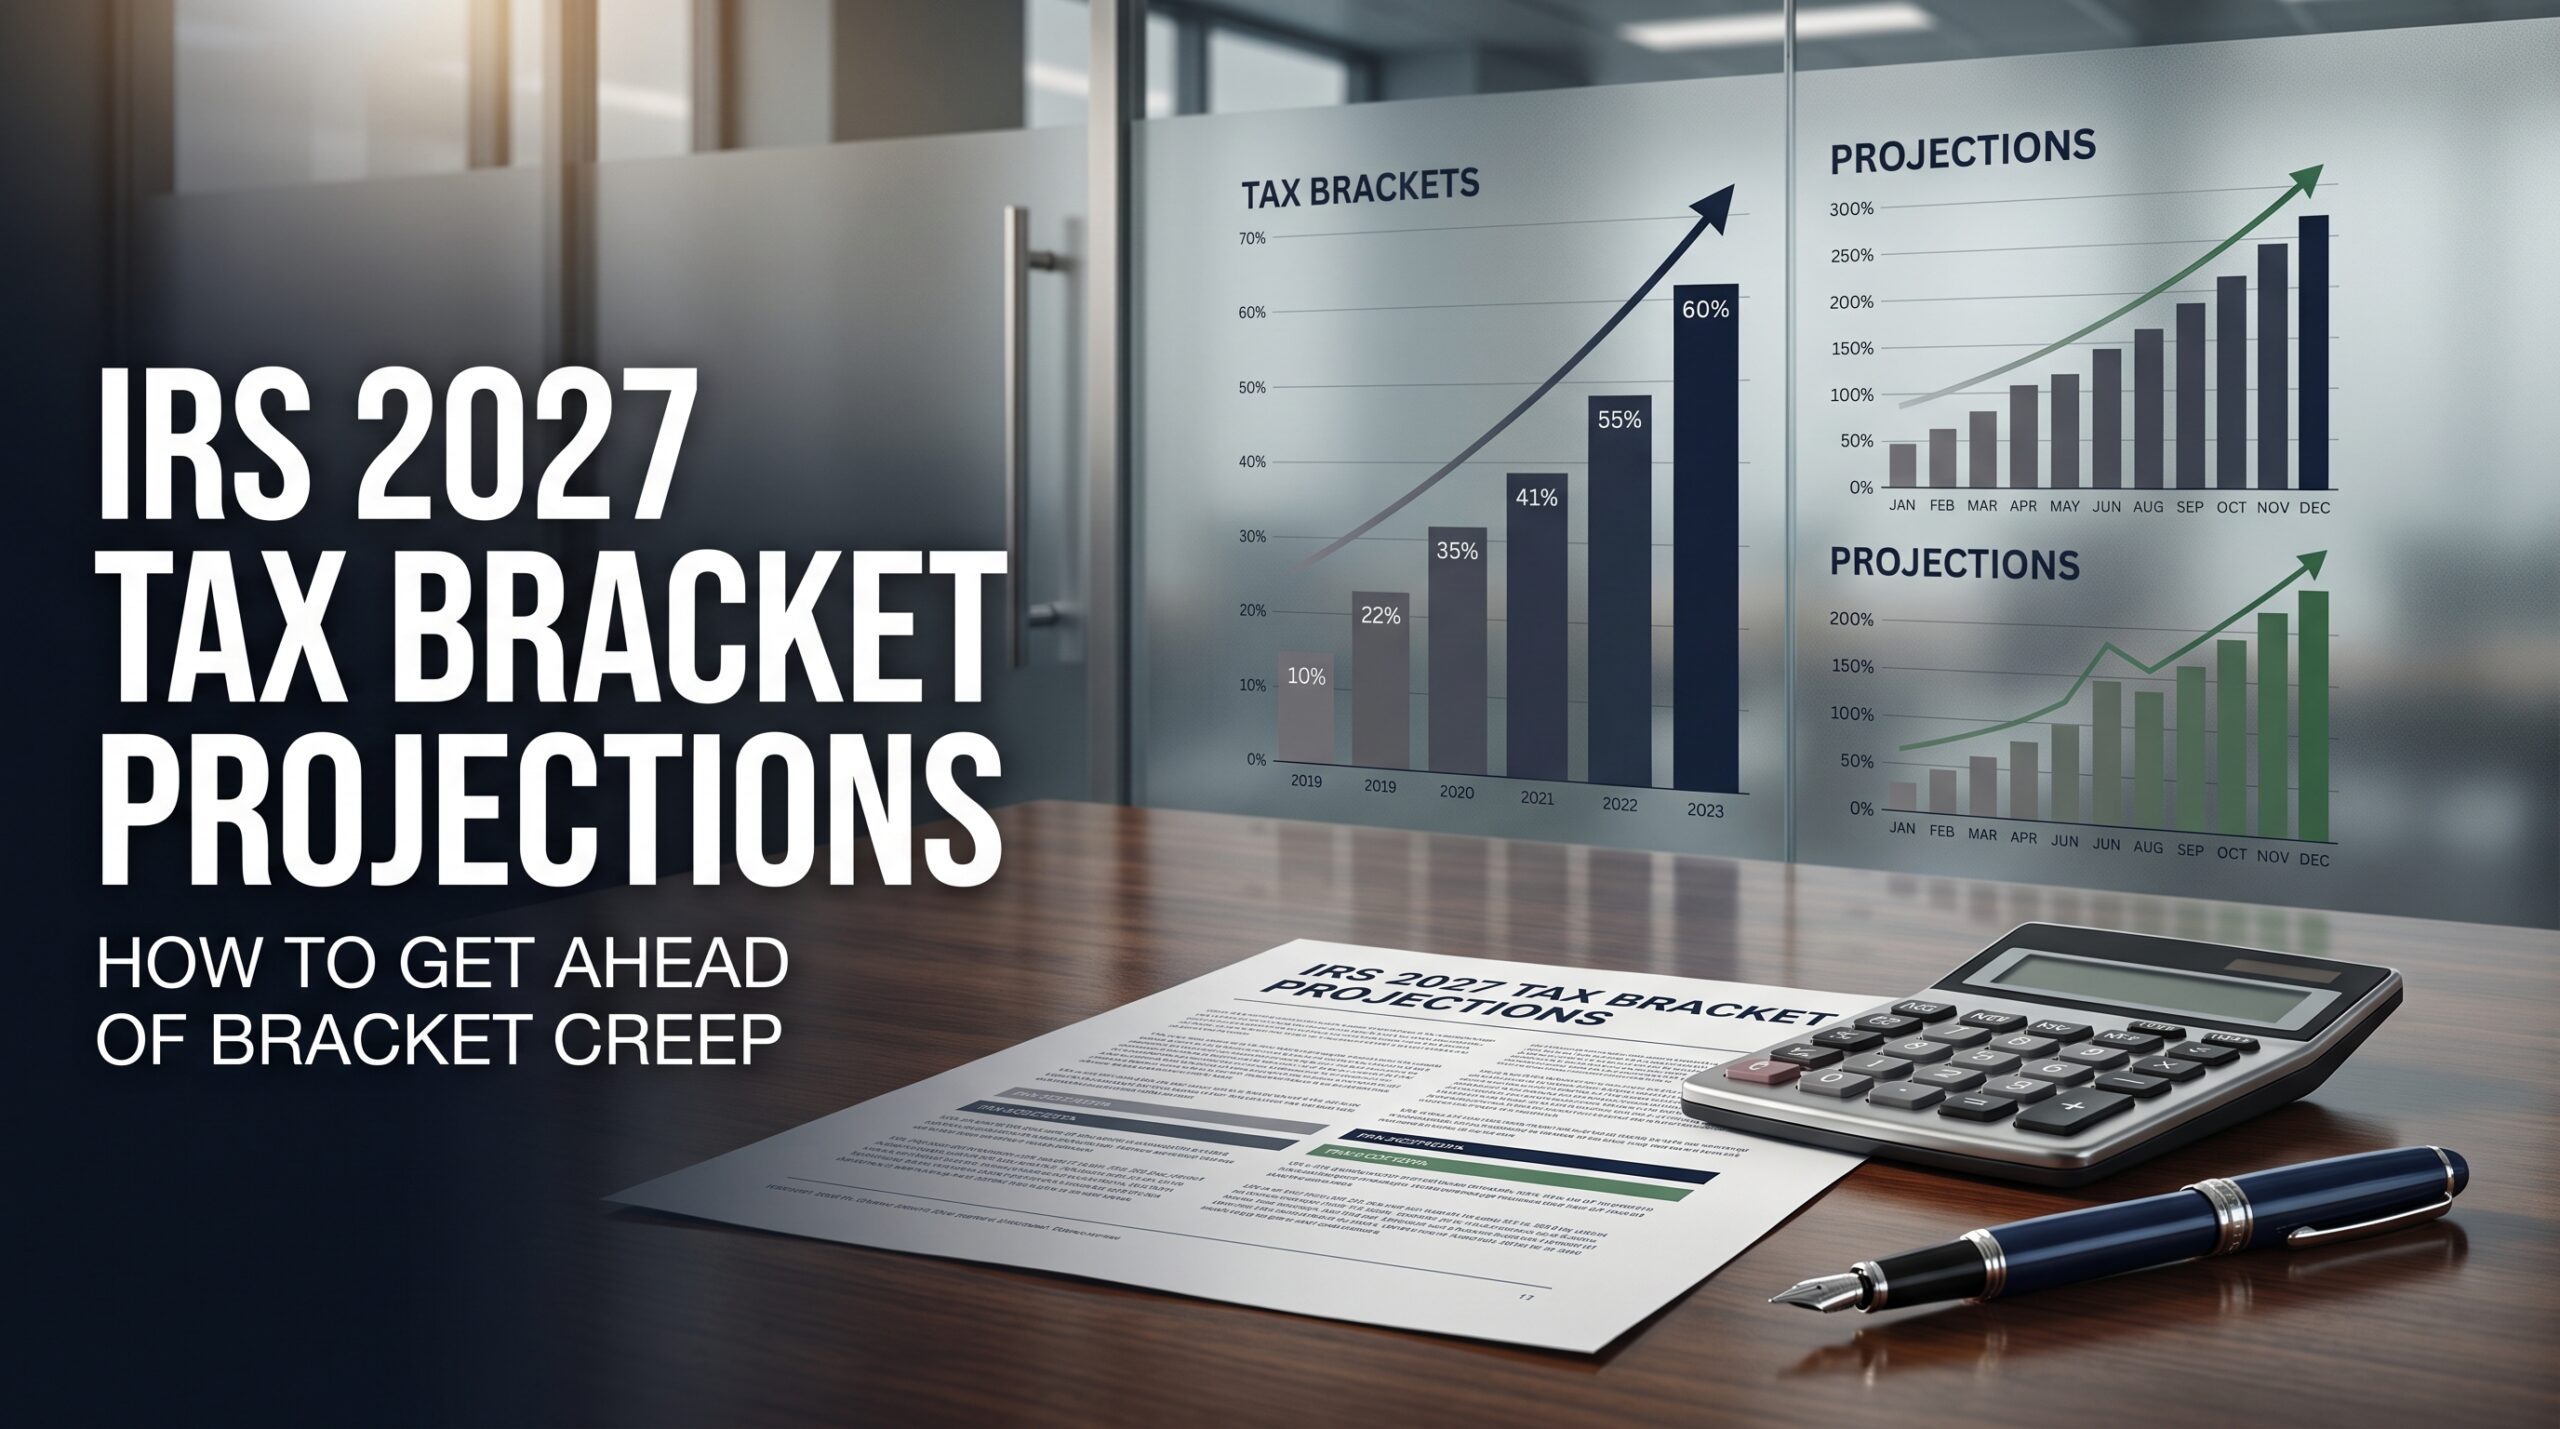
Key Takeaways
- Bloomberg Tax projects federal income tax brackets will rise 3.2% for 2027 — up from the 2.7% inflation adjustment applied for 2026.
- All seven federal tax tiers are expected to shift upward, meaning taxpayers can earn more before crossing into a higher bracket.
- The IRS has not yet confirmed these figures; an official announcement is typically made in October or November.
- Bracket creep — when income grows faster than the tax thresholds — is the core risk these adjustments are designed to offset.
- Bloomberg Tax’s 2026 projections proved accurate against the IRS’s final figures, lending the 2027 forecast reasonable credibility, though it remains unofficial.
What Is “Bracket Creep” and Why It Matters
Bracket creep happens when a raise or cost-of-living adjustment pushes your income into a higher marginal tax bracket, even though your real purchasing power hasn’t improved. The IRS’s annual inflation adjustment exists specifically to prevent this — recalibrating the income thresholds for each of the seven federal brackets so inflation alone doesn’t quietly raise your tax bill.
Projected 2027 vs. 2026: What’s Changing
| Factor | 2026 (Confirmed) | 2027 (Projected) |
|---|---|---|
| Inflation adjustment | 2.7% | 3.2% (projected) |
| Number of brackets adjusted | 7 | 7 (projected) |
| Filing deadline | April 15, 2026 | April 15, 2027 |
| Source of figures | Official IRS | Bloomberg Tax forecast |
Exact dollar thresholds for each of the seven brackets were not yet published by the IRS at the time of writing and should be sourced directly from irs.gov once released.
Why a 3.2% Increase, and Why It’s Larger Than Last Year
The projected jump from 2.7% to 3.2% reflects a modest reacceleration in the inflation data the IRS uses (chained CPI) through the summer of 2026. A larger adjustment is generally favorable for taxpayers — it means:
- More income taxed at lower marginal rates before hitting the next bracket.
- A modestly larger paycheck in 2027 for many W-2 earners once employers update withholding tables.
- Potential increases to related figures — the standard deduction, retirement contribution limits, and estate tax exemption — though the IRS calculates these separately and on its own timeline.
How to Plan Before the Official Numbers Land
- Don’t restructure your withholding yet. Projections aren’t official; wait for the IRS’s confirmed 2027 figures before making payroll changes.
- Revisit tax-advantaged account contributions. If you’re near a bracket threshold, year-end moves — retirement contributions, HSA funding, charitable giving — can still shift where 2026 income lands.
- Watch for the official release. The IRS historically publishes final brackets in Revenue Procedure form each October or November for the following tax year.
- Talk to a tax professional before making decisions based on projected, not confirmed, figures — this article is informational and not individualized tax advice.
Will 2027 tax brackets change?
Yes — Bloomberg Tax projects a 3.2% inflation adjustment across all seven federal income tax brackets for 2027, up from 2.7% in 2026. The IRS has not yet confirmed these figures; official numbers are expected in October or November 2026.
Discover more from The Economy
Subscribe to get the latest posts sent to your email.
Key Takeaways
- Tariff revenue currently covers only about one-tenth of the cost of Trump’s promised $5,000 dividend — the Tax Foundation estimates 2027 net tariff revenue at roughly $125 billion, versus the $1.25 trillion the payout would actually cost.
- Because the dividend is being framed as a “dividend” rather than a tax refund, its tax treatment is genuinely unclear — experts note there’s no legislative text specifying whether it would be taxable income, a tax credit, or an untaxed transfer.
- One tax-policy analysis estimates the payments could function like a demogrant, potentially eliminating positive net federal income tax liability for more than half of American families at 2026 median income levels.
- VP JD Vance has suggested wealthy Americans likely wouldn’t qualify for the full payment, but no income cutoff or definition of “wealthy” has been specified — leaving retail investors with taxable investment income unable to gauge their own eligibility.
- Absent significant new revenue or spending cuts, funding the dividend would require additional government borrowing on top of an already-projected $1.9 trillion FY2027 deficit — a dynamic that could raise yields and offset any net financial benefit for investors holding bonds or rate-sensitive equities.
Beyond the political theater surrounding Trump’s pledged $5,000 “dividend,” retail investors face a more practical question that has received far less attention: how would this payment actually be taxed, and what are the second-order effects on portfolios if it moves toward passage? This piece works through the tax-policy mechanics that most mainstream coverage has skipped.
The Math Doesn’t Add Up — And That Matters for Taxation
The dividend concept originated from Trump’s earlier proposal to distribute tariff revenue back to taxpayers. But according to Tax Foundation analysis, that revenue simply isn’t sufficient: net tariff collections are projected at roughly $125 billion in 2027, and $1.4 trillion cumulatively from 2026 through 2035. Against a $1.25 trillion one-time cost for the $5,000 dividend, tariff revenue would cover only about a tenth of the bill in any given year — meaning it would take nearly a decade of tariff collections to fund a single year’s dividend payout.
This funding gap is directly relevant to taxation because it determines how Congress would need to structure the payment if it ever moved toward passage. A dividend funded from an identifiable revenue stream (tariffs) could plausibly be treated differently under tax law than a dividend funded through general deficit borrowing — and right now, the proposal is light on the details needed to determine which path lawmakers would take.
Is the $5,000 Dividend Taxable Income?
This is the single biggest open question for retail investors trying to plan around the pledge, and as of now, there is no definitive answer because no legislative text exists. Tax-policy experts have noted that Trump’s proposal lacks specificity not just on funding, but on basic structural questions: would the payment count as taxable income requiring a 1099 or similar reporting, would it function as a refundable tax credit similar to COVID-era stimulus payments, or would it be structured as a wholly untaxed transfer?
Precedent cuts both ways. The 2020 CARES Act stimulus checks were structured as advance tax credits and were not taxed as income. But those payments were explicitly legislated with clear implementing rules — something the current $5,000 pledge doesn’t yet have. Until Congress produces actual bill text, retail investors cannot reliably model the after-tax value of the payment, nor factor it into year-end tax planning.
The “Demogrant” Analysis: A Progressive Side Effect
One notable tax-policy analysis frames the dividend as functioning similarly to a demogrant — a flat, universal cash transfer historically associated with progressive tax-reform proposals (echoing ideas like George McGovern’s 1972 “demogrant” plan). Using post-2025 tax law (following the One Big Beautiful Bill Act, or OBBBA), the analysis estimates that for a joint-filing household near the 2026 median family income of roughly $110,000, two Trump dividends worth $10,000 combined could offset their entire federal income tax liability for the year.
If accurate at scale, this means the dividend’s practical tax effect — regardless of its formal legislative characterization — would function as a substantial, broad-based tax cut concentrated among middle-income households, since the flat $5,000-per-adult structure delivers a proportionally larger benefit to lower-income filers than to high earners for whom $5,000 represents a smaller share of income and tax liability.
Who Might Actually Be Excluded?
Vice President JD Vance has already signaled that the dividend may not be truly universal, stating that wealthy Americans likely would not qualify for the full payment — though he offered no income threshold or definition of what “wealthy” means in this context. For retail investors with meaningful capital-gains income, dividend income, or other investment earnings, this ambiguity is a genuine planning problem: it’s currently impossible to know whether investment income would even be counted toward an eligibility test, or whether eligibility would instead be based purely on adjusted gross income from wages.
Comparison: How the Trump Dividend Stacks Up Against Prior Direct Payments
| Payment | Legal Basis | Tax Treatment | Funding Source |
|---|---|---|---|
| 2020 CARES Act checks | Legislated, advance tax credit | Not taxed as income | Deficit spending |
| 2025 “Warrior dividend” ($1,776) | Legislated, appropriated funds | N/A — bonus for active-duty military | Existing appropriations |
| Trump Accounts (child investment fund) | Congress-authorized | Tax-advantaged investment account | Appropriated funds |
| Proposed 2026 “$5,000 dividend” | Not yet legislated | Undetermined | Tariff revenue (insufficient) + likely borrowing |
The Second-Order Risk: Rates and Bond Yields
Even setting aside direct taxation of the payment itself, tax-policy and economics experts warn of a second, less visible cost to investors: financing $1.2–1.3 trillion in new spending — whether through borrowing or otherwise — on top of an already-elevated national debt above $40 trillion could push Treasury yields higher. David Ditch, a policy analyst at the Cato Institute, has warned that injecting that much money into the economy “would automatically lead to higher prices,” potentially eroding the real value of the dividend itself through inflation before investors ever see a tax bill on it. For portfolios, that means the practical “tax” on the dividend may show up less through the IRS and more through compressed bond returns and rate-sensitive equity valuations.
Why This Matters for Retail Investors
The prudent approach for now is treating the $5,000 dividend as a low-probability scenario with genuinely unresolved tax mechanics rather than incorporating it into near-term financial planning. Congress would need to pass specific implementing legislation — addressing taxability, income eligibility, and funding — before the payment could be modeled with any precision. Investors should watch for draft legislative language, which would be the first concrete signal of how lawmakers intend to structure both the payment and its tax treatment.
Frequently Asked Questions
Will Trump’s $5,000 dividend be taxed as income? It’s currently unknown. No legislative text exists specifying whether the payment would be taxable income, a tax credit modeled on 2020 stimulus checks, or an untaxed transfer — this is one of the proposal’s biggest open questions.
Would wealthy Americans receive the $5,000 dividend? Vice President JD Vance has said wealthy Americans likely wouldn’t qualify for the full payment, but no income threshold or definition of “wealthy” has been specified, leaving eligibility rules genuinely undefined.
How would the $5,000 dividend affect my taxes if I own investments? Beyond direct tax treatment of the payment itself, funding a $1.2–1.3 trillion payout through borrowing could push Treasury yields higher and add inflation pressure, potentially affecting bond returns and rate-sensitive equity valuations independent of how the payment is formally taxed.
Discover more from The Economy
Subscribe to get the latest posts sent to your email.

Corporate government affairs teams have long treated lobbying disclosure as a routine compliance function — a form filed, a box checked. That assumption is breaking down across major jurisdictions in 2026. From Canada’s newly drafted Foreign Influence Transparency and Accountability Act to expanded US foreign-agent disclosure bills and the EU’s ongoing overhaul of its mandatory Transparency Register, multinational corporations now face a rapidly tightening, increasingly public web of lobbying disclosure regimes — with the reputational risk of exposure, not just the legal penalty for non-compliance, emerging as the dominant business concern.
Key Takeaways
- Canada’s draft Foreign Influence Transparency and Accountability Act (FITAA) regulations, published January 3, 2026, impose short reporting deadlines — 14 days for new arrangements and 60 days for pre-existing ones — with an estimated 2,422 businesses and individuals expected to be affected and a projected $25.90 million total compliance cost through 2035.
- The US Senate passed two bills in December 2025 to broaden foreign-agent disclosure requirements: the Disclosing Foreign Influence in Lobbying Act and the Lobbying Disclosure Improvement Act, which would require registered lobbyists to identify any foreign government or political party participating in the “direction, planning, supervision, or control” of their lobbying activities — regardless of whether that entity provides financing.
- The EU’s Transparency Register has faced formal criticism from the European Court of Auditors, which found the EU awarded over €7 billion in NGO funding between 2021 and 2023 with more than 90% of recipients not clearly categorized, and identified self-declaration without verification as a source of legal uncertainty and misuse risk.
- The OECD’s Anti-Corruption and Integrity Outlook 2026 finds that lobbying regulation quality remains among the lowest-scoring areas of integrity systems across OECD member and partner countries, even as adoption of lobbying registers has expanded in recent years.
- A growing number of countries are adopting dedicated foreign-influence frameworks distinct from general lobbying rules, specifically targeting activities conducted on behalf of foreign governments, political organizations, and state-affiliated actors — a regulatory category largely separate from domestic corporate lobbying disclosure.
The Shift From Domestic Lobbying Disclosure to Foreign Influence Transparency
The most consequential regulatory development for multinational corporations in 2026 is not incremental tightening of existing domestic lobbying rules, but the emergence of a distinct, more aggressive regulatory category: foreign influence transparency frameworks. These are explicitly designed to capture lobbying and influence activities conducted on behalf of foreign governments, political organizations, or state-affiliated actors — a category that OECD analysis identifies as a growing global regulatory trend, separate from and layered on top of general lobbying disclosure requirements.
This distinction matters enormously for multinational corporations, which frequently engage in advocacy activity that could plausibly be characterized as connected to a foreign principal’s interests — whether through subsidiary structures, joint ventures with state-linked entities, or advocacy coordinated with a home-country government’s economic interests abroad. A company that has treated its domestic lobbying registration as sufficient compliance may find itself newly exposed under a foreign-influence framework that was not previously relevant to its activities.
Canada’s FITAA: A Case Study in the New Compliance Burden
Canada’s Foreign Influence Transparency and Accountability Act (FITAA) illustrates both the scope and speed of this regulatory shift. Draft regulations published January 3, 2026 require organizations to disclose substantial detail to a newly created Commissioner: core corporate information, identification of individuals significantly involved in influence activities, and a detailed description of the arrangement — including its duration, compensation, the political or governmental processes targeted, and the foreign principal’s objectives. Additional disclosure is required for activities involving communications with public officeholders, information dissemination, or the provision of money, items of value, services, or facilities.
The compliance timeline is notably aggressive: businesses face just 14 days to report new arrangements and 60 days for pre-existing ones. The Canadian government’s own regulatory impact analysis estimates approximately 2,422 businesses and individuals will be affected (872 individuals and 1,550 businesses), with a projected total compliance cost of $25.90 million between 2026 and 2035 — a figure derived in part by benchmarking against Australia’s existing Foreign Influence Transparency Scheme, suggesting Canadian regulators are explicitly modeling FITAA on precedents from other jurisdictions rather than building an isolated framework.
Critically, while only a portion of submitted information will be publicly accessible, the registry will still publicly display corporate and foreign-principal identities and the individuals involved — meaning the reputational exposure exists independent of the underlying compliance penalty structure. A company’s public association with a specific foreign principal, once disclosed in a searchable public registry, cannot be walked back through subsequent compliance.
The United States: Broadening Foreign-Agent Disclosure
The US regulatory trajectory in 2026 points in the same direction. Two bills passed by the Senate in December 2025 — the Disclosing Foreign Influence in Lobbying Act and the Lobbying Disclosure Improvement Act — would materially broaden existing disclosure requirements under the Foreign Agents Registration Act (FARA) and the Lobbying Disclosure Act (LDA). The core expansion: registered lobbyists would need to disclose any foreign government entity or political party that merely participates in the “direction, planning, supervision, or control” of their lobbying activities, regardless of whether that entity actually finances the activity.
This financing-independent disclosure trigger is a significant expansion of scope. Under prior frameworks, financial ties were often central to establishing a foreign-agent relationship requiring disclosure; the new standard would capture coordination and influence relationships even in the absence of direct payment — a structure that could implicate multinational corporations whose government affairs strategy is coordinated, even informally, with a parent company’s home-government interests or with joint-venture partners linked to foreign states.
The EU Transparency Register: A Cautionary Tale on Enforcement Gaps
The European Union’s experience with its mandatory Transparency Register — made compulsory via a 2021 interinstitutional agreement, later joined by the Council — offers a useful caution for multinationals assuming that registration alone satisfies compliance expectations. The European Court of Auditors’ special report found that while the register provides useful information for tracking lobbying activity, its enforcement measures fall short in practice: the primary enforcement mechanism available is removal of lobbyists from the register itself, and the system’s substantial reliance on self-declaration without independent verification creates both legal uncertainty and elevated misuse risk.
The Court of Auditors specifically flagged that the EU awarded over €7 billion in NGO funding between 2021 and 2023 with more than 90% of recipients not clearly categorized, and that disclosure of advocacy activities financed by these grants was often weak. This finding has fueled a broader debate — with some arguing NGOs face insufficient scrutiny, and others arguing companies and business associations face comparatively fewer transparency obligations than non-profit entities and frequently bypass them. For multinationals, the practical lesson is that formal registration does not equate to reputational safety: register quality, enforcement gaps, and asymmetric scrutiny across sectors remain live political and media narratives that can surface regardless of a company’s technical compliance status.
The Reputational Risk Dimension
The OECD’s Anti-Corruption and Integrity Outlook 2026 identifies lobbying regulation quality as among the lowest-scoring areas of integrity systems across OECD member and partner countries, despite wider adoption of lobbying registers in recent years — a gap between formal regulatory adoption and substantive regulatory quality that creates a specific reputational hazard: a company can be in full technical compliance with a weak or inconsistently enforced register while still facing significant reputational exposure if investigative journalism, NGO research, or opposition political actors highlight the substance of its disclosed lobbying relationships.
This dynamic has already played out in EU institutional contexts, where high-profile corruption scandals (such as the case widely known as “Qatargate”) exposed the gap between formal transparency register participation and the actual influence relationships operating around EU institutions, damaging the reputations of both public institutions and the private and non-profit actors implicated — even where formal registration requirements had technically been observed.
Compliance and Reputational Risk Management Strategies
- Map foreign-influence exposure separately from domestic lobbying compliance. Given that frameworks like FITAA and the expanded FARA/LDA bills are structured as distinct regulatory categories, corporate compliance teams should conduct a dedicated foreign-principal relationship audit rather than assuming domestic lobbying registration covers this exposure.
- Treat public registry disclosure as a permanent reputational fact, not a reversible compliance step. Since FITAA and comparable frameworks will publicly display corporate and foreign-principal identities regardless of confidentiality around other submitted details, government affairs teams should evaluate disclosure implications before entering into arrangements that could trigger registration, not after.
- Prepare for financing-independent disclosure triggers. The US bills’ focus on “direction, planning, supervision, or control” — independent of financing — signals a broader global regulatory direction that compliance frameworks built around financial-flow tracking alone will not adequately capture.
- Anticipate short compliance windows as the emerging global standard. FITAA’s 14-day/60-day reporting windows reflect a regulatory design trend toward rapid disclosure; compliance infrastructure built around slower, retrospective reporting cycles common under older lobbying laws will likely need modernization.
- Monitor enforcement-quality gaps as a distinct risk category from registration itself. Given the OECD’s finding that lobbying regulation quality lags adoption, and the EU’s documented self-declaration verification gaps, multinationals should assume that being technically registered does not insulate against reputational exposure if the substance of disclosed relationships becomes a media or political focal point.
Frequently Asked Questions
What is Canada’s FITAA and who does it affect?
The Foreign Influence Transparency and Accountability Act requires organizations engaging in influence activities on behalf of foreign governments or state-affiliated actors to register and disclose detailed information within 14 days (new arrangements) or 60 days (existing ones); an estimated 2,422 businesses and individuals are expected to be affected.
How is the new US foreign-agent legislation different from existing FARA rules?
Bills passed by the Senate in December 2025 would require disclosure of any foreign government or political party involved in directing, planning, supervising, or controlling lobbying activities — even without financial ties — broadening the trigger for mandatory disclosure beyond the traditional financing-based standard.
Does registering in a lobbying transparency register protect a company’s reputation? Not necessarily. The European Court of Auditors found the EU’s Transparency Register relies heavily on unverified self-declaration, and the OECD finds lobbying regulation quality generally lags its adoption — meaning technical registration compliance does not eliminate reputational risk if the substance of disclosed relationships draws scrutiny.
Conclusion
The 2026 shift toward mandatory foreign-influence transparency registers — layered on top of, and structurally distinct from, existing domestic lobbying disclosure regimes — represents a genuine new compliance category for multinational corporations, not an incremental tightening of familiar rules. With Canada’s FITAA, expanded US foreign-agent disclosure legislation, and ongoing scrutiny of the EU’s Transparency Register all moving in the same direction, corporate government affairs and legal teams face a landscape where public, permanent disclosure of foreign-principal relationships is becoming the norm — and where reputational risk management now requires evaluating relationships before they are formed, not merely reporting them accurately after the fact.
Discover more from The Economy
Subscribe to get the latest posts sent to your email.

VIX Index Explained: How to Trade Wall Street’s Fear Gauge Today

Commercial vs Residential Real Estate: Which Wins in 2026?

Presidential Stock Market Performance: How Trump’s Second Term Compares to History

2026 Real Estate Market News: Are We Heading for a Correction?

Bitcoin Price Forecast 2026–2027: Will the 4-Year Cycle Hold?

Fidelity Crypto vs. Traditional Brokerages: A Guide for Modern Investors

The 2026 Global Smartphone Market: AI Integration and Competitor Analysis

SpaceX IPO: How Aerospace Is Reshaping Tech Startup News

Fidelity Investments Review: Maximizing Returns in a Volatile Stock Market

How Crypto Transformed the Trump Fortune: A $1.4 Billion Financial Breakdown

Global Pension Systems Ranked: The World’s Best and Worst Retirement Frameworks

Global Supply Chain Vulnerabilities: From Eurasian Trade Corridors to Food Consumer Recalls

Why 5% U.S. Treasury Yields Signal a Global Market Regime Shift.

Federal Reserve Defies White House Pressure: Inside Trump’s Demand for Sub-1% Interest Rates After Historic 2026 Rate Hike

State Farm’s $5B Dividend 2026: Who Qualifies & Payout Dates

US-China Relations in Q3 2026: Trade Tariffs and Supply Chain Risks

Top 30 Stocks for Investment in PSX for Massive ROI in 2026

SpaceX Starship Flight 14: First Orbital Attempt & Starlink V3 Launch Explained

The 2026 Crypto Regulatory Shift: What It Means for Institutional Investors

AI Chip Stocks 2026: The Best Semiconductor Investments Beyond Marvell

Tween Back-to-School Trends 2026: What’s Driving the $85B Season

AI-Powered Training: The Next Multi-Billion Dollar Ecosystem in Fitness

Oil Prices Break $100 in 2026: Middle East Conflict & Energy Markets

10-Year Treasury Yield Hits 4.80%: What It Means for Rates & Portfolios

Fidelity Investments Review 2026: SPAXX Yields & Zero-Fee Funds

Shein Clothes Quality & Safety in 2026: What Lab Tests Show

BRICS+ Cross-Border Payments 2026: Interoperability Explained

MRVL Earnings 2026: Why Marvell Sank Despite Beating Estimates
-

 Markets & Finance9 months ago
Top 15 Stocks for Investment in 2026 in PSX: Your Complete Guide to Pakistan’s Best Investment Opportunities
-

 Analysis7 months ago
Johor’s Investment Boom: The Hidden Costs Behind Malaysia’s Most Ambitious Economic Surge
-

 Analysis7 months ago
Top 10 Stocks for Investment in PSX for Quick Returns in 2026
-

 Analysis8 months ago
Brazil’s Rare Earth Race: US, EU, and China Compete for Critical Minerals as Tensions Rise
-

 Banks8 months ago
Best Investments in Pakistan 2026: Top 10 Low-Price Shares and Long-Term Picks for the PSX
-

 Investment8 months ago
Top 10 Mutual Fund Managers in Pakistan for Investment in 2026: A Comprehensive Guide for Optimal Returns
-

 Global Economy9 months ago
15 Most Lucrative Sectors for Investment in Pakistan: A 2025 Data-Driven Analysis
-

 Global Economy9 months ago
Pakistan’s Export Goldmine: 10 Game-Changing Markets Where Pakistani Businesses Are Winning Big in 2025