
Analysis
Did the US Economy Show Cracks in Q4 2025? A Deep Dive into GDP, Jobs, and Future Risks

The American economy closed out 2025 with a paradox that has left economists scratching their heads: robust GDP projections colliding with a labor market that delivered the weakest job growth since the Great Recession. While the Atlanta Federal Reserve’s GDPNow model initially projected fourth-quarter growth surging to 5.4%, a closer examination reveals hairline fractures beneath the surface—cracks that could widen into fissures in 2026.
This isn’t a story of imminent collapse, but rather of an economy navigating a treacherous path between resilience and vulnerability. The question investors, policymakers, and everyday Americans must confront is whether the US economy Q4 2025 cracks represent temporary growing pains or the early warning signs of something more systemic.
The GDP Growth Puzzle: Resilience or Mirage?
The headline numbers for GDP fourth quarter slowdown tell a tale of two economies. The Bureau of Economic Analysis confirmed that Q3 2025 GDP expanded at a robust 4.4% annualized rate—the strongest performance in two years. Looking ahead to Q4, the Atlanta Fed’s real-time tracking suggested growth could accelerate further to 5.4%, a figure that would represent the economy firing on all cylinders.
But appearances can deceive. Multiple economic analysts have raised red flags about this seemingly supercharged growth. A Haver Analytics report noted a troubling disconnect: “GDP growth is occurring at, at best, half the rate” suggested by GDPNow when compared against actual manufacturing output, housing starts, and employment data. Manufacturing output through November showed minimal growth compared to Q3, while housing starts plummeted and job creation crawled at a glacial pace.
EY’s economic analysis projects more conservative Q4 GDP growth of 3.2%, while forecasting full-year 2025 growth at 2.3%—respectable but hardly the blockbuster suggested by early nowcasts. The Survey of Professional Forecasters projects even more modest annual GDP growth of just 1.9% for 2025 and 1.8% for 2026, underscoring the wide variance in expert opinions about the economy’s true velocity.
What explains this gulf between competing GDP estimates? Part of the answer lies in consumer spending resilience and strong exports that boosted Q3 performance. AI-related investments have created pockets of exceptional strength, particularly in information processing equipment and software spending. The US consumer spending Q4 trends showed personal consumption expenditures growing at approximately 3.0% according to revised Atlanta Fed data, driven largely by upper-income households who have benefited from surging stock portfolios and accumulated wealth.
Yet this strength masks concerning imbalances. As Deloitte’s economic forecast highlights, consumer spending growth is projected to decelerate sharply to just 1.6% in 2026, down from 2.6% in 2025. The signs of US economic weakness 2025 become clearer when examining who’s actually spending: the top 20% of earners now account for approximately 57% of all consumer outlays, according to Dallas Federal Reserve data.
Labor Market Cracks Emerge: A “Hiring Recession”
If GDP growth represents one side of the economic ledger, employment tells a starkly different story—and it’s here that the most significant US job market cooling Q4 becomes apparent.
December’s employment report delivered a gut punch: just 50,000 jobs added, according to the Bureau of Labor Statistics. This capped off what NBC News characterized as “the worst year for hiring since 2020,” with total 2025 job gains of only 584,000—a fraction of the 2 million-plus additions in 2024 and the lowest figure outside of recession years since 2009.
The unemployment rate, meanwhile, painted a deceptively rosy picture. It ticked down to 4.4% in December from a revised 4.5% in November, which had marked the highest level since October 2021. However, this decline came with a critical caveat: labor force participation edged lower to 62.4%, meaning some of the improvement reflected people exiting the workforce rather than robust hiring.
Indeed Hiring Lab’s analysis cut to the chase: “It’s fair to say that 2025 was a hiring recession in the United States.” The firm noted that average monthly job gains slumped from 82,833 in the first half of 2025 to just 14,500 in the second half—a precipitous decline that underscores growing employer caution.
Sectoral patterns reveal the economy’s uneven footing. Healthcare and social assistance added 713,000 jobs throughout 2025, while business and professional services and manufacturing shed 97,000 and 68,000 positions respectively. The government sector, buffeted by Department of Government Efficiency cuts, contributed minimal job growth.
Perhaps most concerning: the number of long-term unemployed—those jobless for 27 weeks or more—surged by nearly 400,000 in 2025, now representing 26% of all unemployed workers. Average unemployment duration stretched to 24.4 weeks in December, the longest since August 2025. These statistics suggest that when Americans lose jobs, they’re finding it increasingly difficult to land new ones—a hallmark of a deteriorating labor market.
US Inflation Moderation 2025: Progress With Persistent Pressures
On the inflation front, 2025 delivered incremental progress but stubborn resistance to the Federal Reserve’s 2% target. The Consumer Price Index held steady at 2.7% year-over-year in December, matching November’s rate and marking only modest improvement from January 2025’s 3.0% reading. Core CPI, which excludes volatile food and energy prices, registered 2.6%—the lowest since 2021 but still above the Fed’s comfort zone.
Monthly inflation dynamics told a more nuanced story. Headline CPI rose 0.3% in December after several months at 0.2%, driven by rebounding shelter costs (up 0.4%), accelerating food prices (up 0.7% monthly, 3.1% annually), and higher energy prices. The KPMG economic analysis highlighted that hotel rates surged 3.5% in December alone, reflecting labor shortages in leisure and hospitality as immigration flows slowed.
However, methodological challenges cloud the inflation picture. The government shutdown that stretched over 40 days disrupted October data collection entirely and compressed November’s survey into the back half of the month—precisely when Black Friday promotions suppress measured prices. This likely introduced downward bias into inflation readings that will take months to fully unwind.
Looking ahead to 2026, inflation forecasts span a wide range. The Federal Reserve projects core PCE inflation of 2.4% by year-end 2026, down from current levels of approximately 2.8%. Yet these projections assume tariff impacts moderate and immigration policy stabilizes—both uncertain propositions. Goldman Sachs estimates current tariffs will add roughly 1 percentage point to inflation between late 2025 and mid-2026, offsetting some of the progress achieved through monetary tightening.
The “super core” services measure—which excludes shelter and energy—accelerated slightly to 2.8% in December from 2.7% in November, suggesting underlying price pressures remain embedded in the economy. Medical care costs jumped 0.4% monthly, and health insurance premiums are poised to surge at the fastest pace in 15 years at the start of 2026, a development that will strain household budgets.
Navigating US Recession Risks 2026: Scenario Analysis
So what does this complex tapestry of data mean for recession risks in 2026? The consensus view among forecasters has coalesced around “growth, not recession”—but with important caveats and narrowing margin for error.
RSM’s economic outlook projects 2.2% GDP growth for 2026 with recession probability falling to 30% from a previous 40% estimate. The Congressional Budget Office similarly forecasts modest expansion, projecting unemployment to peak at 4.6% before declining to 4.2% by 2032. Fidelity’s analysis maintains that “the US economy is still in an expansion; we don’t see signs of an imminent recession.”
Yet scratch beneath the surface, and vulnerabilities abound. Moody’s Analytics pegs 2026 recession risk at approximately 42%—nearly three times the normal peacetime baseline of 15%. Chief economist Mark Zandi warns that “nothing else can go wrong. We’re pretty much on the edge.”
Four pillars support the current expansion, any of which could crack under pressure:
1. Consumer Spending Concentration Risk: With the top 10% of households generating nearly half of all consumer spending, the economy has become perilously dependent on affluent consumers maintaining their largesse. Stock market volatility or an AI investment bubble deflating could rapidly curtail spending by this critical cohort.
2. Labor Market Fragility: While unemployment remains historically low, the hiring freeze and rising long-term unemployment suggest the jobs market is one shock away from deteriorating rapidly. Morgan Stanley’s analysis notes “the labor market is no longer working in favor of jobseekers.”
3. Policy Uncertainty: Tariff levels, immigration restrictions, and potential government shutdowns create an environment where businesses hesitate to invest and hire. The Yale Budget Lab estimates tariffs reduced 2025 GDP growth by 0.5 percentage points and increased unemployment by 0.3 percentage points—drags that will persist into 2026.
4. AI Investment Sustainability: Much of the economic optimism hinges on continued robust AI-related capital spending. Deloitte’s downside scenario contemplates AI investment becoming “overdone,” leading to a sharp pullback in business spending in 2027 as companies reassess demand.
The Road Ahead: Threading the Needle
The US economy enters 2026 performing a high-wire act. Strong Q3 GDP growth, moderating inflation, and resilient consumer spending by affluent households provide genuine tailwinds. The Federal Reserve’s three quarter-point rate cuts in late 2025 have lowered borrowing costs modestly, and the central bank has signaled it stands ready to ease further if the labor market deteriorates materially.
At the same time, the narrowing job market, consumption inequality, elevated inflation relative to target, and policy uncertainties create meaningful headwinds. The economy’s margin for error has shrunk considerably—there’s simply less slack to absorb shocks.
For investors and businesses, this environment demands vigilance without panic. The GDP data suggests underlying economic activity remains positive, even if not quite as robust as early Q4 estimates implied. Inflation has moderated from 2022’s peaks, though the final mile to 2% will prove challenging. And while job growth has slowed dramatically, mass layoffs haven’t materialized—employers appear reluctant to fire even as they’re hesitant to hire.
The most likely path for 2026 is neither boom nor bust, but rather what economists term “stagflation lite”: modest growth in the 1.8-2.3% range, inflation stuck modestly above target at 2.4-2.7%, and an unemployment rate drifting higher to perhaps 4.5-4.6%. Not a recession, but not exactly robust either—a continuation of the two-speed economy where AI-driven sectors and affluent consumers power ahead while middle and lower-income households struggle with stagnant wage growth and elevated prices.
The cracks visible in Q4 2025 data are real, not imaginary. But cracks need not become chasms. Whether they do depends on policy choices around trade, immigration, and fiscal stimulus; on how quickly productivity gains from AI materialize; and on whether the Federal Reserve can successfully navigate between supporting employment and controlling inflation.
What’s clear is that the easy optimism of recent years—the sense that the economy could shrug off any challenge—has given way to a more precarious balance. The data demands we watch closely, not panic prematurely. Because in an economy running this close to the edge, the difference between continued expansion and recession may come down to one or two variables tipping the wrong direction at the wrong time.
Discover more from The Economy
Subscribe to get the latest posts sent to your email.



For decades, the global dominance of the U.S. dollar has rested on two primary pillars: deep, unencumbered liquid capital markets and an indispensable global financial messaging protocol known as SWIFT. When Beijing launched its e-CNY initiative, Western observers initially framed it as a central bank digital currency (CBDC) designed primarily for domestic surveillance, retail convenience, and financial inclusion.
However, recent strategic moves highlight a far more ambitious objective. As documented by the South China Morning Post, Beijing is actively leveraging Hong Kong as its central offshore laboratory to establish the infrastructure required for international cross-border digital yuan adoption.
The crucial strategic question is no longer whether China can engineer robust distributed ledger architecture, but whether an offshore financial hub operating under “One Country, Two Systems” can bridge the gap between rigid domestic capital controls and global institutional acceptance. To succeed, China must resolve the fundamental tension between absolute monetary sovereignty and the open networks required for international currency adoption.
1. The Paradox of the Offshore Laboratory
China’s monetary expansion faces a well-documented structural paradox. According to macroeconomic research from the Carnegie Endowment for International Peace, no currency can achieve true international reserve status without offering open capital accounts and deep, freely convertible liquidity. Yet, completely relaxing capital controls would expose China’s domestic banking system to volatile international capital flows and speculative pressures.
Hong Kong serves as the pressure valve and testing ground for this paradox:
- Legal & Regulatory Buffer: Hong Kong maintains a trusted common law judicial system and an independent monetary authority (Hong Kong Monetary Authority).
- Convertibility Bridge: It allows mainland authorities to test e-CNY settlement, cross-border retail links, and digital asset integration without opening mainland financial markets directly to global speculative shocks.
- Institutional Liquidity: As the world’s premier offshore renminbi hub, Hong Kong provides the institutional counterparties necessary to build real-world transaction volume.
“The digital yuan’s true test lies not in domestic retail adoption, but in whether foreign counterparties can settle cross-border trade without taking on unacceptable regulatory or capital risks.”
2. Wholesale Settlement and Project mBridge
While retail consumer wallets attract considerable media attention, the real geopolitical shift is occurring at the wholesale institutional level. Strategic initiatives like Project mBridge—developed in partnership with the Bank for International Settlements (BIS), the People’s Bank of China, and regional central banks—demonstrate how multi-CBDC platforms can streamline international trade.
As reported in market analyses by Bloomberg and trade finance studies covered by Reuters, multi-lateral CBDC platforms offer significant operational advantages:
- Elimination of Intermediaries: Direct ledger-to-ledger transactions bypass traditional correspondent banking networks.
- Speed and Efficiency: Cross-border settlement times are reduced from days to seconds.
- Cost Reduction: Transaction costs and foreign exchange spreads across regional trade corridors in Asia and the Middle East are dramatically lowered.
If commercial enterprises operating in Hong Kong can settle trade directly in e-CNY with instant finality, Beijing creates a compelling economic incentive for trade partners that operates independently of Western clearing networks.
3. Geopolitical Implications & The Road Ahead
Western policymakers and central bankers are monitoring these developments closely. Recent congressional testimony and Treasury reviews highlighted by Reuters reflect growing concern in Washington that alternative settlement rails could gradually erode the reach and enforcement of Western financial sanctions.
However, technological capability alone does not guarantee global currency dominance. Until foreign corporate treasuries and central banks have full confidence in converted currency liquidity, property rights, and transparent legal protections, the digital yuan will serve primarily as an efficient alternative mechanism for bilateral trade rather than an immediate replacement for the U.S. dollar.
Institutional Summary & Comparison
| Dimension | Conventional Retail Focus | Wholesale / Strategic Reality |
| Primary Mechanism | Retail e-CNY wallets for tourists & merchants | Multi-CBDC corridors (Project mBridge) & Project Ensemble |
| Core Objective | Domestic payments & payment app competition | Disintermediation of correspondent banking and SWIFT rails |
| Primary Barrier | Consumer habituation & merchant readiness | Capital controls, currency convertibility, and institutional trust |
Sources & Citations
- South China Morning Post: Beijing wants Hong Kong to sow the seeds for the digital yuan
- Bank for International Settlements (BIS): Central Bank Digital Currency (CBDC) & Cross-Border Payments Research
- Carnegie Endowment for International Peace: China’s Financial System and Capital Account Dynamics
- Bloomberg Financial Analysis: Global Macro & Digital Currency Integration
- Reuters News & Analysis: Cross-Border Settlement and Global Trade Finance
Discover more from The Economy
Subscribe to get the latest posts sent to your email.
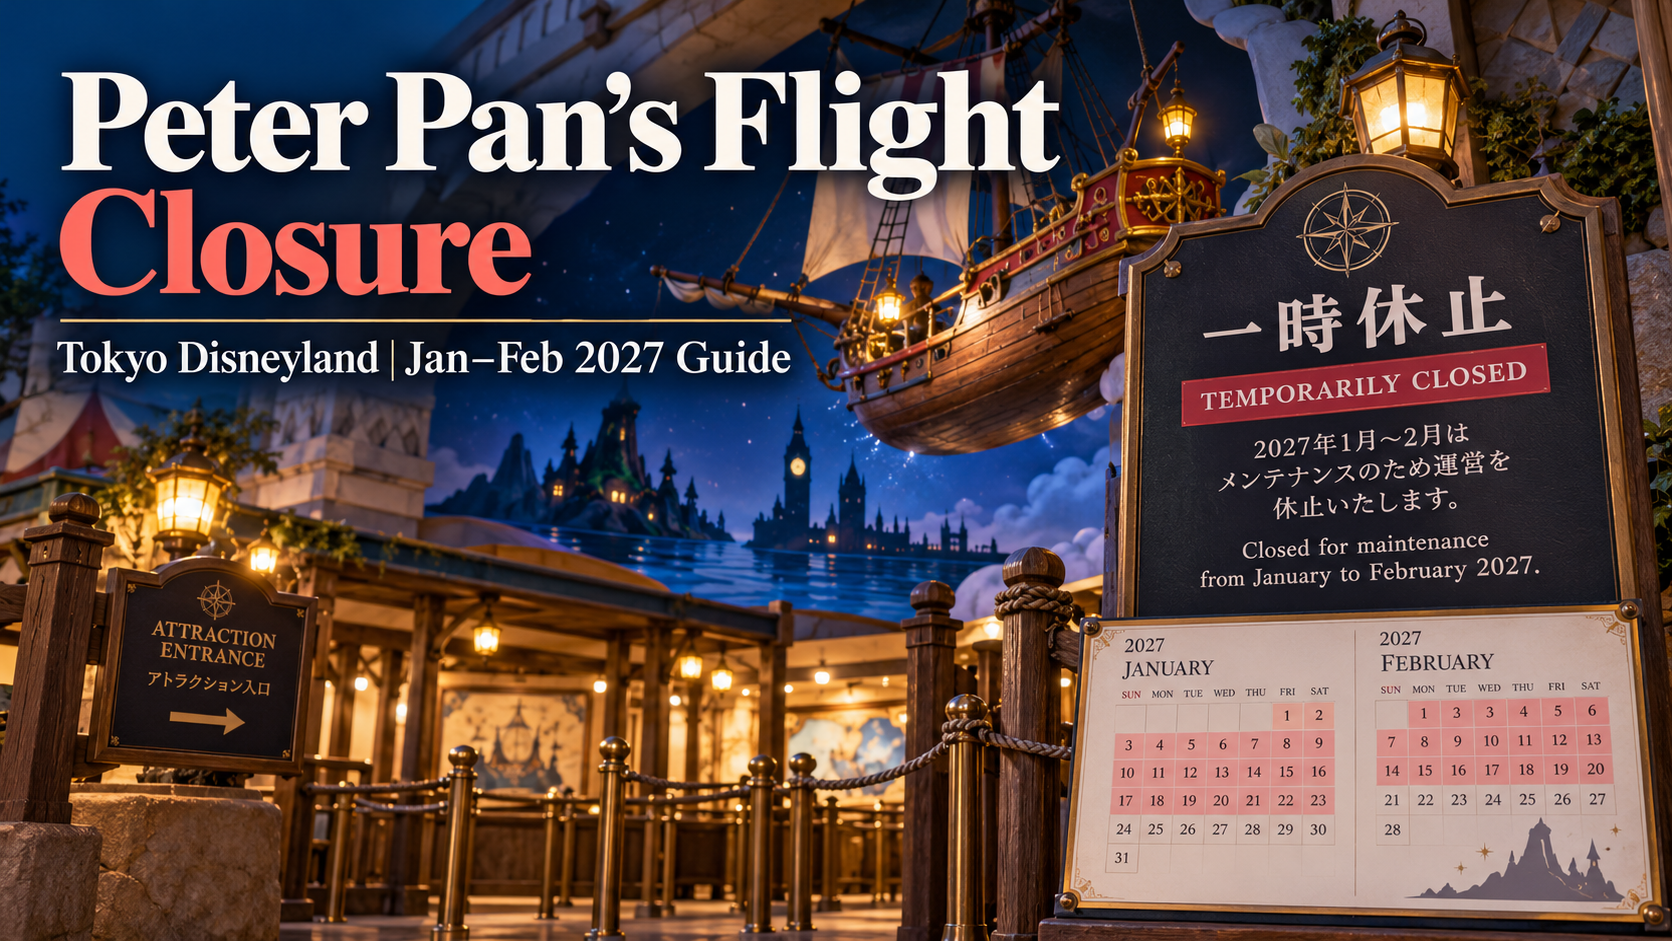
Guests planning a visit to Tokyo Disneyland in early 2027 should put one easily missed detail on their itinerary: Peter Pan’s Flight is scheduled to be temporarily closed from January 6 through February 2, 2027. The operator lists the dates both on its official attraction page and in the Tokyo Disneyland closure schedule. This is a scheduled interruption, not an announcement that the classic ride is being removed permanently. Travelers visiting on dates inside that window should assume the attraction will not be available unless Tokyo Disney Resort publishes a change.
The distinction matters because online references to “Peter Pan closing at Tokyo Disney” can confuse two different parks and two different experiences. Tokyo Disneyland’s Peter Pan’s Flight is a compact Fantasyland ride. Tokyo DisneySea has a separate, newer attraction called Peter Pan’s Never Land Adventure, with its own planned March 2027 maintenance period. The first planning step is making sure the information applies to the ticket you actually bought.
At a glance: what the operator currently says
| Planning question | Verified answer |
|---|---|
| Which attraction? | Peter Pan’s Flight |
| Which park? | Tokyo Disneyland, Fantasyland |
| Scheduled closure starts | January 6, 2027 |
| Scheduled closure ends | February 2, 2027 |
| Reopening expectation | After the listed closure window, subject to operator changes |
| Type of notice | Temporary closure; not announced as permanent |
| Where to recheck | Official attraction listing |
The dates are explicitly labeled as a temporary closure by Tokyo Disney Resort. Do not treat February 3 as an unconditional reopening guarantee: an operator may update maintenance information or temporarily suspend operations for other reasons. Check again shortly before travel and on the day you enter the park.
What is Peter Pan’s Flight?
Peter Pan’s Flight is a dark ride based on the familiar journey from London to Never Land. Guests sit in a flying pirate-ship vehicle that travels through a storybook environment. According to the operator’s ride information, it is in Fantasyland, lasts about two and a half minutes and carries two people per vehicle. It operates indoors and includes dark spaces. These details make it particularly appealing to families who want a gentle, classic Disney experience rather than a high-speed thrill ride.
There are restrictions worth noting even on operating days. The published guidance says a guest must be able to maintain a stable seated position independently and that children may not be held on an adult’s lap during the ride. If your group includes young children, anyone needing seating assistance or visitors uncomfortable with darkness, read the official description and accessibility guidance rather than assuming that the attraction suits everyone because it is short.
Short ride duration is not the same as short waiting time. Demand for well-known classics can vary with crowds, operating conditions and holiday schedules, so it is unwise to schedule a tight sequence of unrelated bookings around a predicted queue. The operator’s app and in-park staff can provide current operating information when the ride is available.
The dates around the closure are not interchangeable
A guest visiting January 5 has a fundamentally different planning position from someone arriving January 6. January 5 falls before the currently listed closure, while January 6 is its opening day. A February 2 visit falls on the final listed day of the maintenance window; February 3 is the earliest day after that window, not a contractual promise that the ride will run.
For a family staying at the resort for multiple days, the difference might be worth changing which day is assigned to Tokyo Disneyland. If one day is before January 6 and another is inside the closure, put Disneyland first if the classic Peter Pan ride is a must-do. But do not swap a park ticket or hotel reservation until you understand the applicable change and cancellation conditions. The economic cost of reshuffling an entire trip can exceed the benefit of experiencing one short ride.
A visitor traveling from overseas may be choosing between a single Disneyland day and a DisneySea day. In that case, consider the trip’s overall priorities. Someone who values vintage Fantasyland attractions may still prefer Disneyland even during the closure. Someone traveling expressly for an immersive Peter Pan adventure could be more interested in the DisneySea attraction—but must buy admission to that different park and verify its own operating schedule.
Other Tokyo Disneyland closures during the same period
The official park maintenance listing shows other attractions with early-2027 closure windows that may overlap your visit. At the time of this review, it lists Jungle Cruise: Wildlife Expeditions from January 6 through March 31, Splash Mountain from January 7 through February 4, and Haunted Mansion from January 8 through February 4. These are operator-published schedules, not independent predictions about refurbishment completion.
This makes the Peter Pan closure more significant for certain visitors than a single unavailable ride might suggest. A group that expected several classic experiences in one afternoon could find multiple priorities temporarily inaccessible. Conversely, the park contains many other attractions and entertainment offerings, and the attractions that remain open should be evaluated on their own current descriptions rather than guessed from historical schedules.
It is worth making a small “must ride / would enjoy / optional” list. Mark each attraction against the closure page. Then build flexibility around weather, performance calendars and queue variation. A plan with alternatives is more resilient than a rigid minute-by-minute schedule.
Better alternatives for different kinds of visitors
If the attraction’s appeal is gentle fantasy storytelling, explore other Fantasyland offerings listed in the official Tokyo Disneyland attraction directory. Filter for ride type and height or access restrictions, and read the current operating details. Do not assume that a neighboring attraction will be open merely because it is not listed in an older travel blog.
If the main attraction is Disney character immersion, devote time to character experiences, themed areas, shopping or scheduled entertainment that is actually available on your day. These can preserve the spirit of the trip without pretending they are substitutes for the ride itself. Some guests will prefer to spend the recovered time on a longer headliner; others may value an unhurried lunch and a park exploration that is less vulnerable to queues.
If the trip is built around Peter Pan specifically, Tokyo DisneySea’s Never Land Adventure may appear attractive. But it is not the same ride: it is a 3D boat-based experience in Fantasy Springs, with different restrictions and a different length. Tokyo Disney Resort’s DisneySea attraction page is the reliable way to compare them. Admission, access arrangements and the day’s capacity remain separate questions.
Parents should also avoid overstating the value of a replacement to children. “Another attraction has pirates” does not make it the planned Peter Pan experience. Setting expectations before entering the park is often more effective than negotiating disappointment in a crowded queue area.
Are refunds or ticket changes automatic?
The announcement of an attraction’s temporary closure does not itself demonstrate that every guest is entitled to a ticket refund or a date change. Theme-park tickets ordinarily grant admission subject to operating conditions, not a binding guarantee that every individual ride will operate. Actual ticket terms, package conditions and any operator-specific accommodation policy govern what can be changed.
Before buying or modifying a pass, review the official Tokyo Disney Resort ticket and reservations guidance and any reseller’s terms. A third-party package might combine transport, hotel rooms and tickets under separate cancellation rules. You should not rely on the statement “ride closed” as a universal reason for a penalty-free cancellation.
If your booking is complex, write down the name of the supplier, reservation reference, exact park date and type of admission. Seek a written answer before paying a change fee. This is particularly important if you plan to move only one day of a multi-day trip and keep the remainder unchanged.
Does Disney Premier Access help during the closure?
No paid queue-management product can make an attraction operate while it is closed. Disney Premier Access is a separate, paid tool for eligible operating experiences; eligibility and availability can change. The official Premier Access guide explains that places may sell out and that the price does not include park admission. It should not be marketed to families as a guaranteed workaround for a published maintenance closure.
The app can nevertheless be useful for other attractions and live operating information. If a ride is unavailable, remove it from the day’s queue-management plan and redirect attention to attractions genuinely offered that day. Check the current product terms before purchasing any additional access.
How to build a more reliable 2027 itinerary
Start with the official attraction closure list rather than the social-media version of it. Choose a date, read the list for the correct park, then check the pages for the two or three attractions most important to your group. If several favorites overlap with closures, compare another travel day, but preserve buffer time and cost limits.
Once you have a provisional itinerary, check whether your whole group can experience the alternatives. A family with a toddler and grandparents may have different needs from a group of teenagers. Ride seating rules, dark environments, height restrictions and walking distances deserve attention before buying optional upgrades.
A week before departure, look at the operator’s park calendar and attraction pages again. On the morning of your visit, follow current app information and staff instructions. Write down a backup plan that does not depend on a single ride reopening on the first conceivable day.
Quick visitor questions
Is Peter Pan’s Flight shutting permanently? The published notice says temporary closure January 6–February 2, 2027. It does not announce permanent removal.
Is it in Tokyo Disneyland or DisneySea? Peter Pan’s Flight is in Tokyo Disneyland’s Fantasyland. DisneySea has the separate Never Land Adventure.
Can I ride on February 2? The current listing includes February 2 in the closure window. Do not plan on riding that day.
Is February 3 the official reopening day? It is the first day after the presently announced closure period, assuming the dates are unchanged. Confirm the park’s live information rather than treating operation as guaranteed.
Should I change my trip? That depends on how important this specific ride is compared with hotel, flights, admission and other attractions. For most travelers, adjusting priorities within the same park is the lower-risk first option.
Final planning advice
This news is not a farewell to Peter Pan’s Flight. It is a defined, temporary gap in the operating calendar. The useful response is to check your exact visit date, compare the rides your family actually cares about and keep a realistic alternative ready. Tokyo Disneyland can still be an appealing destination during the listed closure; the difference between an enjoyable trip and a frustrating one may simply be accurate expectations.
Discover more from The Economy
Subscribe to get the latest posts sent to your email.

Key Takeaways
- Rolex’s secondary market rose approximately 7.9% year-over-year as of 2026 (per WatchCharts data) — trailing Patek Philippe (+16.2%) and Tudor (+11.4%) but still outperforming Audemars Piguet (+3.4%).
- Rolex raised U.S. retail prices 4–9% in January 2026 (steel models ~5.6%, gold models ~8.7%), narrowing the historical gap between retail and pre-owned pricing.
- Not every model appreciates: steel sports references (Submariner, GMT-Master II, Daytona) have held value far better than two-tone or widely available dress references like the standard Datejust.
- The Lady-Datejust posted the sharpest 2026 gain among tracked collections — up 22.73%, from roughly $9,269 to $11,376 — driven by demand for smaller, “everyday luxury” watches.
- Gold’s rise past $2,400/oz has directly lifted the investment case for Rolex’s precious-metal references (Day-Date, Sky-Dweller, Yacht-Master).
The Model-by-Model Picture
| Category | 2026 Trend |
|---|---|
| Lady-Datejust | +22.73% (strongest performer among tracked collections) |
| Steel sports models (Submariner, GMT-Master II) | Held value well; corrected from 2022 peak but stabilized above retail |
| Daytona | Corrected from highs above $50,000 to the mid-$30,000s; still among the most sought-after references |
| Two-tone/widely available Datejust | Flat to negative — “holds value” is an overstatement for this category |
| Gold references (Day-Date, Sky-Dweller) | Lifted by gold’s rise above $2,400/oz |
Why the “Rolex Always Appreciates” Myth Is Fading
The pandemic-era boom pushed some references — the Daytona above all — to speculative highs disconnected from historical norms. Since the March 2022 peak, steel sports models have compressed meaningfully, and dealers who bought inventory near the top have in some cases faced 20–40% markdowns on liquidation. The lesson for 2026 buyers: Rolex as a category is not a monolith. Value retention depends heavily on specific reference, condition, and whether the piece comes with box and papers (“full set”).
What’s Actually Driving 2026 Strength
- Retail price increases raise the floor. When a new Submariner retails at $10,050 (up from $9,500), a pre-owned example at $11,000–$12,000 suddenly represents a smaller premium — narrowing the gap without secondary prices actually moving.
- Supply discipline remains Rolex’s core lever. The brand has never confirmed production numbers, and secondary-market premiums remain entirely a function of Rolex’s own manufacturing decisions — a risk factor as much as a support.
- Certified Pre-Owned rollout. Rolex’s now fully rolled-out CPO program has changed how buyers transact in the used market, adding a layer of brand-verified legitimacy that supports pricing.
The Case for Rolex as a Portfolio Diversifier
Financial advisors increasingly frame luxury watches not as a replacement for equities or bonds, but as a tangible, historically low-correlation diversifier — one that carries its own risks (illiquidity, condition-dependent pricing, no yield) but has demonstrated multi-decade resilience for specific references.
Is Rolex a good investment in 2026?
It depends heavily on the specific reference. Steel sports models like the Submariner and Daytona have held or grown in value; two-tone and widely available dress models generally have not. Overall, Rolex’s secondary market rose about 7.9% year-over-year in 2026, trailing Patek Philippe but ahead of Audemars Piguet.
Discover more from The Economy
Subscribe to get the latest posts sent to your email.

Apple’s Earnings Beat Had a Catch: Look Past the Tariff Refund

Social Security Payments in November 2026: The Full Calendar and Two Important Changes

Johor–Singapore SEZ’s $21.8 Billion Bet: The Hard Part Starts Now

China’s 175 Trillion AI Tokens Reveal a Bigger Shift: The AI Boom

The Philippines’ Stagflation Trap: Higher Interest Rates

Alphabet’s $500 Billion Reckoning: Wall Street Is Losing Patience With the AI Boom

4 Reasons Why China’s Trade Concessions to Europe Will Not Solve the Crisis

The AI Revolution Needs Atomic Power. Southeast Asia Is Ready to Build It.

Zhuhai Airshow 2026: How China’s Stealth Jets, Drones and Missiles Are Redrawing Global Air Power

The $8 Billion Runway: China’s Strategic Bet on Guangzhou and the Future of Aviation

The Sandbox Imperium: Why Beijing’s Digital Yuan Needs Hong Kong

Gold at the $4,000 Line: Possible December Fed Hike

Oil at $100+: Hormuz, a Qatari Peace Draft and the Iran Deadline

The Fed’s 10-2 Hold: Why Two Dissenters Wanted a Rate Hike

Crude Oil & Petroleum Market Analysis: OPEC+ Decisions and Price Forecasts

Top US Convenience Store Chains: Store Counts, EV Charging, and Sales Trends

Social Security Extra $90 Deposit: Who Qualifies for the October 2026 Medicare Rebate?

Gold Price Outlook 2026: The Forces Behind the Forecasts—and What Could Reverse Them

Who Is Shivon Zilis? The Neuralink Executive at the Center of the Musk–OpenAI Trial

Algorithmic Dogfights: Why the U.S. and China Must Establish Rules of Engagement for Autonomous Air Power

Corporate America Faces a New Debt Test as US Borrowing Costs Surge

Global Economic Outlook 2026: 7 Forces Reshaping Markets, Trade and Business

Stock Market Crash in 2026? Warning Signs, Scenarios and a Calm Investor Checklist

Stock Market Today: Dow, S&P 500, and Nasdaq Retreat as Treasury Yields

Anthropic Bans Sustained Abuse of Claude AI Under New Usage Policy Effective November 12, 2026

US–Iran Conflict in October 2026: Hormuz, Oil Prices and Diplomacy

Geopolitics and Your Portfolio: How International Affairs Move Global Markets

Why Did I Get $90 From Social Security? 8 Reasons Behind an Unexpected SSA Payment
-

 Markets & Finance10 months ago
Top 15 Stocks for Investment in 2026 in PSX: Your Complete Guide to Pakistan’s Best Investment Opportunities
-

 Analysis8 months ago
Johor’s Investment Boom: The Hidden Costs Behind Malaysia’s Most Ambitious Economic Surge
-

 Analysis9 months ago
Top 10 Stocks for Investment in PSX for Quick Returns in 2026
-

 Banks10 months ago
Best Investments in Pakistan 2026: Top 10 Low-Price Shares and Long-Term Picks for the PSX
-

 Analysis9 months ago
Brazil’s Rare Earth Race: US, EU, and China Compete for Critical Minerals as Tensions Rise
-

 Investment10 months ago
Top 10 Mutual Fund Managers in Pakistan for Investment in 2026: A Comprehensive Guide for Optimal Returns
-

 Global Economy10 months ago
15 Most Lucrative Sectors for Investment in Pakistan: A 2025 Data-Driven Analysis
-

 Global Economy10 months ago
Pakistan’s Export Goldmine: 10 Game-Changing Markets Where Pakistani Businesses Are Winning Big in 2025