
Tariffs
Trump’s Greenland Gambit: How Tariffs on Eight European Allies Could Reshape the Transatlantic Alliance
On the frigid evening of January 17, 2026, President Donald Trump lobbed what may prove to be the most audacious—and potentially destructive—ultimatum of his second term across the Atlantic. Via his preferred digital megaphone, Truth Social, Trump announced sweeping tariffs targeting eight of America’s closest European allies: Denmark, Norway, Sweden, France, Germany, the United Kingdom, the Netherlands, and Finland. The levy, set at 10% on all imported goods beginning February 1 and escalating to 25% from June 1, comes with a singular, extraordinary condition: the “Complete and Total purchase of Greenland” by the United States.
The declaration sent tremors through diplomatic channels, financial markets, and NATO headquarters alike. Within hours, European capitals responded with a mixture of bewilderment, outrage, and steely resolve. Danish Prime Minister Mette Frederiksen, who had previously dismissed Trump’s Greenland overtures as “absurd,” condemned the tariff threat as “economic blackmail” that violates fundamental principles of international law and alliance solidarity. German Chancellor’s office termed the move “incomprehensible,” while French officials warned of swift EU-wide countermeasures.
This is not merely another chapter in Trump’s unpredictable trade policy playbook. It represents a fundamental reassessment of America’s relationship with its oldest democratic partners—one that prioritizes Arctic ambitions and resource nationalism over seven decades of transatlantic cooperation. The question facing European leaders and global observers is stark: Is this a negotiating tactic from a president known for brinkmanship, or does it signal a permanent fracturing of the Western alliance at precisely the moment when unity matters most?
The Island That Haunts Trump’s Strategic Imagination
Trump’s fixation on Greenland is neither new nor entirely irrational, even if his methods appear extraordinary. The world’s largest island has occupied a peculiar space in American strategic thinking since 1946, when President Harry Truman offered Denmark $100 million for outright purchase—a proposal politely declined. During the Cold War, the United States established Thule Air Base in northwest Greenland, which remains a critical early-warning station for ballistic missile detection and satellite surveillance, now upgraded to monitor threats from Russia and China.
Trump first publicly floated the purchase idea in August 2019, initially reported as a jest before the then-president confirmed serious interest. The proposal met swift rejection from both Denmark and Greenland’s autonomous government, prompting Trump to cancel a scheduled state visit to Copenhagen in a diplomatic snub that reverberated for months. At the time, analysts dismissed the episode as characteristic Trump bluster—a distraction from domestic troubles or perhaps genuine curiosity about an unconventional deal.
Yet the intervening years have transformed Greenland from a geopolitical curiosity into a strategic imperative in Washington’s eyes. The Arctic is warming twice as fast as the global average, opening previously ice-locked sea routes and revealing vast mineral wealth beneath Greenland’s melting ice sheets. Geological surveys suggest the island harbors significant deposits of rare earth elements—including neodymium, praseodymium, and dysprosium—critical for electric vehicles, wind turbines, advanced weaponry, and semiconductors. China currently controls roughly 70% of global rare earth production and 90% of processing capacity, creating what Pentagon strategists view as an unacceptable vulnerability in supply chains for both commercial technology and defense systems.
Russia’s 2022 invasion of Ukraine and subsequent militarization of its Arctic territories has further elevated Greenland’s importance. Moscow has reopened Soviet-era bases along its northern coastline, deployed advanced anti-access/area denial systems, and conducted frequent bomber patrols near North American airspace. China, despite being a “near-Arctic” nation by its own creative geography, has declared itself a “Polar Silk Road” power, investing in Icelandic infrastructure and conducting research expeditions that European intelligence agencies suspect serve dual civilian-military purposes.
For Trump and his advisers, Greenland represents the ultimate “art of the deal”—a territorial acquisition that would simultaneously secure critical minerals, establish American dominance in the Arctic, and cement a legacy comparable to the Louisiana Purchase or Alaska acquisition. The fact that such a deal contradicts modern international norms regarding self-determination and sovereignty appears, in this calculation, a manageable obstacle rather than a disqualifying one.
The Tariff Ultimatum: Mechanics and Targeted Impact
The tariffs Trump announced represent a significant escalation in both scope and justification. Unlike his first-term steel and aluminum levies, ostensibly grounded in Section 232 national security provisions, or his China tariffs under Section 301, these measures reportedly invoke the International Emergency Economic Powers Act (IEEPA)—an assertion of presidential authority typically reserved for sanctions against hostile nations like Iran or North Korea, as legal experts have noted with alarm.
The eight targeted nations collectively represent America’s third-largest trade relationship, with bilateral goods trade totaling approximately $680 billion annually. The economic pain would be unevenly distributed but universally felt:
Denmark, though a modest trading partner with roughly $15 billion in annual bilateral trade, faces disproportionate leverage given its sovereignty over Greenland. Danish pharmaceutical giants like Novo Nordisk—which supplies approximately 50% of the world’s insulin and has invested billions in US manufacturing—could see profit margins compressed and supply chains disrupted. The country’s wind energy sector, led by Vestas and Ørsted, exports significant turbine components to American renewable projects that could face cost increases precisely when the US seeks to expand green energy capacity.
Germany, America’s largest European trading partner with $267 billion in bilateral trade, confronts the most severe economic exposure. The automotive sector—BMW, Mercedes-Benz, and Volkswagen together exported over $24 billion worth of vehicles to the US in 2025—would face punishing costs that could render German cars uncompetitive against American, Japanese, and Korean alternatives. German machinery, chemicals, and precision instruments, which underpin countless American manufacturing processes, would ripple through industrial supply chains with inflationary consequences for US businesses and consumers.
The United Kingdom, still navigating post-Brexit trade relationships, sees roughly $132 billion in annual goods and services trade with America potentially jeopardized. While services trade might initially escape tariffs, financial institutions, consulting firms, and creative industries fear retaliatory measures or secondary impacts. British Aerospace, with deep integration into US defense projects including the F-35 fighter program, faces potential disruption despite ostensible national security carve-outs.
France, the Netherlands, Sweden, Norway, and Finland each face sector-specific vulnerabilities: French aerospace and luxury goods, Dutch chemicals and refined petroleum, Swedish automobiles and telecommunications equipment, Norwegian seafood and aluminum, and Finnish paper products and technology exports all enter the crosshairs. Collectively, these represent not just bilateral relationships but intricate European supply chains that feed American consumers and manufacturers.
The escalation timeline—from 10% to 25%—appears designed to maximize pressure while offering a narrow window for capitulation. A 10% tariff might be absorbed through currency adjustments or marginal price increases; a 25% levy would fundamentally alter trade flows, forcing companies to relocate production, seek alternative markets, or accept devastating market share losses.
Europe’s Response: Unity, Defiance, and Legal Recourse
European reaction has been swift, coordinated, and unambiguous. Within 24 hours of Trump’s announcement, European Commission President Ursula von der Leyen convened an emergency meeting of EU trade ministers, emerging with a preliminary retaliatory package targeting $75 billion in American exports—from Kentucky bourbon and Harley-Davidson motorcycles to California almonds and Florida orange juice, mirroring the effective pressure tactics employed during Trump’s first-term steel tariffs.
Critically, the European response extends beyond mere economic retaliation. Legal experts within the EU have begun preparing a complaint to the World Trade Organization, arguing that IEEPA invocation for territorial acquisition constitutes an abuse of emergency powers and violates foundational WTO principles. While WTO dispute resolution typically proceeds slowly—often requiring years for final rulings—the symbolic importance of challenging American legal rationale cannot be overstated. It frames the conflict not as a legitimate trade dispute but as an arbitrary exercise of power that threatens the multilateral trading system itself.
NATO allies face a particularly acute dilemma. The alliance, already strained by burden-sharing debates and divergent threat perceptions regarding Russia and China, now confronts a fundamental question: Can collective defense coexist with economic coercion among members? Several European defense ministers have privately expressed concern that Trump’s tariff threats undermine the alliance’s credibility at precisely the moment when Russian aggression demands unity. NATO Secretary General Mark Rutte, in carefully calibrated remarks, emphasized that “economic disputes must not weaken our shared security commitments,” a plea that acknowledges deep anxiety about alliance cohesion.
Perhaps most significantly, Greenland itself has asserted its voice in ways that complicate Trump’s narrative. Múte Bourup Egede, Greenland’s Premier, issued a statement reiterating that “Greenland is not for sale and will never be for sale,” while emphasizing the island’s ongoing path toward full independence from Denmark. Greenland’s 57,000 inhabitants, predominantly Indigenous Inuit, have increasingly demanded autonomy over their resource development and foreign relations—a self-determination claim that makes external purchase proposals both legally dubious and morally fraught. Greenlandic officials have suggested openness to expanded US investment and security cooperation, but firmly within frameworks respecting sovereignty rather than territorial transfer.
Economic Consequences: Beyond the Spreadsheet
Trade wars, as economists wearily remind policymakers, rarely produce clear winners. The immediate impact of Trump’s Greenland tariffs would be quantifiable: the Peterson Institute for International Economics estimates that a full 25% tariff regime could reduce US GDP growth by 0.3-0.5 percentage points while increasing consumer prices by $850-1,200 per household annually through higher costs for vehicles, pharmaceuticals, machinery, and consumer goods.
European economies would suffer comparably, with Germany potentially seeing GDP contraction of 0.4% and manufacturing job losses concentrated in export-dependent regions. Smaller Nordic economies, heavily reliant on US markets for specialized exports, could face sharper downturns. The Netherlands, a critical logistics hub for European-American trade, would experience cascading effects through Rotterdam’s ports and distribution networks.
Yet the deeper consequences extend beyond quarterly earnings reports. Global supply chains, painstakingly constructed over decades to optimize efficiency and resilience, would face abrupt reconfiguration. American pharmaceutical companies relying on Danish active ingredients or German precision equipment would scramble for alternative suppliers—often at higher cost and lower quality. European manufacturers would accelerate efforts to diversify away from American markets, potentially strengthening trade ties with China, India, and Southeast Asia in ways that diminish long-term US influence.
Financial markets, initially wobbling on tariff announcement day with the S&P 500 dropping 1.8%, face sustained uncertainty. Currency volatility—particularly euro-dollar fluctuations—could destabilize international transactions and complicate central bank monetary policy. Investment flows, already cautious amid geopolitical tensions, might retreat further from transatlantic ventures, starving promising technologies and industries of capital.
The rare earth dimension adds peculiar irony to Trump’s strategy. While Greenland theoretically harbors valuable deposits, actual extraction would require decades of infrastructure development, environmental assessments, and community consultation—hardly a near-term solution to Chinese dominance. Meanwhile, alienating European allies who are themselves seeking to diversify rare earth supply chains squanders opportunities for coordinated Western resource strategies that might genuinely challenge Beijing’s monopoly.
The Geopolitical Chessboard: Arctic Ambitions and Alliance Erosion
Beneath the tariff theatre lies a substantive geopolitical question: What does American leadership mean in the 21st century? Trump’s Greenland gambit reflects a worldview increasingly common among American nationalists—that alliances are transactional arrangements to be leveraged for discrete national advantages rather than collective security frameworks requiring mutual sacrifice and long-term commitment.
This philosophy stands in stark contrast to the architecture that has defined Western security since 1949. NATO’s Article 5 mutual defense guarantee assumes that an attack on one member constitutes an attack on all—a principle tested after 9/11 when European allies invoked the clause on America’s behalf, deploying forces to Afghanistan for two decades. The EU-US partnership on sanctions against Russia, technology export controls on China, and climate cooperation similarly presumes shared interests transcending narrow economic calculation.
Trump’s willingness to economically coerce NATO allies fundamentally challenges this framework. If the United States will threaten Denmark—a loyal ally hosting critical defense infrastructure and deploying forces to US-led missions from Iraq to Mali—over territorial ambitions, what restraints apply to American pressure on any partner? The message to European capitals is clear: alignment with Washington offers no protection from Washington’s demands.
The Arctic dimension complicates matters further. All eight nations targeted by Trump’s tariffs are Arctic Council members, engaged in scientific cooperation and environmental governance in the far north. Norway and Finland share Arctic borders with Russia; Sweden recently joined NATO explicitly to enhance Arctic security; Denmark (via Greenland) and the United States are the region’s dominant territorial powers. Effective Arctic strategy—whether addressing Russian militarization, Chinese economic penetration, or climate change impacts—requires precisely the coordinated approach that Trump’s unilateralism undermines.
Russia and China observe these fissures with undisguised satisfaction. Moscow’s propaganda apparatus has gleefully highlighted Western disunity, while Chinese state media frames Trump’s tactics as evidence of American imperial decline and unreliability. Beijing, simultaneously facing its own tariff battles with Washington, sees opportunity to position itself as a more stable economic partner for European nations seeking alternatives to American volatility. The strategic competition that ostensibly motivates Trump’s Greenland interest may actually be advanced by the very methods he employs to pursue it.
Precedents, Parallels, and the Question of Feasibility
Historical parallels to Trump’s approach are scarce and sobering. The United States has acquired territory through purchase—Louisiana from France in 1803, Alaska from Russia in 1867, the Virgin Islands from Denmark in 1917—but always through willing seller-buyer transactions, often driven by the seller’s financial desperation or strategic realignment. Modern international law, codified in the UN Charter and subsequent frameworks, explicitly rejects territorial transfer without the consent of governed populations.
The Virgin Islands precedent, interestingly involving Denmark, occurred during World War I when Copenhagen faced potential German occupation and desperately needed funds. The $25 million transaction (equivalent to roughly $600 million today) came after decades of Danish-American negotiations, formal ratification by both governments, and—crucially—no meaningful consultation with the islands’ inhabitants, reflecting colonial-era norms now universally rejected.
Greenland’s situation differs fundamentally. The island enjoys substantial autonomy under Denmark’s constitutional framework, with local government controlling most domestic affairs while Copenhagen manages foreign relations and defense. Greenland has pursued gradual independence, achieving self-governance in 1979 and expanded autonomy in 2009, with full sovereignty theoretically achievable through referendum. Any transfer of sovereignty—whether to full independence or hypothetically to another nation—would require Greenlandic consent through democratic processes that current polling suggests would overwhelmingly reject American purchase.
The tariff mechanism itself carries ominous precedent from Trump’s first term. Steel and aluminum tariffs imposed in 2018 under Section 232 national security justifications triggered retaliatory cycles that harmed American farmers, manufacturers, and consumers while achieving minimal strategic benefit. The Phase One trade deal with China, celebrated by Trump as a historic victory, saw Beijing fall short of purchase commitments while American concessions on Huawei and technology transfer went substantially unreciprocated. Subsequent economic analyses suggested that American consumers and businesses bore the primary cost of Trump’s trade wars through higher prices and disrupted supply chains.
Legal experts question whether IEEPA, designed for sanctions against hostile actors threatening US national interests, can legitimately justify tariffs aimed at coercing friendly democracies into property sales. Constitutional scholars note that while presidents enjoy broad trade authorities, using them for purposes unrelated to trade policy or genuine national emergencies potentially exceeds statutory authorization and invites judicial challenge. The prospect of courts intervening in foreign policy remains uncertain, but the legal architecture appears shakier than Trump’s confident pronouncements suggest.
Scenarios and Futures: Where Does This End?
As European and American officials absorb the initial shock, several potential pathways emerge, each carrying distinct implications for transatlantic relations and global order.
Scenario One: Strategic Capitulation and Creative Dealmaking. Perhaps least likely but most aligned with Trump’s apparent hopes, Denmark and Greenland could interpret the tariff threat as sufficiently severe to explore unprecedented arrangements. Rather than outright sale, imaginative diplomacy might yield a 99-year lease model (similar to Hong Kong’s pre-1997 status), expanded US basing rights, joint resource development agreements, or substantial American infrastructure investment in exchange for privileged access to minerals and strategic facilities. This outcome would require Greenlandic leadership to view American partnership as preferable to continued Danish association and incipient independence—a calculation that current political sentiment does not support but economic realities and Chinese pressure might eventually encourage.
Scenario Two: Managed De-escalation Through Face-Saving Compromise. More plausibly, intense diplomatic engagement over the coming weeks could produce a formula allowing Trump to claim victory while European allies avoid economic catastrophe. Enhanced US-Greenland bilateral cooperation, formalized through treaties or executive agreements, might address legitimate American security and resource concerns without sovereignty transfer. Denmark could facilitate expanded American military presence or rare earth development partnerships, framed as alliance strengthening rather than territorial concession. Trump could declare that improved Arctic access and resource agreements satisfy US interests, suspending tariffs while preserving rhetorical claims about Greenland’s importance. This path requires European willingness to reward American coercion with substantive concessions—a precedent with troubling implications but potentially preferable to economic warfare.
Scenario Three: Mutual Escalation and Transatlantic Rupture. The darkest timeline sees neither side blinking as February 1 approaches. American tariffs take effect at 10%, triggering immediate EU countermeasures targeting politically sensitive US exports and states. Financial markets deteriorate amid uncertainty; businesses accelerate supply chain reconfiguration; political rhetoric hardens on both sides. The June 1 escalation to 25% produces genuine economic pain—job losses in German automotive regions, pharmaceutical shortages in American markets, inflationary pressures complicating monetary policy. NATO faces existential questions about its viability when economic and security interests diverge so sharply. US-European cooperation on China, Russia, climate, and technology fractures as mutual recrimination overwhelms shared interests. This scenario, while catastrophic, cannot be dismissed given Trump’s demonstrated willingness to sustain confrontation and European determination not to reward extortion.
Scenario Four: Domestic American Constraint. An often overlooked possibility involves American political and economic actors constraining Trump’s ambitions. US businesses dependent on European imports—pharmaceutical companies, auto manufacturers, technology firms—would lobby intensively for tariff reversal or exemption. Congressional Republicans, facing midterm elections in 2026 and constituent pressure from affected industries, might threaten legislation curtailing presidential tariff authorities or blocking IEEPA invocation for non-emergency purposes. Federal courts could issue injunctions questioning the legal basis for tariffs, forcing administration lawyers into prolonged litigation. While Trump demonstrated during his first term a capacity to resist such pressures, the economic stakes here are substantially higher, potentially mobilizing more formidable domestic opposition.
What This Reveals About American Power and Its Limits
Beyond the immediate diplomatic crisis and economic calculations lies a more fundamental question about the nature of American power in the 2020s. Trump’s Greenland gambit embodies a particular vision of strength—one rooted in unilateral action, economic leverage, and transactional relationships rather than alliance management, institutional frameworks, and long-term strategic patience.
This approach contains internal contradictions that European observers have noted with a mixture of concern and strategic calculation. The United States seeks to counter Chinese influence in critical mineral supply chains and Arctic regions, yet does so by alienating the very partners whose cooperation would be essential for any successful containment strategy. America demands loyalty and burden-sharing from NATO allies while demonstrating that loyalty provides no immunity from Washington’s economic coercion. The administration champions sovereignty and self-determination in contexts like Taiwan or Ukraine while dismissing those same principles when applied to Greenland.
These contradictions do not necessarily doom Trump’s approach—inconsistency has rarely constrained effective exercise of power—but they do reveal limits. American economic leverage over Europe remains substantial but not absolute; the EU collectively represents a $17 trillion economy with capacity to absorb short-term pain while diversifying partnerships. Military alliances cannot be sustained indefinitely through intimidation alone; at some threshold, partners conclude that autonomy and alternative arrangements serve their interests better than subordination to an unreliable hegemon.
The Greenland episode may ultimately be remembered less for its specific outcome—whether Trump secures mineral agreements, basing rights, actual territory, or nothing at all—than for what it clarifies about early 21st-century geopolitics. We inhabit an era where even the closest democratic partnerships face strain from nationalism, resource competition, and divergent threat perceptions. The post-1945 liberal international order, built on American leadership and institutional cooperation, confronts challenges from without (authoritarian powers) and within (democratic leaders questioning multilateralism’s value).
Trump’s tariff ultimatum forces allies to answer uncomfortable questions: What price are Europeans willing to pay for transatlantic partnership? Can NATO survive fundamental economic disputes among members? How do middle powers navigate a world where the superpower they’ve relied upon for protection increasingly treats them as adversaries in resource competition?
Conclusion: The Weight of an Island in a Fragmenting World
Greenland, an island of 57,000 souls, spectacular fjords, and melting ice sheets, never asked to become the flashpoint for transatlantic crisis. Its strategic importance is real—the Arctic is indeed warming, minerals are genuinely critical, and great power competition increasingly focuses on polar regions. But the manner in which Trump has chosen to pursue American interests transforms a potential opportunity for cooperative Western strategy into a loyalty test that may fracture the alliances such strategy requires.
As February 1 approaches and European capitals weigh their responses to Trump’s Greenland tariffs, the world watches a stress test of the Western alliance’s resilience. The immediate question—whether Denmark will negotiate, Trump will relent, or economic warfare will escalate—matters enormously for trade flows, market stability, and political careers. But the deeper inquiry concerns whether democracies can sustain cooperation in an age of resource nationalism, where even longtime partners view each other’s assets as potential acquisitions and deploy economic coercion against friends with the same ruthlessness once reserved for adversaries.
History suggests that great powers overestimate their leverage and underestimate their partners’ capacity for independent action. Rome discovered this as client kingdoms rebelled; Britain learned it as colonies demanded independence; the Soviet Union realized it as satellites broke away. Whether the United States is embarking on a similar trajectory—transforming allies into adversaries through arrogance and overreach—remains uncertain.
What is clear is that Trump’s Greenland gambit represents something more consequential than another unpredictable presidential pronouncement. It is a wager on the nature of power itself: whether strength derives from the capacity to compel or the wisdom to cooperate, whether interests are best served through intimidation or partnership, whether the future belongs to those who dominate or those who build coalitions capable of addressing shared challenges.
The answer will shape not just Greenland’s fate or transatlantic trade, but the structure of international order for decades to come. An island in the Arctic has become a mirror reflecting the fractures in the Western alliance—and perhaps the fault lines along which our geopolitical era will ultimately break.
Discover more from The Economy
Subscribe to get the latest posts sent to your email.


Kevin Warsh sat through his first Federal Reserve meeting as chairman on June 17, 2026, and delivered exactly what the White House didn’t want. The Fed’s hawkish shift in US interest rates sent the dollar to its strongest level in more than a year within minutes of the announcement. The Federal Open Market Committee held the federal funds rate steady at 3.50%-3.75%, an outcome almost nobody disputed. What traders hadn’t priced in was the Fed’s updated rate projections, which flipped from forecasting a cut this year to signaling a possible hike. The Dollar Index broke through 100 before the press conference even started, dragging the euro, the pound and the yen lower and forcing currency desks across six continents to rewrite their models overnight.
The Macro Backdrop: Inflation, Oil and a New Chair
The timing matters. Warsh took the gavel in May after one of the most contentious confirmation battles in Fed history — a 54-45 Senate vote that split almost entirely along party lines, according to NPR’s coverage of the confirmation. President Trump pushed hard for a chair who would cut rates aggressively. Instead, the Middle East conflict that has disrupted Gulf oil shipments pushed energy costs higher across every major economy, and Warsh’s first Summary of Economic Projections leaned the other way entirely.
The Fed’s median forecast for Personal Consumption Expenditures (PCE) inflation this year jumped to 3.6%, up from 2.7% in March, with core PCE — which strips out food and energy — revised to 3.3%, according to reporting on Warsh’s confirmation hearing and the rate path that followed. That single revision did more to move currency markets than the rate hold itself.
The decision also landed in the middle of an unusually crowded week for global rate-setters. The Bank of England met the following day. The European Central Bank had already held its deposit rate at 2.00% weeks earlier while openly debating whether to reverse course. The Bank of Japan continued its slow, deliberate path toward policy normalization. For currency traders, that compressed calendar meant every signal from Washington got measured instantly against what London, Frankfurt and Tokyo were doing — or not doing — in response.
Section 1: Inside the Dot Plot Flip
The headline number — 3.50% to 3.75% — told only half the story. The real shift sat in the Summary of Economic Projections, the Fed’s quarterly grid of where each official expects rates to land. The median projection for the federal funds rate at the end of 2026 rose to 3.8%, up from 3.4% in March. Because the current target range’s midpoint sits near 3.625%, that median crossed from implying a cut this year to implying a hike — a genuine reversal, not a rounding error.
Of the 18 officials who submitted forecasts, nine expected at least one rate hike before year-end, eight saw no change, and just one projected a cut, according to CNBC’s live coverage of the meeting. Warsh himself broke with tradition and declined to submit a dot at all, telling reporters the exercise wasn’t useful for the actual conduct of policy — an unusual stance for a sitting chair to take in his first month on the job.
Markets had been bracing for some version of this outcome for weeks. After May’s jobs report came in stronger than expected, traders priced in lower odds of a cut at the June meeting and pushed the implied probability of a hike by year-end toward 70%, according to figures CNBC’s Jeff Cox relayed from futures markets ahead of the decision. Strategists at BNP Paribas went further, warning that if the Fed failed to deliver a sufficiently hawkish signal, the bond market might begin tightening conditions on its own — effectively forcing the central bank’s hand regardless of what the committee voted. The FOMC’s actual decision to hold rates passed unanimously, a 12-0 vote that masked just how divided the projections underneath it had become.
Markets reacted instantly. The Dollar Index (DXY) spiked through the 100.00 handle to a session high just above it, having hovered in the high 99s into the decision, according to FXStreet’s market analysis of the announcement. That’s the index’s highest level since May 2025. A few currency moves stood out immediately:
- EUR/USD slid toward 1.15 as the euro absorbed the bulk of the dollar’s gain — the euro alone makes up more than half the DXY basket.
- GBP/USD dropped to around 1.343, complicating the Bank of England’s own rate decision a day later.
- USD/JPY pushed to roughly 161.30, within striking distance of the 161.62 peak last touched in July 2024, when Tokyo last intervened to defend the yen.
Goldman Sachs Asset Management’s Kay Haigh, global co-head and chief investment officer of fixed income and liquidity solutions, framed the shift as more than an oil story. Half the committee now expects a hike this year, he noted, reflecting strength in the labor market and inflation data that predates the latest spike in energy prices. His base case still calls for the Fed to avoid hikes altogether, but he described the path as narrow — and entirely dependent on the next several inflation reports.
Section 2: Why the Dollar’s Surge Reflects More Than One Rate Decision
Currency strategists have a name for this pattern: divergence. Interest-rate differentials — not absolute rate levels — are what move exchange rates, and on June 17 the gap between US policy and everywhere else widened in one stroke. The European Central Bank held its deposit rate at 2.00% in its last meeting, with policymakers debating a hike but stopping short. The Bank of Japan has raised rates gradually but remains far behind the Fed in absolute terms. Every basis point of that gap shows up in currency pricing within hours, not weeks.
How does a hawkish Fed affect currency markets?
A hawkish Fed signal typically strengthens the dollar by widening interest-rate differentials with other major economies, making dollar-denominated assets more attractive to global investors. Higher US yields draw capital inflows, pressuring the euro, pound and yen lower while raising borrowing costs for emerging-market governments and companies holding dollar debt.
That’s the textbook mechanism. The picture is more complicated this cycle because the inflation driving the Fed’s hand is largely energy-led rather than demand-led. Analysts increasingly distinguish between two flavors of “higher for longer”: rates that stay elevated because the economy is genuinely overheating, and rates that stay elevated because a supply shock — in this case, the Middle East conflict’s effect on Gulf shipping lanes — is pushing prices up independent of demand. The same projected rate path can carry very different signals depending on which force dominates, and the Fed’s own statement language hints at the ambiguity. June’s release described inflation as “elevated relative to the Committee’s 2 percent goal” and tied the pressure partly to supply shocks, while also dropping earlier language about possible additional easing.
That distinction matters enormously for currency traders. A demand-driven hawkish shift tends to be durable, supporting sustained dollar strength. A supply-shock-driven shift can reverse quickly once the underlying disruption clears — which is precisely the bet some desks are now making against the dollar’s rally.
Section 3: Who Absorbs the Pressure From Here
The second-order effects are already visible. Emerging-market currencies face what analysts call a double bind when the dollar strengthens: their own exchange rates weaken at the same time their dollar-denominated borrowing costs rise, squeezing government and corporate balance sheets simultaneously. Countries that built up dollar debt during the previous easing cycle are the most exposed.
Japan’s situation illustrates the strain at the developed-market end of the spectrum. The yen has weakened roughly 11% against the dollar over the past 12 months and is trading near territory last seen in July 2024 — the same level that triggered direct intervention from Japanese authorities, according to TradingEconomics’ currency tracking data. Japan’s Chief Cabinet Secretary has already signaled the government stands ready to act if volatility becomes excessive, language officials typically reserve for periods immediately preceding intervention.
In the United Kingdom, the Bank of England held its own Bank Rate at 3.75% on June 18, the day after the Fed’s decision, with UK inflation sitting at 2.8% but expected to climb again as the energy shock works through the economy, according to the Bank of England’s own policy statement. A weaker pound compounds that imported-inflation risk directly, since a large share of the UK’s energy and goods imports are priced in dollars. Mortgage lenders had already begun trimming fixed-rate deals in the weeks before the announcement, betting on a steadier rate path — a bet that now looks shakier if sterling keeps sliding and imported costs feed back into the Bank’s own inflation forecasts.
The mechanics that hurt emerging markets aren’t unique to any one country; they repeat in slightly different form from Ankara to Jakarta to São Paulo. Governments and corporates that issued dollar bonds when borrowing was cheap now face a currency mismatch: revenue collected in local currency, debt service owed in dollars that buy more of that local currency by the week. Central banks in those economies often respond by raising their own rates defensively, even when domestic conditions don’t call for it, simply to keep capital from fleeing toward higher US yields. That defensive tightening is itself a cost of the Fed’s hawkish shift, even though it never shows up in any US economic data release.
US equity markets felt the pull, too, though less violently. The dollar’s strength acts as a drag on multinational earnings: every sustained 10% rise in the Dollar Index has historically shaved 2% to 4% off S&P 500 earnings per share, concentrated in the most globally exposed names. Companies generating more than half their revenue overseas — a group that includes major technology and consumer-goods firms — see reported earnings shrink in dollar terms even when underlying demand abroad hasn’t changed. The S&P 500 itself held up reasonably well around the announcement, trading near 6,827, but strategists flagged growth stocks and long-duration bonds as the segments most likely to face continued valuation pressure if the hawkish path holds.
Section 4: The Dissenting Case
Not every serious analyst accepts that the Fed’s hawkish turn will stick. The single FOMC member who still projected a rate cut represents a real minority view, not a rounding error, and the argument behind it deserves a hearing. Bank of England Governor Andrew Bailey has used similar language about his own committee, telling reporters the Bank is “in no rush to raise rates” even as a minority of his colleagues pushed for a hike in April. The implicit logic on both sides of the Atlantic: an energy-driven inflation spike tied to a specific geopolitical conflict is a different animal from inflation rooted in an overheating economy, and central banks that over-tighten in response risk choking off growth just as the original shock fades.
Goldman’s Kay Haigh made essentially the same point from the sell side — his team’s base case still has the Fed avoiding a hike this year, with incoming inflation data, not the dot plot, as the deciding factor. The IMF’s broader consensus view leans toward holds rather than further tightening across most major economies for the remainder of 2026, betting that energy prices normalize before central banks feel compelled to act on the dot plot’s signal.
Skeptics of the dovish case counter that supply shocks have a habit of becoming embedded once businesses start passing higher input costs through to wages and consumer prices — the exact transmission mechanism the Bank of England flagged in its own June statement. That risk is why nine of eighteen Fed officials were willing to put a hike on paper despite the shock’s obvious geopolitical origin. Both camps are, in effect, making the same bet on how long the Middle East conflict drags on — they just disagree on what to do about it in the meantime.
The Bottom Line
The Fed’s hawkish shift didn’t emerge from a single data point or a single voice on the committee. It emerged from the collision of a genuinely uncertain inflation outlook with a new chairman determined to establish credibility independent of the president who appointed him. Warsh was picked, in part, on the expectation that he’d deliver the rate cuts Trump has demanded publicly and repeatedly. Instead, his first meeting in the chair produced the opposite signal — and currency markets, which trade on differentials rather than headlines, reacted within minutes rather than waiting for confirmation. Whether that signal survives the next two inflation reports is the question every desk from London to Tokyo is now pricing for, and the answer will likely arrive long before the Fed’s next scheduled meeting does.
Discover more from The Economy
Subscribe to get the latest posts sent to your email.
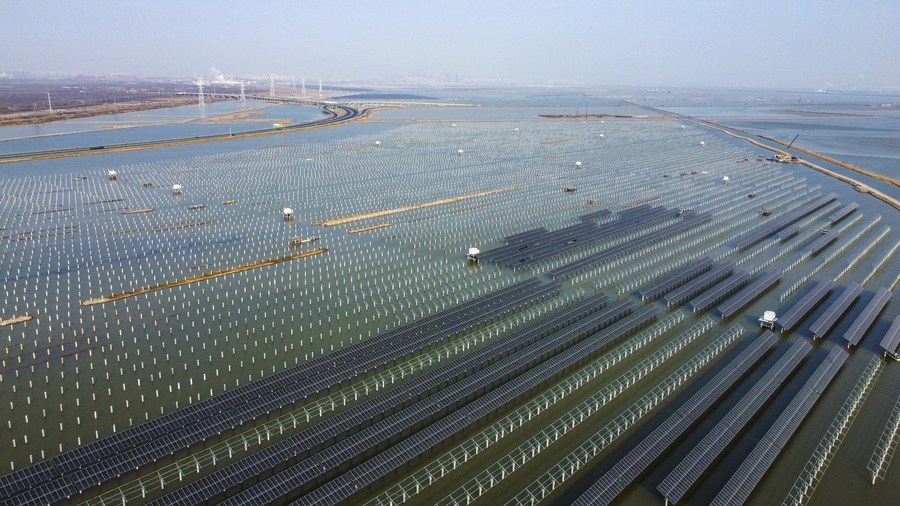
The smoke stacks of Tangshan and the heavy smelting pots of Yunnan are facing an unprecedented economic reckoning. By altering industrial electricity tariffs in China, Beijing has signaled that the era of cheap, coal-subsidised manufacturing is over. On June 15, 2026, policymakers enacted a stringent tiered pricing framework targeting the country’s heaviest polluters. This legislative shift transforms electricity from a cheap state utility into a sharp regulatory weapon designed to eliminate structural inefficiencies. The message from the central government is unambiguous: industrial survival now requires absolute carbon efficiency.
According to data compiled by the State Grid Energy Research Institute, China’s cumulative new energy installed capacity hit 1.84 billion kilowatts at the end of last year, capturing 47.3 percent of the nation’s total power capacity and officially overtaking coal. Yet, converting this massive generation capacity into real industrial reduction requires structural economic pain. The International Energy Agency reported that wholesale electricity prices for Chinese manufacturers remained roughly 50 percent lower than European Union levels throughout 2025. This deep price discrepancy insulated domestic heavy industries from the true cost of their carbon footprint, creating a massive hurdle for the state’s broader China green transition timeline. By realigning the pricing grid, central authorities aim to close this gap, forcing capital-intensive manufacturers to choose between rapid modernisation or financial insolvency.
The core mechanism of this policy transformation hinges on administrative price penalties overseen by the National Development and Reform Commission (NDRC). Under the new mandates, factories within energy-intensive sectors that fail to meet strict state-mandated efficiency thresholds face an immediate surcharge. The policy targets specific sectors including crude steel, aluminium, cement, and synthetic chemicals. These foundational industries historically consumed the lion’s share of provincial power grids while operating on razor-thin environmental margins.
The physical implementation of these pricing tiers is handled by provincial grid monopolies like the State Grid Corporation of China. Analysts at S&P Global note that this aligns with Notice 114, an administrative order passed in January 2026 to overhaul capacity tariffs across the domestic energy sector. The price adjustments are not uniform; they scale dynamically based on a factory’s verifiable emissions profile. Factories that transform their production lines will avoid the top-tier levies, while laggards will see their operational margins erased.
+-----------------------------------------------------------------------+
|                 NDRC TIERED ELECTRICITY TARIFF STRUCTURE              |
+-----------------------------------------------------------------------+
|  Tier 1: Advanced Green Facilities  --> Baseline Market Spot Pricing  |
|  Tier 2: Standard Compliant Plants  --> Standard Provincial Tariff     |
|  Tier 3: Non-Compliant / Inefficient --> Punitive Surcharge Added     |
+-----------------------------------------------------------------------+
To prevent regional protectionism, the central government has removed local discretion over pricing exemptions. Historically, provincial authorities offered illicit energy discounts to protect local employment and tax revenue. The NDRC report for 2026 clarifies that central inspectors will audit regional grid settlements directly. This ensures that the price signal remains uncompromised across provincial borders.
The timing of this intervention is deliberately synchronized with falling renewable generation costs. The Levelised Cost of Electricity (LCOE) for onshore wind power fell to as low as 0.142 yuan per kilowatt-hour last year. Photovoltaic power costs saw similar steep reductions, dropping to between 0.131 and 0.244 yuan per kWh. The government is utilizing these market dynamics to accelerate the retirement of obsolete, coal-dependent assets without destabilizing total industrial output.
This pricing shakeup marks a profound evolution in China’s long-running power market reform. For decades, the electricity sector operated under a rigid, two-track administrative pricing grid that guaranteed returns for coal generators while keeping costs flat for heavy factories. The introduction of Document No. 136 in February 2025 began breaking this dynamic by linking renewable energy to open market bidding. The latest tariff adjustments accelerate this shift, forcing heavy manufacturers to absorb the cost volatility of an evolving grid.
How China’s differential electricity pricing affects heavy industry
The imposition of differential rates shifts the competitive landscape from a game of scale to a game of efficiency. High-efficiency smelters are rewarded with access to cheaper, direct green power contracts. Conversely, low-efficiency operations are forced onto the punitive spot market, where peak-trough spreads can exceed 1.0 yuan per kilowatt-hour on volatile days. This economic friction functions as an automated market-clearing mechanism.
What are the penalty rates for inefficient factories under the new NDRC policy?
Under the latest National Development and Reform Commission directives, inefficient factories face a power price surcharge capped at 0.1 yuan (1.4 US cents) per kilowatt-hour. This tiered penalty targets facilities failing to meet national energy-efficiency benchmarks, forcing rapid technical upgrades across heavy industrial sectors.
The state is effectively weaponising the price mechanism to resolve its renewable energy curtailment crisis. Ye Xiaoning, a senior engineer at the State Grid Energy Research Institute, points out that while wind and solar generation expanded by 25 percent last year, regional grids frequently lacked the financial incentives to distribute this clean power efficiently. By charging a premium for carbon-intensive baseload electricity, Beijing forces industrial consumers to seek out direct corporate procurement agreements for green power.
This structural shift transforms how factories calculate their long-term capital expenditure. Rather than viewing electricity as a fixed, predictable utility cost, corporate treasurers must now treat it as a dynamic variable. Industrial operations must adjust their production schedules to align with peak renewable generation hours when spot prices fall. Those unable to build such operational flexibility face structural unprofitability as traditional baseload power costs climb.
The downstream ripples of these elevated industrial electricity tariffs in China will distort global industrial supply chains. For sectors like primary aluminium, where electricity accounts for up to 40 percent of total production costs, the NDRC surcharge represents an existential threat to margin sustainability. Global buyers will likely face higher export prices for Chinese metals as domestic producers pass these regulatory penalties down the value chain. This cost push inflation could speed up the relocation of energy-intensive manufacturing away from the Chinese mainland to regions with cheaper, unregulated power mixes.
Still, the internal pressure on small and medium-sized enterprises (SMEs) will be far more acute than the impact on state-owned giants. Large state-owned enterprises possess the capital reserves necessary to finance multi-million yuan equipment retrofits or construct dedicated solar arrays. In contrast, private SMEs operate on razor-thin margins and lack the credit access needed to upgrade legacy infrastructure. This regulatory divergence will trigger an aggressive wave of market consolidation across the industrial heartland.
       [ Punitive Grid Tariffs Imposed ]
                      │
         ┌────────────┴────────────┐
         ▼                         ▼
  [ Private SMEs ]          [ State Giants ]
  • Credit constrained      • Deep capital reserves
  • Legacy infrastructure   • Access to green PPA contracts
         │                         │
         ▼                         ▼
[ Market Exit / M&A ]     [ Supply Chain Dominance ]
Beyond domestic borders, this policy directly addresses the gathering storm of international green protectionism. The Center for Strategic and International Studies (CSIS) notes that the European Union’s Carbon Border Adjustment Mechanism (CBAM) entered a critical enforcement phase in early 2026, penalising imports with high embedded emissions. By raising domestic power prices for polluters, Beijing ensures that carbon rents are collected by the Chinese treasury rather than paid out as tariffs at European ports.
The long-term consequence will be an accelerated deployment of industrial energy storage systems. To avoid the peak penalty rates, factories are investing heavily in stand-alone Battery Energy Storage Systems (BESS). S&P Global expects this trend to drive over 1 trillion yuan in grid-edge infrastructure investments over the next five years. Industrial sites are mutating into microgrids capable of arbitrage, drawing power during midday solar surpluses and running on battery reserves during evening tariff spikes.
The picture is more complicated when viewed through the lens of local economic stability and energy security. Critics of rapid tariff adjustments argue that penalising energy-intensive sectors during a delicate macroeconomic recovery risks exacerbating industrial unemployment. A policy paper from the China Academy of Macroeconomic Research warns that sudden price shocks in foundational materials like cement and steel can cause cascading financial distress for the already fragile real estate and infrastructure sectors. Can the broader economy absorb these cost increases without stoking systemic producer price inflation?
Furthermore, there is a persistent risk that these targeted price increases could inadvertently compromise grid reliability. When heavy industries face punitive tariffs on coal-fired electricity, they may curtail operations abruptly, causing severe demand shocks that disrupt grid stability. If factories opt to invest heavily in self-propelled diesel generation to bypass grid tracking, the net environmental benefit of the policy vanishes. This creates a highly complex balancing act for regional regulators who must police off-grid compliance.
The National Energy Administration (NEA) has pushed back against these concerns, arguing that market-driven demand flexibility is the only viable path to hit decarbonisation targets. Government planners maintain that temporary economic friction is a necessary price to pay for long-term supply chain security. By forcing heavy industry to decarbonise at the source, China protects its export engine from future international trade sanctions.
The recalibration of industrial electricity tariffs in China represents a definitive break from the volume-driven growth model of the past quarter-century. Beijing is making an explicit trade-off, prioritizing long-term ecological compliance and structural market efficiency over short-run manufacturing margins. It is a high-stakes bet that the nation’s dominant clean energy supply chain can absorb the economic friction of this transition without fracturing industrial stability. The success of this policy depends on whether heavy industry can adapt its factories faster than the rising cost of power destroys their competitive edge.
The true cost of the green transition is finally being written into the ledger of global trade.
Discover more from The Economy
Subscribe to get the latest posts sent to your email.
The docks at Long Beach are once again a barometer for a shifting global order. Where efficiency and just-in-time delivery once dictated the movement of goods, geopolitical strategy has taken the helm. Washington and Beijing are locked in a structural struggle that has moved past simple disputes over trade deficits into the harder territory of technological supremacy and industrial autonomy. Companies that spent decades optimizing for a frictionless world are now frantically remapping their dependencies. The era of hyper-globalization isn’t ending, but it is undergoing a profound, expensive, and chaotic renovation.
Global trade remains remarkably resilient, yet the underlying plumbing is being systematically re-engineered. According to the International Monetary Fund, trade fragmentation could cost the global economy up to 7% of GDP in a worst-case scenario. That figure isn’t merely a theoretical warning; it’s a reflection of the billions of dollars being redirected as firms hedge against the widening US-China trade war. Last year, World Bank data showed a distinct trend: while trade volume remains high, the composition of that trade is increasingly regionalized. Nations are choosing proximity over price, and security over speed.
The Logic of Industrial Sovereignty
The core development driving this shift is the transition from “free trade” to “secure trade.” The US-China trade war has evolved from an attempt to balance ledger sheets into a blunt instrument of national security. Policymakers in Washington have realized that reliance on a strategic rival for critical inputs—ranging from active pharmaceutical ingredients to gallium and germanium—creates an unacceptable vulnerability. Consequently, the focus has shifted toward supply chain reshoring. This isn’t just about moving factories back home; it’s about rebuilding the industrial base necessary to sustain a modern economy under duress.
In June 2026, the legislative push behind this is clearer than ever. The Department of Commerce has accelerated oversight on dual-use technology exports, effectively creating a “walled garden” around the semiconductor ecosystem. This creates a cascade effect. As tariffs climb, manufacturers aren’t just shifting production to Vietnam or Mexico; they are investing in advanced robotics to make domestic production cost-competitive despite higher labor costs. The Bureau of Economic Analysis reports a sustained surge in private investment for manufacturing structures, a clear indicator that the corporate sector has internalized the permanence of these trade barriers. When you cannot predict the tariff environment three years out, the only safe bet is to build closer to the end consumer.
Analytical Layer: Beyond the Tariff
The economic consequences of these tariffs are often misunderstood as purely inflationary, yet the reality is more granular. When a tariff is applied, the initial shock is indeed felt by the importer, but the long-term impact is a distortion of capital allocation. Markets are signaling that efficiency is no longer the primary KPI. Instead, companies are prioritizing “resilience,” a term that effectively translates to higher operational costs in exchange for lower systemic risk.
What are the economic consequences of US tariffs on China? The primary effect is the forced diversification of manufacturing hubs. By imposing high-tariff barriers, the US incentivizes firms to relocate production, leading to a “China Plus One” strategy. This raises costs for consumers in the short term, but provides the US economy with a buffer against supply chain shocks originating from the Asia-Pacific region.
This transformation requires a fundamental rethink of corporate strategy. Firms that once viewed geography as a logistics concern now view it as a political liability. The Federal Reserve has noted that firms are holding higher inventory levels—a move away from the lean manufacturing models that dominated the 2010s. This “just-in-case” inventory strategy, combined with the costs of building new facilities, acts as a structural weight on margins. Yet, for many boards, this is a price worth paying to avoid the existential threat of being caught on the wrong side of a future export ban.
Implications & Second-Order Effects
The downstream consequences of this shift are creating a “two-track” global economy. We are seeing the rise of parallel supply chains: one anchored in the US and its allies, and another focused on Chinese industrial integration. This bifurcation risks locking out innovation from global markets. When technologies can’t cross borders, the speed of development slows.
The OECD has warned that persistent trade friction reduces productivity growth, as firms spend more time managing regulatory compliance than innovating. Furthermore, we are witnessing a scramble for raw materials that are essential for the energy transition. As China limits the export of rare earth metals, the US is forced to subsidize domestic processing—an expensive, environmentally complex, and slow endeavor. The second-order effect here is a massive increase in public-private partnership activity, where the government effectively underwrites the risk of industrial expansion. This signals a return to a 1950s-style dirigisme, where the boundary between the state and the private sector is increasingly porous.
A Dissenting View: The Efficiency Mandate
Not all analysts agree that this pivot is sustainable. Critics, including many voices at the Peterson Institute for International Economics, argue that protectionism creates a “self-inflicted wound.” By forcing production home, the US risks becoming an island of high-cost, inefficient manufacturing. The argument here is that the global economy is too deeply entangled for a clean break. Any attempt to fully excise Chinese components from the US tech stack will result in a decade of suppressed growth and diminished competitiveness.
Even those who advocate for domestic capability admit that the timeline for “reshoring” is optimistic. Building a fabrication plant takes years of planning and permitting. During that lag, the US remains vulnerable. Steel-manning the opposition reveals a valid concern: if the cost of shielding the economy from China is a permanent 2% to 3% increase in consumer prices, the social friction could become as dangerous as the geopolitical risk. The trade-off is not between security and danger, but between two different types of risk: the risk of external dependence versus the risk of internal economic stagnation.
The tension between the desire for national security and the reality of global economic integration will define the next decade of fiscal policy. We are watching the messy, expensive divorce of two economies that once believed they could coexist through commerce. The new order won’t be defined by the elimination of trade, but by the tightening of its terms. As the machinery of the global economy is slowly disassembled and rebuilt along securitized lines, the companies that succeed will be those that view every border as a potential barrier and every supply chain as a matter of statecraft. The world has traded the seamlessness of the digital age for the friction of the industrial one. It is a transition that guarantees neither safety nor prosperity, only a relentless and costly pursuit of both.
Discover more from The Economy
Subscribe to get the latest posts sent to your email.

Goldman Sachs: “The Circulatory System Is Not Working”

Why the U.S. Budget Airline Model Is Running Out of Runway

China’s Oil Shock Absorber: How Beijing Kept Crude Prices Half of What Analysts Predicted

CRH Nears Biggest-Ever Deal to Acquire Arcosa

U.S. Inflation at a Three-Year High: How the Iran War Turned an Economic Recovery Into a Stagflation Risk

IPO Summer 2026: Anthropic, OpenAI, and the Race to Price Artificial Intelligence on Public Markets

Strait of Hormuz Crisis 2026: How a Waterway War Broke Global Oil Markets

Kevin Warsh’s Fed Debut: Rate Hikes Now on the Table as U.S. Monetary Policy Enters a New Era

SpaceX IPO 2026: Inside the $85.7 Billion Listing That Made Elon Musk the World’s First Trillionaire

PSX KSE-100 Up 500+ Points: The Geopolitical Impact on Stocks

Did Anthropic Talk Its Way Into an AI Export Ban?

Big Bonuses for South Korea’s Chip Workers Put Central Bank on Inflation Alert

Easing Iran Tensions Push Mortgage Rates Lower — But a Potential Fed Hike Clouds the Outlook

Paramount’s $111 Billion Warner Bros. Discovery Merger Clears DOJ, But Faces New Hurdles

China Overhauls the World’s Biggest Surveillance Network with Advanced AI

SpaceX IPO: Inside the $2 Trillion Market Debut

KPMG Australia CEO Resigns After Whistleblower Claims Exposed Investigation Failures

PwC China Partner Payouts Cut Amid Evergrande Audit Fraud

Broadcom Market Value Loss: Revenue Forecast Disappoints

The Guardrails Are Down: How Meta and Google’s AI Models Fold Under Pressure

Pakistan Budget FY 2026-27: Relief, Prospects, and the Tightrope Walk

Benefitbay Raises $18M to Build the Plumbing for America’s ICHRA Shift

Nasdaq Tumbles 4% as Chip and Memory Stocks Sink: A $1.2 Trillion Wipeout

Here’s How Much It’ll Cost You to Be Part of SpaceX’s Record-Breaking $75 Billion IPO

Japanese Mid-Sized Firms Flock to Southeast Asia for Growth

Singapore Puts a Clock on Wealth: MAS Orders Banks to Halve Account-Opening Times

Can Exxon Build the World’s Biggest Carbon Capture Business?

The Ferrari Luce Is Finally Here — and It’s Already Dividing the Room
-

 Markets & Finance6 months ago
Top 15 Stocks for Investment in 2026 in PSX: Your Complete Guide to Pakistan’s Best Investment Opportunities
-

 Analysis4 months ago
Top 10 Stocks for Investment in PSX for Quick Returns in 2026
-

 Analysis5 months ago
Brazil’s Rare Earth Race: US, EU, and China Compete for Critical Minerals as Tensions Rise
-

 Analysis4 months ago
Johor’s Investment Boom: The Hidden Costs Behind Malaysia’s Most Ambitious Economic Surge
-

 Banks5 months ago
Best Investments in Pakistan 2026: Top 10 Low-Price Shares and Long-Term Picks for the PSX
-

 Investment5 months ago
Top 10 Mutual Fund Managers in Pakistan for Investment in 2026: A Comprehensive Guide for Optimal Returns
-

 Global Economy6 months ago
15 Most Lucrative Sectors for Investment in Pakistan: A 2025 Data-Driven Analysis
-

 Global Economy6 months ago
Pakistan’s Export Goldmine: 10 Game-Changing Markets Where Pakistani Businesses Are Winning Big in 2025