
Analysis
Trade or Surrender? Congress Lambasts US-India Deal as Path to ‘American Colony’ Amid Tariff Cuts

In a dramatic announcement that has electrified India’s political landscape, Prime Minister Narendra Modi and US President Donald Trump unveiled what they’re calling a landmark US-India trade deal 2026 on February 1st. Modi took to X (formerly Twitter) to hail the agreement as a “historic milestone” that would deepen bilateral ties and unlock unprecedented economic opportunities. Yet within hours, the Congress criticism US India deal erupted into a political firestorm, with opposition leaders branding the arrangement a capitulation that threatens to transform India into an “American colony.”
The controversy centers on what remains unsaid as much as what’s been revealed. While the Trump Modi trade agreement details promise substantial tariff reductions and increased trade flows, the devil—as opposition voices insist—lurks in the strategic concessions that may fundamentally alter India’s foreign policy autonomy.
The Deal’s Contours: Tariff Cuts and Trade Commitments
According to multiple authoritative sources including Reuters and Bloomberg, the agreement centers on reciprocal tariff reductions that could reshape bilateral commerce. The India US tariffs reduction impact appears substantial on paper: India has committed to slashing tariffs on select American goods from approximately 50% to 18%—a reduction that Washington has long demanded.
In exchange, Trump administration officials have indicated willingness to reduce certain tariffs on Indian exports, particularly in sectors where India holds competitive advantages. The Council on Foreign Relations notes that this represents a significant shift from Trump’s previous stance, where he famously called India the “tariff king.”
Key provisions reportedly include:
Sector-Specific Tariff Impacts:
| Sector | Current Tariff (India) | Proposed Tariff | Potential Impact |
|---|---|---|---|
| IT Services | Variable (15-25%) | 10-12% | Enhanced market access for Indian tech firms |
| Pharmaceuticals | 10-30% | 8-15% | Increased generic drug exports to US |
| Textiles | 20-35% | 12-18% | Competitive pressure on domestic manufacturers |
| Agricultural Products | 30-60% | 18-25% | Flood concerns for Indian farmers |
| Defense Equipment | 0-10% (US to India) | Further reductions | Deeper defense integration |
While proponents argue these reductions will boost Indian exports—particularly in pharmaceuticals and IT services, where India commands global market share—critics point to asymmetric vulnerabilities in agriculture and manufacturing.
Opposition’s Fury: “Economic Surrender” or Strategic Pragmatism?
The Congress criticism US India deal has been withering and unrelenting. Rahul Gandhi, Congress’s most prominent voice, attacked the agreement as “Modi’s complete surrender to American interests,” drawing parallels to colonial-era treaties that subordinated Indian interests to British commercial demands.
“This isn’t a trade deal—it’s a charter for American economic colonization,” Gandhi declared at a press conference, highlighting what he termed “secret clauses” that remain undisclosed. Congress spokesperson Jairam Ramesh elaborated on what the opposition views as the deal’s most troubling aspects:
The Russian Oil Dilemma: Perhaps the most explosive allegation centers on reports that India stops Russian oil US deal provisions may be embedded in side agreements. According to The Hindu, unofficial briefings suggest India has committed to “significantly reducing” its purchases of discounted Russian crude—purchases that have saved the Indian economy billions of dollars since the Ukraine conflict began.
India ramped up Russian oil imports from virtually zero to over 1.8 million barrels per day following Western sanctions on Moscow. This discounted oil—purchased at $20-30 below market rates—has been crucial in managing inflation and maintaining India’s current account balance. Opposition economists estimate that reverting to market-rate purchases from Middle Eastern or American suppliers could cost India an additional $15-20 billion annually.
The $500 Billion Question: Trump has publicly claimed India will purchase “$500 billion worth of American goods” over the deal’s timeframe, though specific timelines remain unclear. Hindustan Times reports that Indian officials have neither confirmed nor denied this figure, fueling speculation about what commitments Modi’s government actually made.
Critics note that India’s total imports from the US in 2024 stood at approximately $42 billion. Reaching $500 billion would require either a dramatic expansion of the timeline or transformative shifts in procurement—particularly in defense, energy, and technology sectors.
Strategic Autonomy Under Pressure?
Beyond immediate economic calculations, opposition voices frame the deal as eroding India’s cherished strategic autonomy—the decades-old policy of maintaining independent foreign policy choices regardless of great power pressures.
Former Foreign Secretary Shyam Saran articulated these concerns in recent commentary, noting that trade agreements increasingly serve as vehicles for broader geopolitical alignment. “When trade deals involve commitments on third-party relations—such as oil purchases from Russia—they cease to be purely commercial arrangements,” he observed.
The timing is particularly sensitive. India has walked a diplomatic tightrope on Ukraine, refusing to condemn Russia explicitly while maintaining robust defense and energy ties with Moscow. This position has frustrated Washington but allowed India to preserve relationships across the geopolitical spectrum. Critics worry the new trade framework forecloses this flexibility.
Comparisons to the recent US-Pakistan ceasefire have also surfaced in political discourse. Congress leaders argue that Trump is simultaneously rewarding Pakistan with diplomatic engagement while extracting strategic concessions from India—a “double game” that leaves New Delhi with obligations but uncertain benefits.
Economic Benefits: Real or Oversold?
Government defenders counter that opposition criticisms ignore substantial economic opportunities. The Confederation of Indian Industry (CII) has welcomed the agreement, particularly provisions that may ease market access for Indian IT services, pharmaceuticals, and textiles.
IT and Digital Services: With tariff and regulatory barriers reduced, Indian IT companies—which already dominate global outsourcing—could expand their US footprint. Industry estimates suggest potential revenue gains of $15-20 billion over five years.
Pharmaceutical Exports: India supplies nearly 40% of generic drugs to the US market. Streamlined regulatory approvals and tariff reductions could accelerate this further, though concerns about intellectual property requirements persist.
Manufacturing and “Make in India”: Here the picture muddies considerably. While reduced tariffs on intermediate goods could boost India’s manufacturing competitiveness, flooding Indian markets with American agricultural products and finished goods could undermine domestic industries still developing under protectionist frameworks.
Agricultural economists warn that dairy farmers, pulse growers, and certain fruit producers could face devastating competition from heavily subsidized American agribusiness. The politically crucial farm sector—already volatile after years of protest—could become even more unstable.
What We Still Don’t Know: The Transparency Deficit
Remarkably, for an agreement touted as “historic,” critical details remain undisclosed. As Council on Foreign Relations analysts note, the absence of published text—even in summary form—is highly unusual for trade agreements of this magnitude.
Unanswered Questions Include:
- Implementation timeline: When do tariff reductions actually take effect?
- Sectoral exclusions: Which industries are protected or exempt?
- Dispute resolution: What mechanisms exist for resolving trade conflicts?
- Labor and environmental standards: Are there enforceable provisions?
- Investment protections: What rights do American companies gain in Indian markets?
- Pharmaceutical IP requirements: Does India face tighter intellectual property enforcement that could limit generic drug production?
This opacity fuels opposition charges of US India trade surrender concerns, with critics arguing that transparency itself has been sacrificed for optics.
Global Context: Trump’s Transactional Trade Strategy
Understanding the deal requires situating it within Trump’s broader trade approach. Unlike traditional multilateral frameworks, Trump favors bilateral deals that maximize American leverage and deliver tangible, measurable outcomes—preferably ones he can tout politically.
For India, this creates both opportunity and risk. Trump’s willingness to negotiate suggests flexibility that multilateral forums rarely offer. Yet his transactional style also means agreements can be renegotiated or abandoned if political winds shift. The volatility that characterized his first term—when he threatened India with retaliatory tariffs multiple times—hasn’t disappeared.
Bloomberg’s trade analysts note that Trump views India primarily through three lenses: a massive consumer market for American goods, a counterweight to China, and a source of skilled immigration he wants to restrict. The challenge for Indian negotiators is extracting maximum benefit from the first two while managing the third.
Opposition’s Alternative Vision: What Would Congress Do Differently?
Critics bear responsibility for articulating alternatives, not just opposition. Congress leaders have sketched—albeit vaguely—what they would prioritize differently:
- Maintain Russian energy ties while diversifying suppliers to avoid overdependence
- Negotiate tariff reductions sector-by-sector rather than broad cuts that expose vulnerable industries
- Demand reciprocal commitments on H-1B visas and immigration restrictions
- Prioritize regional trade agreements (particularly reviving enthusiasm for Regional Comprehensive Economic Partnership participation)
- Insist on published texts before parliamentary ratification
Whether these alternatives constitute a coherent counter-strategy or political positioning remains debatable.
Looking Ahead: Parliamentary Battles and Economic Reality
As the deal moves toward potential parliamentary consideration, political warfare will intensify. The opposition, though numerically weaker, will use the debate to question the government’s competence and independence. Regional parties—particularly those representing agricultural states—will face pressure to oppose provisions threatening farmers.
Yet economic gravity may ultimately matter more than political rhetoric. If the agreement genuinely accelerates growth, creates jobs, and expands exports, public opinion may shift regardless of opposition framing. Conversely, if tariff reductions devastate specific sectors or strategic concessions prove costly, vindication will flow to critics.
The US-India trade deal 2026 represents more than commerce—it’s a referendum on India’s evolving global posture. Whether it marks a new chapter of prosperity or an erosion of hard-won strategic independence may not be clear for years. What is certain is that in democratic India, every clause and concession will be fiercely, noisily debated.
Discover more from The Economy
Subscribe to get the latest posts sent to your email.


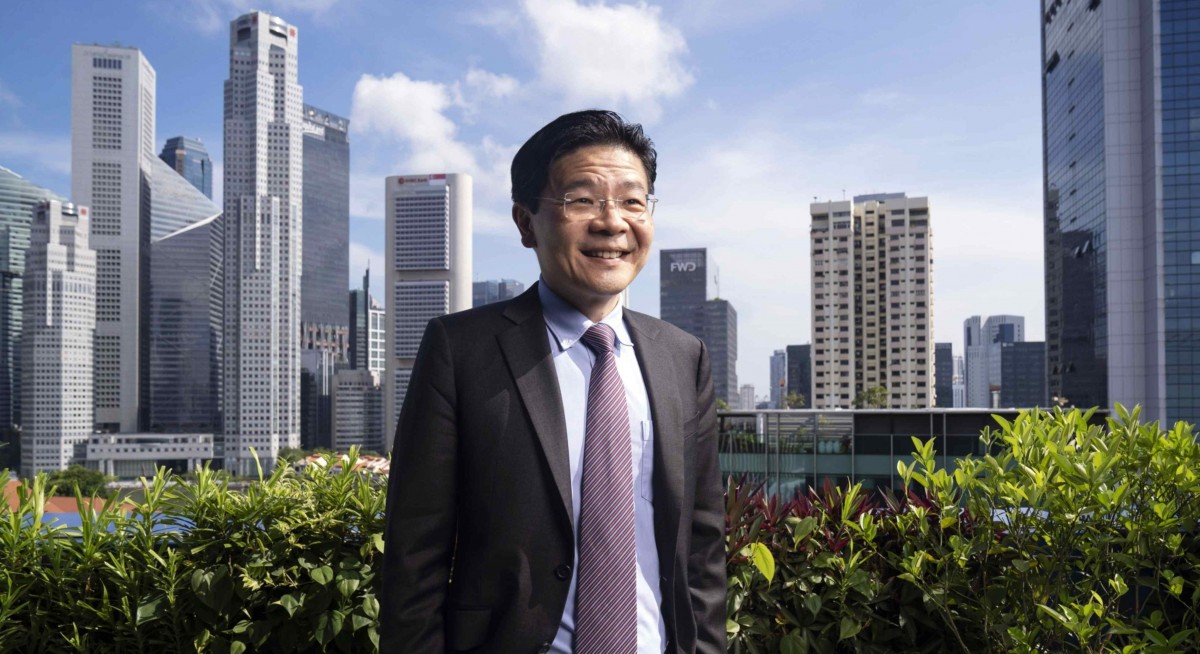
The city-state’s leader heads to “Asian Davos” as US-China rivalry reshapes every calculation in the Indo-Pacific
Every March, the small coastal town of Boao in China’s Hainan Province briefly becomes one of the most important rooms in the world. Finance ministers adjust their ties. Corporate chiefs rehearse their talking points. And the leaders who show up — and what they say — signal something real about where the world’s centre of economic gravity is heading.
This week, Singapore Prime Minister Lawrence Wong will be one of those leaders. Departing on March 25 for a four-day visit, Wong will deliver the keynote address at the Opening Plenary of the 2026 Boao Forum for Asia Annual Conference in Hainan, before travelling to Hong Kong to meet Chief Executive John Lee Ka-chiu and engage the city’s business community. Mothership.SG The itinerary is compact but dense with consequence — a carefully composed diplomatic score played in two movements.
The Stage: “Asian Davos” at 25
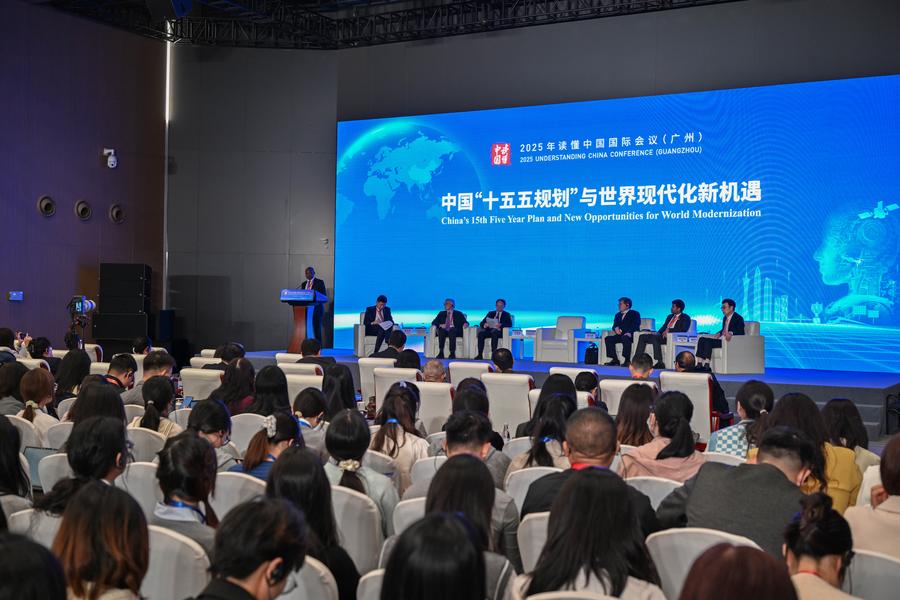
The Boao Forum for Asia is not merely China’s answer to Davos. It has become, over 25 years, an increasingly explicit instrument for shaping, not just discussing, Asia’s economic architecture People’s Daily — a forum where China translates its domestic policy ambitions for an international audience. This year, that function is sharper than ever.
The 2026 edition opens less than two weeks after China’s National People’s Congress formally adopted the 15th Five-Year Plan (2026–2030) People’s Daily, a document that will govern Chinese economic life for the rest of the decade. The forum’s theme — “Shaping a Shared Future: New Dynamics, New Opportunities, New Cooperation” — reflects both the profound transformations and growing uncertainties facing the world People’s Daily, with sessions spanning AI governance, green industrial policy, RCEP integration, and cross-border payment systems. Around 2,000 delegates from more than 60 countries and regions are attending, along with over 1,100 journalists People’s Daily.
There is an additional layer of meaning to this year’s venue. On December 18, 2025, Hainan launched island-wide special customs operations, formally becoming the world’s largest free trade port by area. People’s Daily For Singapore — itself a small, trade-dependent city-state whose prosperity is inseparable from the free movement of goods, capital, and ideas — the symbolism of delivering the keynote at that particular forum, on that particular island, in this particular geopolitical moment, is not accidental.
The Itinerary: Bilateral Depth Beyond the Podium
Wong’s Hainan programme extends well beyond the plenary stage. His agenda includes a welcome dinner hosted by the Hainan provincial government and the forum’s secretariat, as well as bilateral meetings with Zhao Leji, Chairman of the Standing Committee of the National People’s Congress, and Feng Fei, the Party Secretary of Hainan Province. The Standard
The meeting with Zhao Leji carries particular weight. As the third-ranking member of China’s Politburo Standing Committee, Zhao is not a figurehead. His portfolio includes legislative oversight and, crucially, inter-parliamentary diplomacy — a channel through which Beijing increasingly manages relationships with states it considers strategic partners rather than transactional counterparts. A bilateral with Zhao, rather than a junior minister, signals that Singapore retains a privileged lane of access in Beijing’s diplomatic hierarchy.
Following his Hainan engagements, Wong will travel to Hong Kong, where he is scheduled to meet Chief Executive John Lee Ka-chiu at Government House over a lunch hosted by Lee. South China Morning Post Wong will also visit key sites in the Northern Metropolis to gain a better understanding of Hong Kong’s economic and development trajectory and explore new opportunities for collaboration between the two cities, South China Morning Post according to Singapore’s Prime Minister’s Office.
The Strategic Context: Hedging as High Art
To understand what Wong is doing in Boao, it helps to understand what he was doing the week before. On March 17-18, Wong completed his first official visit to Japan as prime minister, during which Singapore and Japan announced an upgrade of their bilateral ties to a Strategic Partnership The Online Citizen, deepening cooperation across trade, defence, and emerging technologies.
Wong was direct about the sequencing. China, he noted, was aware of his visit to Japan and had continued to invite him to the Boao Forum in Hainan. The Online Citizen He framed Singapore’s approach with characteristic clarity: “Having good relations with one does not come at the expense of another. We can be friends with both China and Japan and America, for that matter. We want to maintain as many good friends as possible.” The Online Citizen
This is not naivety. It is a sophisticated hedging strategy that Singapore has refined over decades and that Wong is now codifying into a kind of doctrine. The city-state, which sits at the confluence of the world’s busiest shipping lanes and whose Chinese-majority population gives Beijing a perpetual interest in how it is governed, has long understood that its prosperity depends on never being forced to choose sides. In 2026, with US tariffs reshaping global supply chains, a growing string of leaders from developed economies visiting China South China Morning Post, and Washington signalling its own engagement (the White House announced that President Trump would travel to Beijing from March 31 to April 2), that doctrine is being stress-tested in real time.
Wong’s Boao appearance — coming immediately after the Japan Strategic Partnership and immediately before Trump’s China visit — positions Singapore precisely where it has always sought to be: visible, valued, and indispensable to every major player in the room.
The Hong Kong Dimension: More Than a Courtesy Call
The second leg of the trip deserves equal analytical attention. Singapore and Hong Kong occupy a peculiar relationship — they are simultaneously Asia’s two most globally integrated city-states, natural partners in financial services and logistics, and quiet rivals for the same pools of regional capital and talent.
Wong’s planned tour of Hong Kong’s Northern Metropolis is telling. The Northern Metropolis is Hong Kong’s most ambitious development project in a generation — a planned urban corridor stretching from the urban core to the Shenzhen border, envisioned as a technology and innovation hub, a logistics gateway, and a new residential district capable of accommodating 900,000 people. It is, in effect, Hong Kong’s answer to the question of how a city re-engineers its economic model after years of political disruption and capital flight. For a Singapore PM to visit and explicitly explore “new opportunities for collaboration” is a recognition that Hong Kong, under John Lee’s administration, is in the business of rebuilding — and that Singapore sees more to gain from partnership than from competition.
The business community meetings add another layer. Wong’s most recent trip to China was in June 2025, when he met President Xi Jinping and Premier Li Qiang and attended Summer Davos in Tianjin. South China Morning Post That visit was primarily Beijing-facing. This one brackets mainland engagement with substantive Hong Kong outreach — a signal to the private sector in both cities that Singapore views the Hong Kong-Singapore axis as a durable feature of the regional financial architecture, not a casualty of geopolitical anxiety.
The Bigger Picture: Multilateralism Under Pressure
At the BFA New Year Outlook 2026 event, forum chairman and former UN Secretary-General Ban Ki-moon warned that the world is becoming “more divided, more dangerous and less predictable.” CGTN It is against that backdrop that the Boao Forum’s 25th anniversary carries its particular urgency.
The Hainan Free Trade Port, with its island-wide independent customs operations advancing steadily, is emerging as a new gateway for international investment and cooperation. CGTN Sessions on the Regional Comprehensive Economic Partnership, Asia-Pacific integration, and cross-border payment systems reflect a shared determination to build regional “shock absorbers.” People’s Daily For Singapore, whose entire economic model is built on the assumption that rules-based, open trade systems will endure, these are not abstract debates. They are existential questions.
Wong’s keynote address is likely to thread several needles simultaneously: affirm Singapore’s commitment to multilateralism and ASEAN centrality; acknowledge China’s role as Asia’s indispensable economic engine without appearing supplicant; and signal to Western partners watching from afar that engagement is not endorsement. It is a speech that will be read not just in Beijing and Washington but in Jakarta, Kuala Lumpur, and New Delhi — capitals that watch Singapore’s diplomatic moves with the attention of students studying a master class.
Forward Outlook: What This Visit Signals for 2026 and Beyond
Three forward-looking observations bear emphasis.
First, the pace of Wong’s diplomatic engagements — Japan in March, Boao immediately after, and likely a succession of bilateral meetings through the APEC cycle — suggests that Singapore is deliberately front-loading its relationship capital in 2026, a year when US-China dynamics could shift dramatically in either direction depending on the trajectory of trade negotiations and Taiwan flashpoints.
Second, the Northern Metropolis visit hints at a potential deepening of Singapore-Hong Kong cooperation in specific sectors — fintech, green finance, and supply chain digitisation being the most obvious candidates — that would benefit from institutional frameworks rather than ad-hoc deal-making. Watch for announcements from the business community meetings.
Third, and most consequentially, Wong’s ability to be warmly received in Tokyo one week and keynote Boao the next, without apparent diplomatic friction from either capital, validates a model of middle-power statecraft that other ASEAN economies are quietly studying. In a world where the pressure to align is intensifying, Singapore’s demonstrated capacity to remain credibly engaged with all sides without being captured by any of them is, perhaps, its most valuable export.
In the end, the journey from Boao to Hong Kong in four days is less a travel itinerary than a statement of intent: that Singapore’s bet on an interconnected, cooperative Asia is not a relic of a more innocent era, but an active wager — one that Lawrence Wong is placing in real time, on the most watched diplomatic stages in the region.
The spring breeze moves across Boao every March. This year, what it carries is worth listening to carefully.
Discover more from The Economy
Subscribe to get the latest posts sent to your email.
Analysis
China’s 15th Five-Year Plan: Inside the Tech Masterplan Reshaping the World Economy by 2030
China’s 15th Five-Year Plan (2026–2030) maps a breathtaking tech transformation — humanoid robots, fusion power, 6G brain interfaces, and 109 mega-projects. Here’s what it means for the world.
On the morning of March 12, as delegates filtered out of Beijing’s Great Hall of the People clutching their customary red volumes, the world’s most consequential economic document had just been made official. China’s 15th Five-Year Plan — a 141-page blueprint covering 2026 to 2030 — was formally adopted by the National People’s Congress with the kind of bureaucratic solemnity that belies its radical ambition. The headlines, as usual, fixated on the GDP growth target of 4.5–5 percent, the lowest since China began publishing five-year plans in earnest, and moved on.
That was a mistake.
Strip away the deadening officialese — the ritual invocations of “new quality productive forces,” the calls for “industrial upgrading,” the exhortations toward “high-quality development” — and what emerges is something far more remarkable. China’s 15th FYP is effectively a state-sponsored moonshot program on a civilizational scale: skies dotted with delivery drones and flying taxis; hydrogen and fusion power plants supplying electricity to factories run by humanoid robots; quantum computers crunching problems that would take today’s machines the lifetime of the universe; 6G networks ultimately wired into human cognition itself. The document reads less like a communist planning instrument and more like the collected fever dreams of Silicon Valley’s most ambitious technologists — except it is backed by the full industrial and financial muscle of the world’s second-largest economy, and it has a deadline.
China’s New Quality Productive Forces: What the Jargon Actually Means
The phrase “new quality productive forces” (新质生产力) has been Xi Jinping’s preferred economic shorthand since 2023. In the 15th FYP, it becomes load-bearing architecture. The term translates, in practical terms, to a decisive pivot away from the debt-fuelled, steel-and-concrete model that powered China’s growth for three decades, and toward an economy built on frontier technology, high-value manufacturing, and innovation-led productivity gains.
According to the plan’s formal outline, China’s emerging pillar industries — spanning new-generation information technology, intelligent connected vehicles, advanced robotics, biomedicine, aerospace, and new materials — are expected to break the 10-trillion-yuan benchmark by 2030. Frontier technologies, meanwhile, are projected to generate an entirely new high-tech sector over the following decade. The government has also committed to increasing nationwide research and development spending by at least 7 percent annually — a pace that, if sustained, would push China’s total R&D expenditure to levels rivalling the United States by the early 2030s.
The sequencing matters. Where the 14th Five-Year Plan (2021–2025) led with technological innovation, the 15th plan places a modernized industrial system first. As the World Economic Forum observed, this reflects a hard-won practical lesson: turning laboratory breakthroughs into scalable, high-value production capacity is the true bottleneck, and Beijing intends to close it. This is less about acceleration and more about reengineering the vehicle itself.
The Embodied Intelligence Revolution: 150 Firms, One Trillion Yuan, and a Procurement Directive
Of all the plan’s technological targets, none is more striking — or more consequential for global manufacturing — than its treatment of humanoid robots and embodied artificial intelligence (具身智能). The term barely appeared in Chinese policy documents before 2023. In the 15th FYP, it commands its own dedicated inset box among the plan’s ten most prioritised “new industry tracks,” alongside integrated circuits, biomanufacturing, and commercial space.
The Diplomat’s primary-source analysis of the plan’s Box 3, Item 02 reveals language that is not aspirational but operational: China will “coordinate the layout of embodied intelligence training grounds, promote virtual-real fusion collaborative training and evolution, develop integrated big-brain/small-brain embodied models and algorithms, tackle key technologies in the body and core components, and accelerate the upgrade and deployment of humanoid robots.” That is a procurement directive, not a wish list.
The industrial reality underpinning this ambition is already formidable. In 2024, China installed 295,000 industrial robots — 54 percent of the global total — with an operational stock surpassing 2 million units. In the nascent humanoid segment, Chinese firms shipped roughly 90 percent of the world’s units in 2025, led by AgiBot (5,168 units), Unitree (over 4,200 units), and UBTech. More than 150 humanoid robot companies now operate in China. The government has committed a 1-trillion-yuan ($138 billion) state-backed fund to advancing humanoid robots, industrial automation, and embodied AI — a sum that dwarfs any comparable Western initiative.
The parallel with Elon Musk’s Optimus project is unavoidable. But where Tesla’s humanoid program represents a single company’s bet, China’s approach is a whole-of-nation mobilisation. The plan’s Chapter 13 establishes an “AI+” action plan as a cross-cutting national program covering six domains: science and technology, industrial development, consumer upgrades, social welfare, governance, and national security. Artificial intelligence appears more than 50 times in the 141-page document. The strategy is not to build the world’s best AI model — that remains, for now, a largely American contest — but to weave AI into the physical fabric of the economy more deeply and more quickly than any country has ever attempted.
The Low-Altitude Economy: When Drones Become Infrastructure
China’s “low-altitude economy” — a formal policy designation covering commercial drones, urban air mobility, flying taxis, and low-altitude logistics networks — is one of the 15th FYP’s most distinctive concepts, and one that has received insufficient attention in Western coverage.
The plan designates the low-altitude economy as a strategic emerging industry cluster. Multiple provincial governments, from Zhejiang to Inner Mongolia, have already allocated dedicated funding and industrial parks. The underlying logic is compelling: China’s vast geography, its already-dominant position in commercial drone manufacturing (EHang, XPeng AeroHT, and dozens of smaller firms), and its regulatory willingness to deploy technologies at scale give it structural advantages that Western regulators — still debating urban air traffic management frameworks — cannot easily replicate.
By 2030, Beijing envisages a multi-tier airspace management system capable of supporting millions of autonomous drone flights daily, encompassing last-mile delivery, agricultural monitoring, emergency services, and inter-city passenger transport. The economic prize is substantial. Chinese analysts estimate the low-altitude economy could generate 1.5 trillion yuan in annual output by the end of this decade.
Fusion, Hydrogen, and the Energy Backbone of a Tech Superpower
A technology economy of this ambition requires an equally ambitious energy supply. The 15th FYP earmarks hydrogen power and controlled nuclear fusion as “next-generation” energy technologies — a designation that reflects both strategic calculation and genuine scientific progress.
China’s ITER-adjacent fusion program and its Experimental Advanced Superconducting Tokamak (EAST) have already set world records for plasma duration. The 15th FYP provides the policy and financial framework to translate laboratory milestones toward commercial application. The plan’s 109 major engineering projects include dedicated energy infrastructure initiatives — offshore wind farms, coastal nuclear plants, and new power transmission corridors — designed to underpin the electricity demands of an AI-intensive economy.
The hydrogen dimension is particularly significant. Green hydrogen — produced via electrolysis powered by renewables — sits at the intersection of China’s clean energy surplus and its industrial decarbonisation agenda. The IDDRI notes that China’s solar manufacturing capacity now exceeds domestic consumption by a factor of three. That overcapacity is not merely a problem; it is a strategic asset, enabling green hydrogen costs to fall faster in China than anywhere else on earth.
Quantum, 6G, and the Brain-Computer Frontier
The 15th FYP’s most futuristic provisions — quantum computing, 6G communications, and brain-computer interfaces — are where its ambition most visibly strains against physical and ethical reality.
On quantum computing, Chinese research teams achieved significant milestones in photonic quantum computing and superconducting circuits during the 14th FYP period. The 15th FYP commits extraordinary-measures language — comparable, analysts note, to wartime mobilisation — to accelerating breakthroughs. The geopolitical stakes are profound: a functional cryptographically-relevant quantum computer would render most current encryption infrastructure obsolete overnight.
The plan’s 6G ambitions build on China’s commanding position in 5G standardisation. The plan explicitly targets 6G for development during the 2026–2030 period, with the ambition of integrating ultra-high-bandwidth wireless networks into medical devices, industrial systems, and — in the plan’s most provocative passage — brain-computer interfaces. The latter technology, already being developed by domestic firms alongside Neuralink-style devices, appears in the plan as a formal “future industry” alongside quantum technology and biomanufacturing. Its inclusion is not merely techno-utopian signalling. The Chatham House analysis notes that Beijing has elevated these frontier fields to the centre of its economic agenda, with fundamental breakthroughs treated as matters of national strategic priority.
The Semiconductor Pivot: Washington Hasn’t Noticed
One of the most analytically significant aspects of the 15th FYP has received almost no coverage in Western media. China has quietly abandoned the semiconductor self-sufficiency target established under Made in China 2025 — which called for 70 percent domestic chip production and which China missed by roughly 50 percentage points — and replaced it with a deployment metric: digital economy value-added at 12.5 percent of GDP by 2030, up from 10.5 percent in 2025.
The Diplomat’s forensic analysis of the 141-page plan document is striking in this regard: the word for “lithography machine” does not appear once. Neither do “wafer fab,” “extreme ultraviolet,” or “chip manufacturing.” What appears instead is a new strategic vocabulary. Artificial intelligence outnumbers references to integrated circuits by roughly 13 to 1. A new planning term has entered Five-Year Plan history for the first time: 模芯云用 — “model-chip-cloud-application” — encoding a full-stack deployment architecture.
This is not a retreat. The plan calls for “extraordinary measures” on advanced chip fabrication and continues to pursue domestic semiconductor production. But the strategic emphasis has shifted: from how many chips China produces to how deeply computing infrastructure penetrates the economy. The Biden-era export controls targeted the fabrication layer. China has restructured around the other three layers — models, cloud, and applications — where no equivalent countermeasures exist. Whether this represents genuine strategic evolution or an adaptation to inevitable constraints matters less than the operational reality: the infrastructure is being built, domestically and across the developing world via Belt and Road digital initiatives.
The Risks Beijing Isn’t Advertising
No premium analysis of China’s 15th FYP would be complete without confronting the formidable execution risks that the document — by design — underplays.
Overcapacity and involution. The plan acknowledges in unusually strong language the problem of destructive overcompetition — “involution” — in sectors from solar panels to electric vehicles. But enforcement remains politically fraught in an economy where most heavy industry is state-owned and local governments depend on factory employment for social stability. The IDDRI notes that China’s solar manufacturing capacity exceeds domestic consumption by a factor of three. The rest of the world should brace for continued waves of cost-competitive Chinese clean-technology exports.
The demographic constraint. A technology-heavy growth model is a rational response to a shrinking, ageing workforce. But it also demands a quality of human capital — software engineers, AI researchers, quantum physicists — that China is producing in enormous numbers, though not yet at the leading edge of all disciplines. The plan targets over 22 high-value invention patents per 10,000 people by 2030, up from 12 in the 14th FYP. Whether the quality matches the quantity remains an open question.
US export controls and the software gap. Even Beijing’s own technology industry acknowledges that software — operating systems, EDA tools, advanced compilers — remains the most vulnerable layer in China’s technology stack. The Diplomat’s analysis identifies this as the one constraint that US policy has targeted least effectively, and the one China finds hardest to domestically substitute. DeepSeek’s emergence at the start of 2026 demonstrated extraordinary ingenuity in working around hardware constraints, but the gap in frontier software tooling persists.
Energy demand and climate contradiction. An economy built on AI data centres, quantum computing, and electrified manufacturing will consume energy on a transformational scale. The plan’s GDP growth target of 4.5–5 percent, combined with a carbon intensity reduction target of only 17 percent by 2030, draws concern from climate analysts who note that China is likely to fall short of its Paris-aligned emissions commitments. The gap between Beijing’s green-technology leadership and its actual decarbonisation trajectory remains wide.
What This Means for the World
The 15th Five-Year Plan is not, as some Western commentators reflexively characterise it, merely another expression of authoritarian state capitalism paper-planning its way to an imagined future. Nor is it the unambiguous geopolitical threat that hawkish analysts in Washington and Brussels portray. It is something more complex and, in many ways, more consequential: the most coherent large-scale attempt by any government in history to engineer an economy’s transition from extensive to intensive growth through deliberate technological transformation.
For global supply chains, the implications are already unfolding. China installed more industrial robots in 2024 than the rest of the world combined. Its solar and wind manufacturing has structurally reduced the cost of renewable energy globally. Its AI deployment strategy — integrating models into factory floors, logistics networks, and healthcare systems — is generating productivity gains that are difficult to measure but impossible to ignore.
For the United States and Europe, the competitive challenge is genuine but not straightforwardly zero-sum. As Chatham House observes, Beijing has signalled that technological self-reliance and economic resilience are long-term strategic choices, not temporary responses to external pressure. The West’s instinct to restrict, contain, and decouple will shape Beijing’s incentives at the margins but will not fundamentally alter the trajectory of a plan backed by the savings of 1.4 billion people and the organisational capacity of a Leninist state that has repeatedly demonstrated its ability to execute at industrial scale.
For developing economies, China’s ambition may prove most immediately impactful. The plan explicitly targets the Global South as a market for Chinese computing infrastructure, clean technology, and eventually the fruits of the low-altitude economy. A proposed World AI Cooperation Organization and Belt and Road AI platform signal Beijing’s intent to make itself the technology partner of choice for countries locked out of the Silicon Valley ecosystem.
The deeper question — which no five-year plan can answer — is whether a system built on party control, information restriction, and the suppression of the kind of disruptive, bottom-up innovation that produced the internet, the smartphone, and now large language models can truly lead at the frontier. China’s own technology history offers a mixed verdict. It has been exceptional at scaling and deploying technologies invented elsewhere. It produced DeepSeek. It has not yet produced an iPhone.
By 2030, we will know considerably more. What is certain, today, is that the document adopted in Beijing’s Great Hall on March 12 deserves to be read — not in the deadening prose of its officialese, but in plain language, for what it is: the most ambitious attempt in human history to build a technology economy from the top down. Whether it succeeds or stumbles, it will reshape the world either way.
Discover more from The Economy
Subscribe to get the latest posts sent to your email.
A landmark 2026 study reveals eroding trust, sovereignty anxieties, and a bloc struggling to justify its existence to the very peoples it claims to serve.
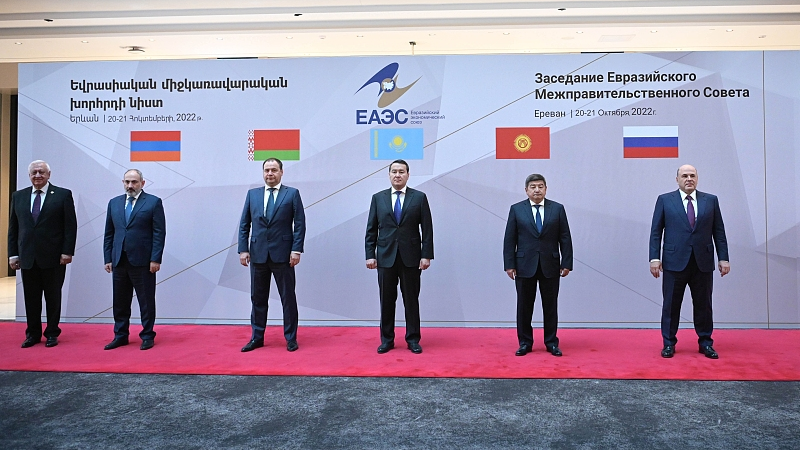
When Nursultan Nazarbayev first sketched the outlines of a Eurasian economic union in the early 1990s, he imagined something elegant: a voluntary commonwealth of post-Soviet nations, bound not by Moscow’s imperial gravity but by rational self-interest, shared infrastructure, and frictionless trade. Three decades later, the Eurasian Economic Union (EAEU) he helped conjure into existence marks its tenth anniversary as a functioning institution—complete with a common customs tariff, a nominal single labor market, and $20 billion in cumulative intra-bloc investment. On paper, those are real achievements. On the streets of Bishkek, Yerevan, and Almaty, the mood is something else entirely.
New research published in February 2026 in Eurasian Geography and Economics by Dr. Zhanibek Arynov of Nazarbayev University and his co-author Diyas Takenov offers the most systematic public-perception audit of the EAEU to date—drawing on focus groups and survey data across all three smaller member states. The findings are striking, occasionally counterintuitive, and should unsettle anyone who believes that post-Soviet integration can survive on institutional inertia and official enthusiasm alone. Across Armenia, Kazakhstan, and Kyrgyzstan, positive perceptions of the EAEU are in measurable decline. Economic grievances have deepened. Sovereignty anxieties have sharpened, supercharged by Russia’s full-scale invasion of Ukraine. And in one of the study’s most surprising findings, it is Kazakhstan—the EAEU’s co-founder and most economically capable member—that harbors the strongest sentiment in favor of eventual withdrawal.
The Ten-Year Ledger: What the Numbers Say
The Eurasian Economic Commission’s own data tells a story of institutional progress that would be impressive if viewed in isolation. Over the past decade, the EAEU’s combined GDP has grown by nearly 18%, industrial production has risen by 29%, and cumulative intra-union foreign direct investment has reached $20 billion. Intra-bloc trade has climbed steadily, and the union now boasts free trade agreements with Singapore, Vietnam, Serbia, and—as of 2023—Iran, with negotiations ongoing with India and Egypt.
Yet the EAEU’s own registry of internal market obstacles tells a different story. As of the bloc’s tenth anniversary, the organization still officially lists one barrier, 35 limitations, and 33 exemptions to the supposed free flow of goods, capital, and labor—figures that represent not a success story but a confession. A truly integrated common market doesn’t require a bureaucratic catalogue of its own failures.
The Carnegie Endowment for International Peace and Chatham House have both documented this structural paradox: the EAEU’s institutional architecture is more developed than its predecessor organizations, yet its member states have shown persistent reluctance to transfer genuine sovereignty to supranational bodies. The EAEU Court in Minsk, for instance, cannot initiate cases or issue preliminary rulings the way the European Court of Justice can—a design feature that reflects, rather than corrects, the political will of its members.
It is within this gap between rhetoric and reality that Arynov and Takenov have done their most important work.
Kazakhstan: The Founder’s Doubt
No country’s EAEU story is more psychologically complex than Kazakhstan’s. This was the nation whose founding president claimed intellectual paternity of the entire project, whose government remained, as Arynov noted in a February 2025 commentary for the Italian Institute for International Political Studies (ISPI), “strongly enthusiastic” about the union even as public sentiment shifted beneath its feet.
And shift it has. The trajectory of Kazakhstani public opinion on the EAEU is a cautionary tale about what geopolitical trauma can do to an integration project’s legitimacy. In 2015, surveys recorded roughly 80% approval among Kazakhstanis for the bloc. By 2017, that figure had dipped slightly. Today, based on the Arynov-Takenov focus group research, scepticism has become the dominant public sentiment—and it operates on two distinct registers.
The first is geopolitical. Russia’s 2022 invasion of Ukraine shattered whatever pretense remained that the EAEU was a purely economic organization, insulated from Moscow’s military and political ambitions. Kazakhstani focus group participants repeatedly cited Russian politicians’ inflammatory rhetoric questioning Kazakhstan’s territorial integrity—a visceral and deeply personal grievance in a country that shares a 7,500-kilometer border with Russia and has a substantial ethnic Russian minority. Many now view membership in the EAEU not as a source of economic opportunity but as a vector for geopolitical exposure: a mechanism through which secondary sanctions risk could spill over from Russia’s pariah status onto Kazakhstani businesses and banks. Kazakhstan’s own government has walked an extraordinary tightrope since 2022, publicly refusing to endorse Russia’s war, providing humanitarian assistance to Ukraine, and accelerating economic diversification—all while remaining formally embedded in Moscow’s preferred institutional architecture.
The second register is economic. Focus group participants in Kazakhstan cited the EAEU’s failure to deliver on its core promises: persistent non-tariff barriers, asymmetric market access that has benefited Russia far more than smaller members, and the absence of meaningful sectoral coordination. Kazakhstan’s industrial base—the most diversified among the smaller EAEU members—has expanded its exports within the union, but critics argue the terms of trade systematically favor the bloc’s hegemon.
What makes the Arynov-Takenov finding genuinely surprising is its comparative dimension. Despite Kazakhstan’s historical ownership of the Eurasian project, its public registers more intense withdrawal sentiment than Armenia—a country that has spent the past three years openly pursuing European Union membership and freezing its participation in the parallel CSTO security organization. The researchers interpret this counterintuitive result as a product of Kazakhstan’s relative economic confidence: a country with more options feels more emboldened to contemplate exit.
Armenia: The Ambivalent Western Pivot
If Kazakhstan’s EAEU skepticism is rooted in geopolitical anxiety, Armenia’s is shaped by an identity crisis that predates 2022. Yerevan joined the EAEU in 2015 not out of Eurasian conviction but under what most analysts describe as coercive Russian pressure—President Serzh Sargsyan reversed a near-completed EU Association Agreement in 2013 following a meeting with Vladimir Putin, a U-turn that Nikol Pashinyan—then an opposition parliamentarian—voted against.
That original reluctance has since hardened into something more structured. In March 2025, Armenia’s parliament passed the EU Integration Act with 64 votes in favor, formally enshrining the country’s aspiration for European membership in law. Prime Minister Pashinyan has since stated publicly that simultaneous membership in the EU and EAEU is impossible, and that Armenia will eventually face a binary choice. Russian Deputy Prime Minister Alexei Overchuk was direct in his response: the EU accession process, he said, would mark the beginning of Armenia’s EAEU withdrawal.
Yet for all this diplomatic theatre, the Arynov-Takenov research reveals something more nuanced: Armenian public sentiment, while clearly disillusioned with the EAEU, stops short of demanding immediate exit. A 2023 survey found that only 40% of Armenians expressed inclination to trust the EAEU, while 47% said they did not—a notable trust deficit, but not an overwhelming mandate for departure. Armenia’s economic dependency on Russia remains a profound constraint: Moscow is Yerevan’s largest trading partner, accounting for over a third of total foreign trade, and Russia controls critical infrastructure sectors including electricity distribution and natural gas supply.
Arynov’s research frames this as the logic of vulnerability over principle: states with fewer economic alternatives tend to prefer reform of existing arrangements over the risk of exit. Armenia’s trade with Russia reached record highs in 2024—a perverse consequence of post-Ukraine sanctions, as Yerevan became a key re-export corridor for goods flowing toward the Russian market. Leaving the EAEU would mean not only sacrificing that trade volume but potentially triggering Russian economic retaliation at a moment when the peace process with Azerbaijan remains fragile and a formal EU candidacy is still years away. As one analyst writing for CIDOB assessed in 2025, the EU integration law was widely understood as a pre-election political gesture rather than an imminent foreign-policy reorientation.
The result is a population that has grown deeply ambivalent about the EAEU on normative grounds—viewing it as an instrument of Russian influence and a structural impediment to European integration—while pragmatically accepting that the exit costs may be prohibitive in the near term. Armenia, the research suggests, is a case study in EAEU skepticism without EAEU exit—a condition the bloc’s architects never anticipated and have no institutional mechanism to address.
Kyrgyzstan: When the Labor Market Promise Breaks Down
Kyrgyzstan’s relationship with the EAEU has always been the most transactional. When Bishkek joined in 2015, the primary draw was not abstract Eurasian solidarity but concrete economics: frictionless access to the Russian labor market, automatic recognition of professional qualifications, and the right to work in Russia without a permit or quota. For a country in which remittances have at times constituted over 30% of GDP, those were not minor benefits. They were the entire rationale.
A decade later, that rationale is in serious trouble. The Arynov-Takenov research documents a Kyrgyz public increasingly aware of the gap between what the EAEU’s common labor market promised and what it delivers. Since Russia’s full-scale invasion of Ukraine in 2022 and the Crocus City Hall terrorist attack in 2024—which prompted a massive anti-Central Asian backlash in Russian public discourse—Moscow has systematically tightened restrictions on migrant workers. More than 208,000 individuals were placed on Russia’s migration control lists. Tens of thousands of Kyrgyz nationals were blacklisted. New regulations require one-year employment contracts that create legal uncertainty and reduce the incentive for long-term labor migration.
In January 2026, the breach became institutional: Kyrgyzstan filed a formal lawsuit against Russia at the EAEU Court in Minsk, accusing Moscow of violating union treaty obligations by refusing to provide compulsory health insurance to the family members of Kyrgyz migrant workers—protections that the EAEU’s founding documents explicitly guarantee. That Bishkek chose to take the dispute to a supranational forum rather than quiet bilateral channels represents an unusual escalation for a country that has typically sought to manage its relationship with Russia with extreme discretion.
Border frictions add another layer of grievance. Kyrgyz exporters must cross into Kazakhstan to reach any other EAEU market—a structural vulnerability that leaves them subject to inconsistent technical inspections, shifting regulatory requirements, and effectively unilateral trade barriers. Despite EAEU membership, Kyrgyz traders report that the promised single market remains aspirational rather than operational.
Yet here, too, the research underscores the reform-over-exit logic. Remittances from Russia still constitute approximately 24% of Kyrgyz GDP—in the first five months of 2025, Russia accounted for 94% of all inward remittance flows. No realistic alternative labor market of that scale exists. The Kyrgyz public, the Arynov-Takenov data suggests, wants the EAEU to be fixed, not abandoned. Their grievances are pointed and specific: protect our migrants, remove border frictions, fulfill the promises of the common market. What they display is not Eurasian fatalism but consumer frustration with a product that has underdelivered—a distinction the bloc’s leadership would do well to internalize.
What a Legitimacy Deficit Looks Like
Taken together, the Arynov-Takenov findings paint a picture of an institution navigating a slow-burning legitimacy crisis across precisely the member states where popular consent matters most. Russia and Belarus, the EAEU’s two largest economies, are not meaningfully constrained by public opinion in the conventional sense. But Armenia, Kazakhstan, and Kyrgyzstan are—to varying degrees—responsive to domestic political sentiment, and that sentiment is turning.
The Brookings Institution and Foreign Affairs have both noted the structural tension at the heart of post-Soviet integration projects: they are designed to function as technical economic arrangements while carrying enormous geopolitical freight. The EAEU was never purely an economic organization—its conception was entangled from the outset with Russia’s strategic goal of maintaining a sphere of privileged influence in the former Soviet space. That entanglement, largely invisible to ordinary citizens during years of oil-fueled growth, has become glaringly apparent in the era of Ukraine sanctions, territorial rhetoric, and migration crackdowns.
The research by Arynov and Takenov—who has also examined the oscillating trajectory of Russia-Kazakhstan relations in Horizons: Journal of International Relations and Sustainable Development—fills a significant gap in what has been a state-centric and Russia-centric literature. By focusing on citizens rather than governments, focus groups rather than official communiqués, the study reveals the EAEU as its actual publics experience it: not as an elegant integration architecture but as a daily reality of border queues, disputed remittance rights, and sovereignty traded away for economic promises that have been only partially kept.
The Policy Horizon
What should policymakers take from this analysis? Three things stand out.
First, the distinction between exit sentiment and reform preference is politically significant—and fragile. In Kyrgyzstan and Armenia, publics currently prefer fixing the EAEU over leaving it. But that preference is conditional on the belief that improvement is possible. If Russia continues to restrict migrant workers while EAEU dispute mechanisms prove toothless, the reform constituency will erode and the exit constituency will grow.
Second, Kazakhstan is the swing state. Its combination of relative economic strength, intense post-Ukraine sovereignty anxieties, and stronger-than-expected withdrawal sentiment makes it the member most likely to redefine the bloc’s political trajectory over the next decade. President Tokayev has so far managed the balance skillfully—publicly distancing Kazakhstan from Russia’s war while remaining formally embedded in Moscow’s institutions. But that balance cannot be maintained indefinitely if Russian behavior continues to erode the bloc’s credibility with Kazakhstani citizens.
Third, the EAEU’s legitimacy problem cannot be solved by economic commissions alone. The organization publishes detailed technical reports, maintains an elaborate institutional structure, and generates impressive aggregate statistics. None of that addresses what Arynov and Takenov’s research identifies as the core public grievance: the perception that the EAEU is less a common market than a vehicle for Russian geopolitical interest, managed by a supranational body with insufficient autonomy to enforce its own rules against its dominant member.
Ten years after the Treaty came into force, the Eurasian Economic Union faces a choice it has never been designed to confront: whether it can reform itself substantively enough to rebuild public legitimacy in states that joined it for practical reasons and are now questioning whether those reasons still apply. The research of Arynov and Takenov does not answer that question. But it asks it with a clarity and precision that neither EAEU bureaucrats nor Kremlin strategists should be comfortable ignoring.
Discover more from The Economy
Subscribe to get the latest posts sent to your email.
-

 Markets & Finance3 months ago
Top 15 Stocks for Investment in 2026 in PSX: Your Complete Guide to Pakistan’s Best Investment Opportunities
-

 Analysis2 months ago
Brazil’s Rare Earth Race: US, EU, and China Compete for Critical Minerals as Tensions Rise
-

 Banks2 months ago
Best Investments in Pakistan 2026: Top 10 Low-Price Shares and Long-Term Picks for the PSX
-

 Investment2 months ago
Top 10 Mutual Fund Managers in Pakistan for Investment in 2026: A Comprehensive Guide for Optimal Returns
-

 Asia3 months ago
China’s 50% Domestic Equipment Rule: The Semiconductor Mandate Reshaping Global Tech
-

 Analysis1 month ago
Top 10 Stocks for Investment in PSX for Quick Returns in 2026
-

 Global Economy3 months ago
Pakistan’s Export Goldmine: 10 Game-Changing Markets Where Pakistani Businesses Are Winning Big in 2025
-

 Global Economy3 months ago
15 Most Lucrative Sectors for Investment in Pakistan: A 2025 Data-Driven Analysis