
Business
Top 5 Stock Picks on the Pakistan Stock Exchange for 2026: Expert Analysis and Investment Outlook

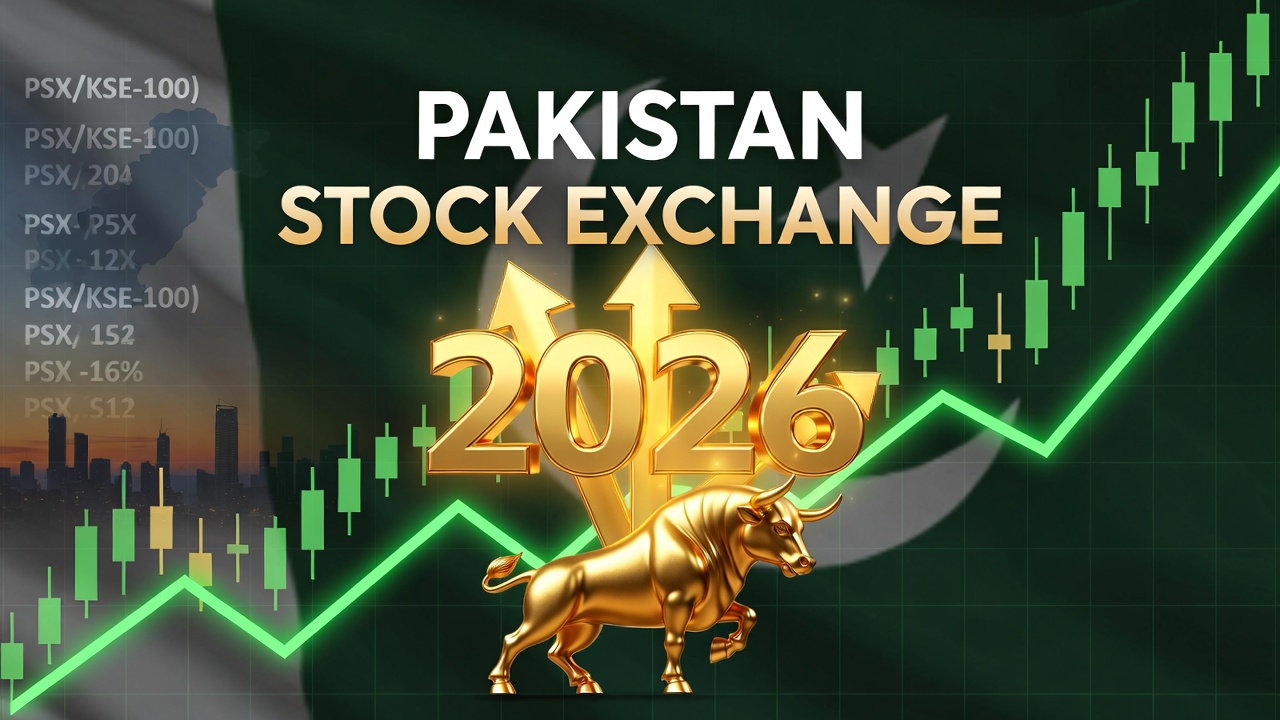
Explore the best PSX stocks 2026 with expert analysis of top Pakistan Stock Exchange investments. In-depth review of MEBL, FFC, LUCK, OGDC, and SYS with target prices and growth catalysts.
The Pakistan Stock Exchange has delivered one of the world’s most remarkable performances. As we move deeper into 2026, the KSE-100 index sits near record highs at approximately 188,000 points, reflecting a stunning 68% year-over-year gain. For investors seeking emerging market exposure with compelling risk-adjusted returns, Pakistan presents an increasingly attractive proposition—but only if you know where to look.
The question isn’t whether to invest in Pakistani equities. It’s which stocks offer the optimal combination of valuation discipline, earnings visibility, and sectoral tailwinds. After examining macroeconomic fundamentals, conducting comparative sector analysis, and consulting analyst consensus across leading brokerages, I’ve identified five stocks that warrant serious consideration for 2026 portfolios: Meezan Bank (MEBL), Fauji Fertilizer Company (FFC), Lucky Cement (LUCK), Oil & Gas Development Company (OGDC), and Systems Limited (SYS).
This isn’t about momentum chasing. These selections reflect a rigorous methodology that prioritizes sustainable competitive advantages, improving fundamentals, and reasonable entry points. But first, let’s understand why Pakistan’s equity market deserves your attention right now.

Pakistan’s 2026 Economic Renaissance: Building on Fragile Progress
Three years ago, Pakistan teetered on the brink of sovereign default. Currency reserves had dwindled to precarious levels, inflation exceeded 38%, and the rupee was in freefall. Fast forward to January 2026, and the transformation is striking. Inflation has moderated to 5.6% as of December 2025, while the State Bank of Pakistan has reduced its policy rate to 10.5%, the lowest level in three years.
The IMF projects Pakistan’s GDP growth at 3.2% for 2026, a figure that may appear modest by Asian standards but represents genuine momentum after years of near-stagnation. More importantly, the composition of growth has shifted. The manufacturing sector is rebounding from flood-induced disruptions, services remain resilient, and agricultural output is stabilizing. Foreign exchange reserves have climbed above $14.5 billion, providing a crucial buffer against external shocks.
What does this mean for equity investors? Lower interest rates typically compress bond yields, making equities more attractive on a relative basis. Stabilizing inflation allows companies to plan with greater confidence, improving capital allocation decisions. And critically, Pakistan’s improving macroeconomic stability is drawing foreign investors back after years of outflows, with potential MSCI Emerging Markets Index reclassification on the horizon.
Yet challenges persist. Political uncertainty remains elevated. Structural reforms—particularly in the bloated public sector and loss-making state enterprises—advance at a glacial pace. And external dependencies, especially on IMF support, create vulnerability to global financial conditions. Smart investors will balance optimism with prudence, recognizing that Pakistan’s story is one of recovery, not renaissance.
Methodology: How We Selected the Top 5 PSX Stocks for 2026
Investment selection is both art and science. Our approach combines quantitative screens with qualitative judgment, focusing on:
Financial Health: Consistent profitability, manageable leverage ratios, and robust cash flow generation over rolling three-year periods. Companies must demonstrate resilience through Pakistan’s recent economic turbulence.
Valuation Discipline: We prioritize stocks trading at reasonable multiples relative to historical norms and regional peers. No growth story, however compelling, justifies egregious valuations.
Sectoral Positioning: Industries benefiting from structural tailwinds—declining interest rates, agricultural focus, infrastructure development, digital transformation—receive preference.
Analyst Consensus: We reviewed recommendations from Arif Habib Limited, JS Global, Topline Securities, and international platforms like TradingView and MarketScreener, synthesizing diverse perspectives.
Market Liquidity: Stocks must maintain adequate daily trading volumes to ensure efficient entry and exit, particularly important in frontier markets.
Dividend Sustainability: In volatile markets, dividend yield provides downside cushion. We favor companies with track records of reliable payouts.
The result is a diversified basket spanning banking, fertilizers, cement, energy, and technology—sectors we believe will drive PSX performance through 2026 and beyond.
1. Meezan Bank (MEBL): Pakistan’s Islamic Banking Powerhouse

Current Price: PKR 484.56 (as of January 27, 2026)
52-Week Range: PKR 230.00 – 505.00
Market Cap: PKR 870 billion
Target Price (Consensus): PKR 560–617
Dividend Yield: ~6.5%
Why MEBL Leads Our List
Meezan Bank dominates Pakistan’s Islamic banking sector with an estimated 35% market share, making it the undisputed leader in Sharia-compliant financial services. This matters enormously in a country where Islamic banking assets have grown at double-digit rates for over a decade, supported by demographic preferences and regulatory encouragement.
The bank’s recent performance validates this positioning. In 2024, Meezan reported revenue of PKR 309.15 billion, up 27.44% year-over-year, while earnings reached PKR 102.69 billion. More impressively, return on equity (ROE) stands at 18%—exceptional for any bank, let alone in a frontier market—indicating efficient capital deployment.
The Interest Rate Tailwind
Pakistan’s monetary easing cycle represents a structural catalyst for banking profitability. As interest rates decline, banks benefit from several mechanisms simultaneously: compressed funding costs, wider net interest margins on floating-rate assets, and reduced credit costs as borrowers find repayment more manageable. For Meezan, with its substantial corporate and SME lending portfolio, this translates directly to bottom-line accretion.
Analyst consensus points to a 12-month target of PKR 560-617, implying 15-27% upside from current levels. Eight analysts covering the stock rate it a “Strong Buy,” with none recommending sells—a rare unanimity.
Risks to Consider
Like all Pakistani banks, Meezan faces asset quality concerns if economic recovery stalls. Non-performing loans, while currently manageable, could deteriorate if the IMF program encounters difficulties. Regulatory changes affecting Islamic banking structures, though unlikely, pose tail risks. And the stock’s remarkable run—up 100% year-over-year—means it’s no longer obviously cheap on traditional metrics, trading at approximately 9.6x trailing earnings.
Still, for investors seeking exposure to Pakistan’s financial sector transformation, Meezan offers the optimal combination of growth, profitability, and relative safety. The dividend yield provides income while you wait for capital appreciation.
2. Fauji Fertilizer Company (FFC): Agricultural Backbone With Energy Exposure

Current Price: PKR 598.60 (as of January 2, 2026)
52-Week Range: PKR 314.18 – 658.28
Market Cap: PKR 993 billion
Target Price (Consensus): PKR 615
Dividend Yield: ~7-8%
The Fertilizer Thesis for 2026
Pakistan’s agricultural sector, representing roughly 20% of GDP, is poised for renewed focus as the government prioritizes food security and export earnings. Fertilizer companies sit at the nexus of this imperative, and FFC—Pakistan’s second-largest urea producer—is exceptionally well-positioned.
The company’s integrated business model is its competitive moat. FFC doesn’t just manufacture fertilizer; it operates across the value chain, from gas-based production facilities to extensive distribution networks reaching thousands of agricultural retailers nationwide. This vertical integration provides margin stability even when raw material costs fluctuate.
Recent results underscore operational excellence. FFC reported EBITDA of PKR 134.75 billion with a 25.56% margin, impressive for a commodity producer. The company recently reached an all-time high of PKR 658.28 on January 23, 2026, reflecting strong market confidence.
Why Now?
Three catalysts converge for FFC in 2026:
Government Subsidy Clarity: Recent policy stability around fertilizer subsidies removes a major uncertainty that plagued the sector in previous years, allowing farmers to plan purchases with confidence.
Natural Gas Allocations: As Pakistan’s circular debt in the gas sector is gradually addressed, FFC benefits from more reliable feedstock supply. Arif Habib Limited’s Pakistan Strategy 2026 report specifically highlights FFC among beneficiaries of gas circular debt resolution.
International Urea Prices: Global fertilizer markets remain supportive, with Russia-Ukraine tensions and Chinese export restrictions keeping prices elevated on a historical basis.
Analyst consensus projects minimal upside to PKR 615, suggesting the stock is fairly valued at current levels. However, the generous dividend yield—FFC historically pays out 40-50% of earnings—makes it attractive for income-focused investors.
What Could Go Wrong?
FFC’s fortunes are tightly linked to natural gas availability and pricing—factors outside management control. Weather-related agricultural disruptions reduce fertilizer demand. And if the rupee strengthens significantly, import competition could intensify. Still, with Pakistan’s food import bill straining the trade balance, domestic agricultural productivity remains a national priority, benefiting the entire fertilizer value chain.
3. Lucky Cement (LUCK): Infrastructure Play With Regional Expansion

Current Price: PKR 482.99 (as of January 28, 2026)
52-Week Range: PKR 214.00 – 529.50
Market Cap: PKR 867 billion
Target Price (Consensus): PKR 530-580
Dividend Yield: ~1.1%
Cement: Pakistan’s Building Block
When governments prioritize infrastructure, cement companies print money. Pakistan’s infrastructure deficit is legendary—power distribution bottlenecks, inadequate road networks, insufficient housing stock—creating decades of latent demand. As fiscal space improves under the IMF program, infrastructure spending will accelerate, directly benefiting cement producers.
Lucky Cement, Pakistan’s largest cement manufacturer by capacity, operates state-of-the-art plants in both Pakistan and Iraq, with additional ventures in the Democratic Republic of Congo. This geographic diversification differentiates it from purely domestic players, providing natural currency hedges and access to faster-growing African markets.
The company reported revenue of PKR 449.63 billion in 2025, up 9.40%, with earnings growing 17.39% to PKR 76.96 billion. Net profit margins expanded despite raw material cost pressures—a testament to operational efficiency and pricing power.
Construction Boom Coming?
Pakistan’s housing shortage exceeds 10 million units by most estimates. The government’s Naya Pakistan Housing Programme, though progressing slowly, signals intent to address this crisis. Private sector construction is also awakening as mortgage availability improves and consumer confidence rebuilds.
For Lucky Cement, domestic demand revival combines with Iraqi reconstruction spending and African urbanization to create a multi-year growth runway. Analysts project upside to PKR 530-580, representing 10-20% appreciation potential.
Cyclicality Concerns
Cement is inherently cyclical, making timing crucial. Rising energy costs squeeze margins. The stock’s rally—up 123% year-over-year—has compressed valuations, with LUCK now trading at an elevated P/E ratio near 47. This suggests much good news is already priced in, leaving little margin for disappointment.
Low dividend yield (around 1%) also means capital appreciation must do the heavy lifting. But for investors with a 2-3 year horizon who believe Pakistan’s infrastructure story is just beginning, Lucky Cement offers asymmetric upside—if, and it’s a meaningful if, execution on Iraqi and African projects proceeds on schedule.
4. Oil & Gas Development Company (OGDC): Energy Independence Champion

Current Price: PKR 319.26 (as of January 29, 2026)
52-Week Range: PKR 242.00 – 331.80
Market Cap: PKR 1.42 trillion
Target Price: PKR 315-332
Dividend Yield: ~6.8%
Pakistan’s Largest E&P Company
Energy security ranks among Pakistan’s highest strategic priorities. The country imports approximately 75% of its oil and significant quantities of LNG, draining precious foreign exchange. OGDC, Pakistan’s largest exploration and production company, controls over 40% of awarded exploration acreage, making it the flagship of domestic energy development efforts.
The company’s portfolio spans mature producing fields and greenfield exploration prospects across Pakistan’s diverse geological basins. Recent discoveries, including significant finds in the TAL Block, demonstrate OGDC’s technical capabilities and reserve replacement potential.
Fiscal 2025 Challenges and 2026 Recovery
Fiscal 2025 proved challenging, with OGDC reporting subdued earnings due to lower crude oil and gas production volumes and softer realized prices. However, the company responded with a record dividend of PKR 15.05 per share—its highest ever—signaling management confidence in underlying cash generation capacity despite near-term headwinds.
Looking ahead, several catalysts should support OGDC’s rerating:
Gas Circular Debt Resolution: Arif Habib Limited’s 2026 strategy report identifies OGDC among primary beneficiaries of government efforts to tackle the PKR 3.2 trillion gas circular debt. If receivables are cleared through dividend clawbacks or petroleum levy arrangements, OGDC’s cash flows and balance sheet will strengthen dramatically.
Production Revival Projects: Planned capital expenditure targeting aging field rejuvenation and new well completions should arrest production declines that have plagued the sector.
Oil Price Sensitivity: Global crude benchmarks remain supported near $75-80/barrel, levels that ensure healthy economics for OGDC’s oil-weighted production mix.
State-Owned Enterprise Risks
Government ownership (approximately 88%) creates both stability and constraints. OGDC will never face existential solvency issues, but political interference in pricing, forced gas supply to loss-making utilities at below-market rates, and dividend decisions driven by fiscal needs rather than shareholder optimization remain ever-present concerns.
The stock’s recent run to all-time highs near PKR 331.80 in mid-January 2026 suggests investors are pricing in considerable optimism around circular debt resolution. At current levels, with minimal consensus upside, OGDC is more suited for dividend-focused investors than aggressive growth seekers. But as a defensive holding with government backing and essential sector positioning, it earns its place in a diversified PSX portfolio.
5. Systems Limited (SYS): Riding Pakistan’s Digital Transformation

Current Price: PKR 170.09 (as of January 29, 2026)
52-Week Range: PKR 145.00 – 190.00
Market Cap: PKR 243 billion
Target Price (Consensus): PKR 215
Dividend Yield: ~0.7%
The Technology Outlier
No Pakistani stock portfolio feels complete without exposure to the country’s burgeoning technology sector. Systems Limited, Pakistan’s premier IT services and business process outsourcing company, offers precisely that—a claim on digital transformation trends both domestically and globally.
Founded in 1977, Systems has evolved from a regional software vendor to a multinational corporation with operations across North America, the Middle East, Europe, Africa, and Asia-Pacific. The company provides digital consulting, data and AI services, cloud migration, cybersecurity solutions, and BPO services to telecommunications, banking, healthcare, retail, and government sectors.
In 2024, Systems reported revenue of PKR 67.47 billion, a robust 26.27% increase, demonstrating strong demand for its service offerings. The company’s recent acquisition of Confiz, a digital transformation consultancy, and strategic partnership with British American Tobacco expand addressable markets and deepen client relationships.
Growth Drivers for 2026
AI and Automation Demand: Every enterprise globally is rethinking technology infrastructure to incorporate artificial intelligence and automation. As a services integrator, Systems benefits as clients seek implementation expertise—a trend that transcends Pakistan’s economic cycles.
Nearshore/Offshore Arbitrage: Pakistan’s educated, English-speaking IT workforce offers compelling cost advantages versus Indian or Eastern European alternatives, particularly for clients in the Middle East and Africa where cultural affinity matters.
Domestic Digitalization: Pakistan’s government and private sector are digitalizing, from taxation systems to banking platforms. Systems, with established relationships across key sectors, is positioned to capture disproportionate share.
Currency Dynamics: A significant portion of Systems’ revenue is dollar-denominated exports. If the rupee depreciates, profit margins expand automatically.
Valuation and Volatility
Analyst consensus suggests a target price near PKR 215, implying roughly 26% upside—the highest among our five selections. Yet Systems trades at premium valuations befitting a growth stock, and the technology sector’s inherent volatility means drawdowns can be sharp.
The company’s low dividend yield (~0.7%) signals management preference for reinvestment over shareholder distributions. For investors comfortable with volatility and seeking pure growth exposure, Systems Limited offers the best risk-reward profile on this list. For those prioritizing income stability, it’s the weakest fit.
Comparative Analysis: Which Stock Fits Your Strategy?
| Stock | Ticker | Price (PKR) | P/E Ratio | Dividend Yield | 12M Target | Upside Potential | Risk Profile |
|---|---|---|---|---|---|---|---|
| Meezan Bank | MEBL | 484.56 | 9.6x | 6.5% | 560-617 | 15-27% | Moderate |
| Fauji Fertilizer | FFC | 598.60 | 13.2x | 7-8% | 615 | 2.5% | Low-Moderate |
| Lucky Cement | LUCK | 482.99 | 47.5x | 1.1% | 530-580 | 10-20% | Moderate-High |
| OGDC | OGDC | 319.26 | 8.2x | 6.8% | 315-332 | 0-4% | Low |
| Systems Limited | SYS | 170.09 | 25.2x | 0.7% | 215 | 26% | High |
For Income Investors: FFC and OGDC, with their 7-8% and 6.8% yields respectively, provide the most reliable dividend streams. Both companies have track records of consistent payouts even during Pakistan’s recent economic turbulence.
For Growth Investors: Systems Limited clearly leads, with double-digit revenue growth, expanding margins, and secular digitalization tailwinds. MEBL also offers compelling growth at more reasonable valuations.
For Value Investors: OGDC trades at just 8.2x earnings—remarkably cheap for a company with government backing and quasi-monopoly market position. However, the lack of near-term catalysts means value realization may take time.
For Balanced Investors: MEBL strikes the optimal balance—reasonable valuations, solid growth, meaningful dividend yield, and structural sector tailwinds. It’s the core holding I’d recommend for most portfolios.
For Risk Takers: Lucky Cement offers leverage to Pakistan’s infrastructure revival story, though current valuations leave minimal room for execution missteps.
Risks Every PSX Investor Must Understand
No investment thesis is complete without acknowledging what can go wrong. Pakistani equities, despite their remarkable recent performance, carry risks that justify their frontier market classification:
Political Instability: Pakistan’s political environment remains volatile. Policy reversals, civil unrest, or geopolitical tensions with neighboring countries can trigger sharp market corrections.
IMF Program Dependence: Pakistan’s economic stability hinges on continued IMF support. If program reviews encounter difficulties or conditions prove unpalatable domestically, renewed crisis could emerge.
Currency Volatility: While recent stability is welcome, the rupee’s history of sharp devaluations creates constant uncertainty. Foreign investors face currency risk; domestic investors may find dollar-denominated alternatives more attractive during periods of rupee weakness.
Liquidity Constraints: PSX daily trading volumes remain modest by regional standards. Large positions can be difficult to exit quickly without moving markets, particularly in small and mid-cap stocks.
Regulatory Unpredictability: Corporate governance standards, while improving, lag developed markets. Regulatory interventions—from dividend restrictions to price controls—can materialize with little warning.
Sector Concentration: Pakistan’s equity market remains heavily weighted toward financials, energy, and materials. True diversification requires looking beyond PSX.
These risks are real, material, and unlikely to dissipate entirely in the near term. They’re also precisely why expected returns are higher than in developed markets. Frontier market investing rewards those who can tolerate volatility and maintain discipline through inevitable drawdowns.
2026 Market Outlook: Tempering Enthusiasm With Realism
Arif Habib Limited projects the KSE-100 Index will reach 208,000 points by December 2026, implying 21.6% upside from late-December 2025 levels. Alternative forecasts from AKD Securities suggest even more aggressive targets near 263,800, predicting a 53% return and potentially lifting PSX market capitalization to $100 billion.
These projections rest on several key assumptions:
- Continued monetary easing as inflation remains anchored within the 5-7% target range
- Sustained reform momentum, particularly around privatization (PIA, power distribution companies) and energy sector restructuring
- Political stability through the critical 2026 midpoint
- Foreign investor return, potentially catalyzed by MSCI Emerging Markets Index reclassification
- Benign external environment, with no major shocks from oil prices, U.S. interest rates, or geopolitical conflicts
History counsels humility. Markets rarely move in straight lines. Pakistan’s KSE-100 Index has delivered 15-20% annualized returns over extended periods, but with 30-40% drawdowns occurring periodically. Even in a favorable scenario, expect volatility.
My base case suggests PSX can deliver 15-20% total returns in 2026—double-digit appreciation plus dividend income—provided the fragile macroeconomic stability holds. The bull case, if MSCI upgrade materializes and foreign flows accelerate, could see returns approaching 30-35%. The bear case, triggered by IMF program failure or political crisis, would see flat to negative returns.
Position sizing matters enormously. For international investors, PSX exposure should represent a small portion of overall equity allocation—perhaps 3-5% maximum. For domestic Pakistani investors with rupee liabilities, a larger allocation (20-30%) makes sense, but diversification across sectors remains critical.
Pakistan’s Moment—But Not Without Caveats
Pakistan stands at an inflection point. Years of crisis management are giving way to cautious optimism. Bloomberg noted that Pakistan’s stock rally and surging retail participation are drawing companies back to equity markets, with up to 16 IPOs expected in 2026—the most in years. This is the environment where disciplined investors can generate asymmetric returns.
The five stocks profiled here—Meezan Bank, Fauji Fertilizer, Lucky Cement, OGDC, and Systems Limited—offer diverse exposures to Pakistan’s recovery narrative. Collectively, they provide a balanced portfolio spanning financials, industrials, and technology. Individually, each presents distinct risk-return profiles suitable for different investor objectives.
But make no mistake: investing in Pakistani equities remains a calculated risk. Frontier markets don’t become developed markets overnight. Progress is rarely linear. Setbacks will occur. The key is separating signal from noise, maintaining conviction during inevitable periods of doubt, and remembering that extraordinary returns require accepting extraordinary uncertainty.
For those willing to embrace that uncertainty with eyes wide open, Pakistan’s equity market in 2026 offers opportunities that have become increasingly rare in an expensive, fully-priced global marketplace. The question isn’t whether risks exist—they always do. The question is whether potential rewards justify those risks. For the stocks discussed here, I believe they do.
As with any investment, conduct your own due diligence. Consult with qualified financial advisors familiar with your specific circumstances. And never invest capital you can’t afford to lose. Frontier markets reward the prepared, patient, and prudent—not the reckless.
Disclaimer:
This article is for informational purposes only and does not constitute investment advice, a recommendation, or a solicitation to buy or sell any securities. Past performance is not indicative of future results. Readers should conduct their own research and consult with licensed financial advisors before making investment decisions. The author and publisher assume no liability for any losses incurred from reliance on the information presented herein.
Discover more from The Economy
Subscribe to get the latest posts sent to your email.


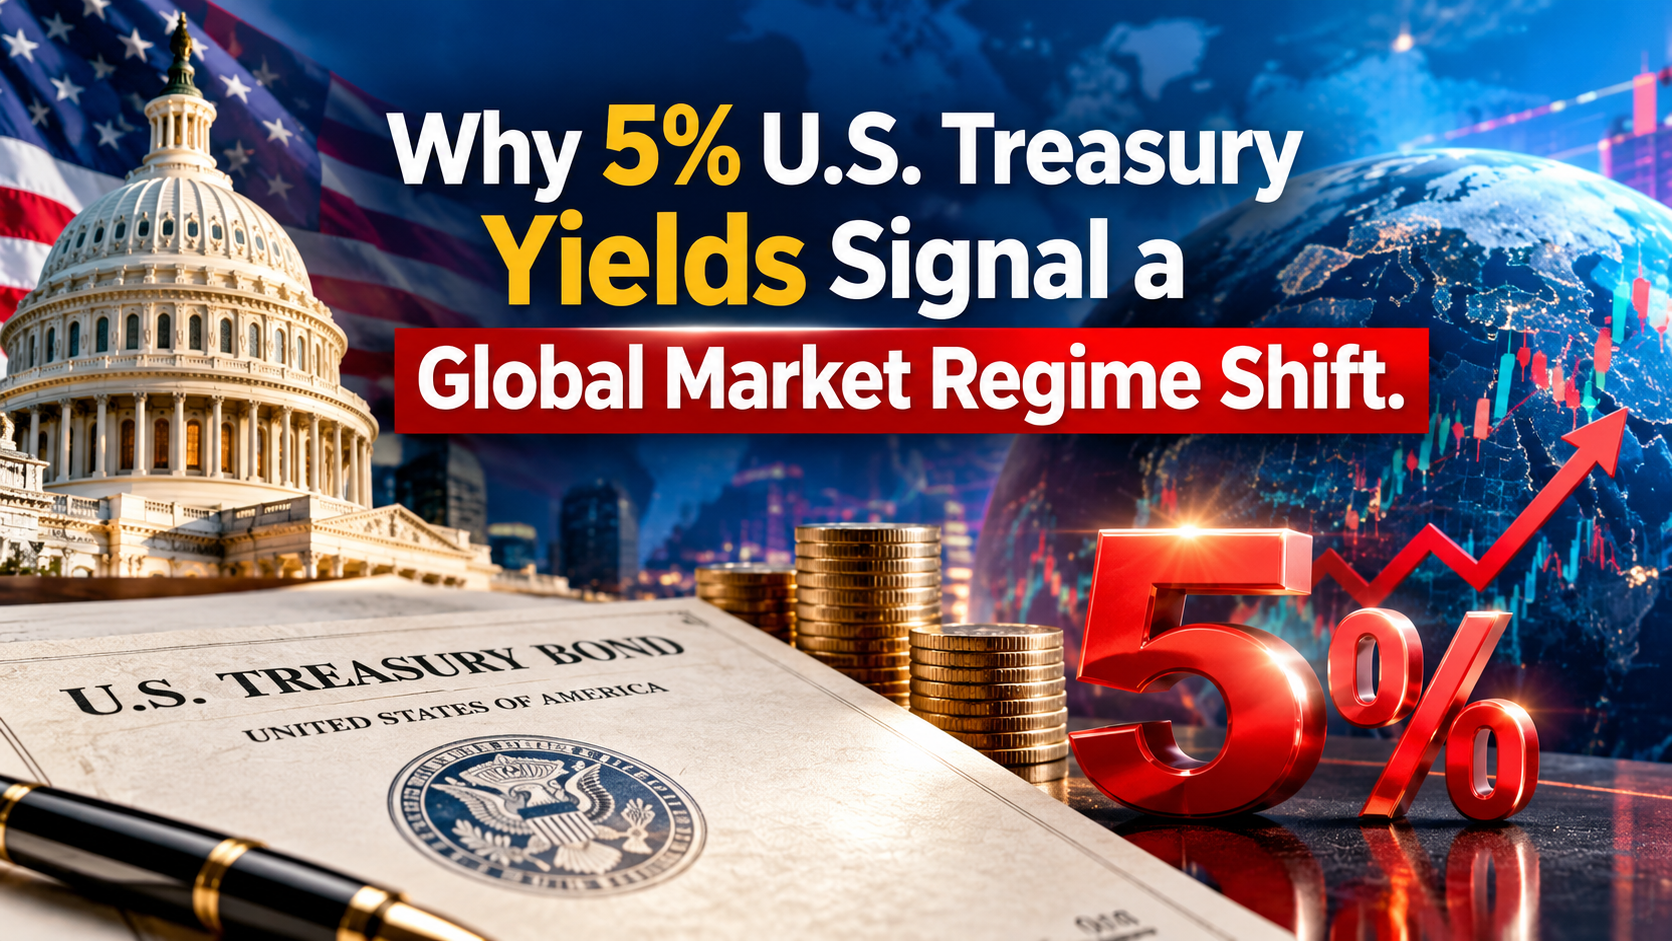
When the benchmark 10-year U.S. Treasury yield crosses the 5.0% threshold, financial markets undergo a structural paradigm shift. Far beyond a routine spike in borrowing costs, a 5% yield alters the hurdle rate for global capital, re-prices risk across every asset class, and exposes systemic sovereign debt fragilities.
1. The 5.0% Benchmark: Why the “Risk-Free” Rate Reshapes Equities
The 10-year U.S. Treasury note is the foundational anchor of global finance. Its yield represents the risk-free rate ($R_f$) utilized in the Capital Asset Pricing Model (CAPM) and Discounted Cash Flow (DCF) models worldwide.
When $R_f$ rises from 2%–3% to over 5%, the present value of future corporate earnings contracts exponentially.
$$\text{Present Value} = \sum_{t=1}^{n} \frac{CF_t}{(1 + WACC)^t}$$
As the Weighted Average Cost of Capital ($WACC$) climbs alongside Treasury yields:
- Growth Stocks & Big Tech: Long-duration growth equities—where the majority of projected cash flows sit far in the future—suffer the sharpest valuation multiple compressions.
- Equity Risk Premium (ERP) Squeeze: With risk-free Treasury bills yielding 5%, the additional premium required to hold volatile equities shrinks dramatically, prompting institutional capital to migrate from stocks to bonds.
- Corporate Liquidity Crunch: Corporate debt refinancing costs double or triple compared to pre-2022 issuance levels, directly eroding net profit margins reported to the U.S. Securities and Exchange Commission.
2. Macroeconomic Catalysts: What Is Driving the Bond Sell-Off?
The surge to 5%+ yields is driven by three primary structural forces rather than a single economic data point:
┌─────────────────────────────────────────────────────────────────────────┐
│                      DRIVER 1: FISCAL EXPANSION                         │
│  U.S. national debt interest + mandatory entitlement outlays now absorb │
│  ~98% of federal tax revenues (Source: U.S. Treasury Department).       │
└────────────────────────────────────┬────────────────────────────────────┘
                                     │
                                     ▼
┌─────────────────────────────────────────────────────────────────────────┐
│                     DRIVER 2: ISSUANCE MISMATCH                         │
│  84% of 12-month Treasury debt issuance concentrated in short-term T-   │
│  Bills, creating severe rollover sensitivity to rate hikes.             │
└────────────────────────────────────┬────────────────────────────────────┘
                                     │
                                     ▼
┌─────────────────────────────────────────────────────────────────────────┐
│                     DRIVER 3: CAPITAL COMPETITION                       │
│  Corporate AI CAPEX spending (~$700B–$900B/yr) competes with sovereign  │
│  bond issuance for global institutional capital reserves.               │
└─────────────────────────────────────────────────────────────────────────┘
Sovereign Debt & Supply Shock
As documented by the U.S. Department of the Treasury, massive fiscal deficit spending has accelerated net bond issuance. Because traditional central bank buyers engaged in quantitative tightening (QT) while foreign sovereign buyers reduced purchases, price discovery has shifted to price-sensitive private institutional investors who demand higher yields (term premium) to absorb debt supply.
Global Central Bank Tightening Synchronicity
Monetary policy decisions from the Federal Reserve System and global partners—such as the Bank of Japan raising interest rates—have reinforced elevated global rate floors. Official global debt perspectives from the International Monetary Fund highlight how high real yields strain emerging market borrowing capacity.
3. Sector Impact Analysis & Asset Class Vulnerabilities
| Asset Class / Sector | Impact Level | Primary Vulnerability / Opportunity |
| Mega-Cap Big Tech | Moderate to High | CAPEX borrowing costs rise; DCF discount rate expansion reduces forward P/E multiples. |
| Commercial & Residential Real Estate | Severe Headwind | Mortgage rates track 10-year yields; refinancing resets create valuation pressure. |
| Short-Term T-Bills & Money Market | Highly Favorable | Yields above 5% offer competitive risk-adjusted real returns without duration risk. |
| Hard Assets (Gold / Precious Metals) | Strategic Hedge | Fiscal deficit concerns and dollar devaluation risks enhance gold’s monetary status. |
| Asian & Emerging Market Equities | Selective Upside | Valuations in South Korea, Japan, and India trade at significant discounts relative to U.S. multiples. |
4. Tactical Asset Allocation Framework
Navigating a 5%+ Treasury yield environment requires balancing yield capture, capital preservation, and equity growth.
Core Portfolio Takeaways
- The Cash-Equivalent Shield: Allocating 35% to short-dated T-Bills mimics Warren Buffett’s liquidity strategy at Berkshire Hathaway, locking in 5%+ yields while preserving optionality for market corrections as reported by CNBC Markets.
- Selective Equity Quality: Focus equity exposure on companies with pristine balance sheets, low debt-to-equity ratios, and pricing power capable of outrunning inflation.
- Monetary Hedges: Gold and hard assets provide downside protection against potential currency weakness if central banks step in to cap bond yields through yield curve intervention. Further macroeconomic debt analysis is regularly updated by Bloomberg Markets and Reuters Financial News.
Discover more from The Economy
Subscribe to get the latest posts sent to your email.

Key Takeaways
- Rolex’s secondary market rose approximately 7.9% year-over-year as of 2026 (per WatchCharts data) — trailing Patek Philippe (+16.2%) and Tudor (+11.4%) but still outperforming Audemars Piguet (+3.4%).
- Rolex raised U.S. retail prices 4–9% in January 2026 (steel models ~5.6%, gold models ~8.7%), narrowing the historical gap between retail and pre-owned pricing.
- Not every model appreciates: steel sports references (Submariner, GMT-Master II, Daytona) have held value far better than two-tone or widely available dress references like the standard Datejust.
- The Lady-Datejust posted the sharpest 2026 gain among tracked collections — up 22.73%, from roughly $9,269 to $11,376 — driven by demand for smaller, “everyday luxury” watches.
- Gold’s rise past $2,400/oz has directly lifted the investment case for Rolex’s precious-metal references (Day-Date, Sky-Dweller, Yacht-Master).
The Model-by-Model Picture
| Category | 2026 Trend |
|---|---|
| Lady-Datejust | +22.73% (strongest performer among tracked collections) |
| Steel sports models (Submariner, GMT-Master II) | Held value well; corrected from 2022 peak but stabilized above retail |
| Daytona | Corrected from highs above $50,000 to the mid-$30,000s; still among the most sought-after references |
| Two-tone/widely available Datejust | Flat to negative — “holds value” is an overstatement for this category |
| Gold references (Day-Date, Sky-Dweller) | Lifted by gold’s rise above $2,400/oz |
Why the “Rolex Always Appreciates” Myth Is Fading
The pandemic-era boom pushed some references — the Daytona above all — to speculative highs disconnected from historical norms. Since the March 2022 peak, steel sports models have compressed meaningfully, and dealers who bought inventory near the top have in some cases faced 20–40% markdowns on liquidation. The lesson for 2026 buyers: Rolex as a category is not a monolith. Value retention depends heavily on specific reference, condition, and whether the piece comes with box and papers (“full set”).
What’s Actually Driving 2026 Strength
- Retail price increases raise the floor. When a new Submariner retails at $10,050 (up from $9,500), a pre-owned example at $11,000–$12,000 suddenly represents a smaller premium — narrowing the gap without secondary prices actually moving.
- Supply discipline remains Rolex’s core lever. The brand has never confirmed production numbers, and secondary-market premiums remain entirely a function of Rolex’s own manufacturing decisions — a risk factor as much as a support.
- Certified Pre-Owned rollout. Rolex’s now fully rolled-out CPO program has changed how buyers transact in the used market, adding a layer of brand-verified legitimacy that supports pricing.
The Case for Rolex as a Portfolio Diversifier
Financial advisors increasingly frame luxury watches not as a replacement for equities or bonds, but as a tangible, historically low-correlation diversifier — one that carries its own risks (illiquidity, condition-dependent pricing, no yield) but has demonstrated multi-decade resilience for specific references.
Is Rolex a good investment in 2026?
It depends heavily on the specific reference. Steel sports models like the Submariner and Daytona have held or grown in value; two-tone and widely available dress models generally have not. Overall, Rolex’s secondary market rose about 7.9% year-over-year in 2026, trailing Patek Philippe but ahead of Audemars Piguet.
Discover more from The Economy
Subscribe to get the latest posts sent to your email.

Key Takeaways
- The KSE-100 Index gained roughly 44% in rupee terms (46–48% in U.S. dollar terms) in fiscal year 2026 — outperforming nearly every major asset class for a third consecutive year.
- The index touched an intraday high of 189,167 in January 2026 before a sharp correction to 146,480 in March amid the Iran-U.S./Israel conflict and a related oil-price spike, then recovered above 180,000 by mid-2026.
- Over FY24–FY26 combined, the KSE-100 has returned 335% in rupee terms (347% in USD terms) — a run analysts attribute to macroeconomic stability under Pakistan’s IMF program, policy continuity, and the country’s return to international debt markets.
- One heavyweight, United Bank Limited (UBL), became Pakistan’s largest listed company by market cap in early 2026, overtaking Oil & Gas Development Company (OGDC).
- Foreign investors were net sellers of roughly $895 million during FY26 even as the index rallied — the gains have been driven overwhelmingly by local institutional and retail buying.
The FY26 Numbers at a Glance
| Metric | FY26 Figure |
|---|---|
| KSE-100 return (PKR) | ~44% |
| KSE-100 return (USD) | ~46–48% |
| 3-year cumulative return (FY24–26, PKR) | 335% |
| 3-year cumulative return (FY24–26, USD) | 347% |
| Intraday high | 189,167 (Jan 23, 2026) |
| Intraday low | 146,480 (Mar 9, 2026) |
| Foreign investor flow | –$895 million (net selling) |
What Drove the Rally
- Macro stability under the IMF program. Rating upgrades, prudent monetary and fiscal policy, and Pakistan’s successful return to international capital markets have all been cited by brokerages (AKD Research, Topline Securities) as core drivers.
- Record monthly remittances. May 2026 remittances hit an all-time high of $4.3 billion, coinciding with the index pushing back above the 180,000 level.
- A geopolitical shock and recovery. The Iran-U.S./Israel conflict triggered a sharp petroleum-price surge and a 29% intra-year swing in the index, but a subsequent MoU on the conflict helped markets recover to pre-war levels by mid-April 2026.
- Sector rotation. Sugar, jute, and transport stocks outperformed the broader market in FY26, while vanaspati, synthetic rayon, and woollen sectors lagged.
Where the Market Stands Now
By mid-September 2026, the KSE-100 was trading in the high-160,000s to near-170,000 range, with brokerage forecasts split between roughly 203,000 (Topline) and a more bullish 263,800 (AKD Research) by December 2026 — a projection that, if realized, would push the index past a historic $100 billion market capitalization for the first time.
The Risk Side of the Ledger
- Foreign capital remains cautious. Nearly $900 million in net foreign selling during a rally this strong suggests international institutions are not yet convinced the move is durable.
- Geopolitical sensitivity. The March 2026 drawdown showed how quickly regional conflict risk (in this case, the Iran-Israel-U.S. situation) can hit the index given Pakistan’s exposure to oil-price shocks.
- Concentration risk. A handful of heavyweights — UBL, OGDC, Engro, HBL, Lucky Cement, Bank Alfalah — have driven a disproportionate share of index gains.
How did the Pakistan Stock Exchange perform in FY26?
The KSE-100 Index gained approximately 44% in rupee terms (46–48% in USD terms) in fiscal year 2026, marking a third consecutive year of outperformance versus other major asset classes, despite a sharp mid-year correction tied to the Iran-U.S./Israel conflict.
Discover more from The Economy
Subscribe to get the latest posts sent to your email.

Global Pension Systems Ranked: The World’s Best and Worst Retirement Frameworks

Global Supply Chain Vulnerabilities: From Eurasian Trade Corridors to Food Consumer Recalls

Why 5% U.S. Treasury Yields Signal a Global Market Regime Shift.

Federal Reserve Defies White House Pressure: Inside Trump’s Demand for Sub-1% Interest Rates After Historic 2026 Rate Hike

How Rising Interest Rates Impact Gig Economy Apps: DoorDash, Uber, and Urban Services

GasBuddy Market Insights: How Crude Price Shifts Impact Local Fuel Cost Averages

DoorDash Driver Payouts, Fee Structures, and Market Competition Analysis

OPINION:Breaking the 3.5% Growth Trap: How Pakistan Can Build a High-Productivity Export Economy

Global Equity Market Divergence: US Tech vs. European Dividend Stocks vs. Asian Growth

Asian Markets Analysis: Navigating Volatility in China, Japan, and Singapore Stocks

Stagflation vs. Soft Landing: How Central Bank Rates Are Reshaping European and Asian Economies

IMF & World Bank Global Economic Outlook: Growth Forecasts Across Europe and Asia

Fed Rate Hike Projections vs. Trump’s Interest Rate Policy: What Global Markets Expect Next

Singapore Stocks: The Ultimate Safe Haven for Markets and Finance in 2026?

State Farm’s $5B Dividend 2026: Who Qualifies & Payout Dates

US-China Relations in Q3 2026: Trade Tariffs and Supply Chain Risks

SpaceX Starship Flight 14: First Orbital Attempt & Starlink V3 Launch Explained

Top 30 Stocks for Investment in PSX for Massive ROI in 2026

The 2026 Crypto Regulatory Shift: What It Means for Institutional Investors

AI Chip Stocks 2026: The Best Semiconductor Investments Beyond Marvell

AI-Powered Training: The Next Multi-Billion Dollar Ecosystem in Fitness

Tween Back-to-School Trends 2026: What’s Driving the $85B Season

10-Year Treasury Yield Hits 4.80%: What It Means for Rates & Portfolios

Oil Prices Break $100 in 2026: Middle East Conflict & Energy Markets

Shein Clothes Quality & Safety in 2026: What Lab Tests Show

Fidelity Investments Review 2026: SPAXX Yields & Zero-Fee Funds

MRVL Earnings 2026: Why Marvell Sank Despite Beating Estimates

China’s US$10.8 Billion Trade Shortcut: Why the Pinglu Canal Matters
-

 Markets & Finance9 months ago
Top 15 Stocks for Investment in 2026 in PSX: Your Complete Guide to Pakistan’s Best Investment Opportunities
-

 Analysis7 months ago
Johor’s Investment Boom: The Hidden Costs Behind Malaysia’s Most Ambitious Economic Surge
-

 Analysis7 months ago
Top 10 Stocks for Investment in PSX for Quick Returns in 2026
-

 Analysis7 months ago
Brazil’s Rare Earth Race: US, EU, and China Compete for Critical Minerals as Tensions Rise
-

 Banks8 months ago
Best Investments in Pakistan 2026: Top 10 Low-Price Shares and Long-Term Picks for the PSX
-

 Investment8 months ago
Top 10 Mutual Fund Managers in Pakistan for Investment in 2026: A Comprehensive Guide for Optimal Returns
-

 Global Economy9 months ago
15 Most Lucrative Sectors for Investment in Pakistan: A 2025 Data-Driven Analysis
-

 Global Economy9 months ago
Pakistan’s Export Goldmine: 10 Game-Changing Markets Where Pakistani Businesses Are Winning Big in 2025