
Banks
The World’s Top 10 Banks in 2025: Power, Risk, and the New Financial Order

China’s trillion-dollar banking giants dominate global finance—but their real estate exposure could reshape the entire system
The global banking landscape has reached an inflection point. As we close 2025, the world’s 100 largest banks control $95.5 trillion in assets—a figure that eclipses the GDP of most nations combined. Yet beneath this staggering concentration of financial power lies a paradox that should concern policymakers and investors alike: the banks with the biggest balance sheets may not be the most resilient.
Four Chinese state-owned institutions—Industrial and Commercial Bank of China, Agricultural Bank of China, China Construction Bank, and Bank of China—occupy the top spots in the global rankings by total assets. Meanwhile, JPMorgan Chase, the largest U.S. bank and fifth globally, commands the highest market capitalization at nearly $788 billion, signaling that investors value American banking efficiency over sheer size.
This divergence tells us something critical: in 2025’s banking world, scale and strength are no longer synonymous.
The Rankings: Size Doesn’t Equal Safety
Based on the latest data from S&P Global Market Intelligence and financial reports through Q4 2024, here are the world’s ten largest banks by total assets:
1. Industrial and Commercial Bank of China (ICBC) – $6.6 trillion in assets. The world’s largest bank by assets continues to benefit from Beijing’s infrastructure spending and state support, operating over 16,000 branches globally. Yet non-performing loan ratios are forecast to rise to 5.4-5.8% in 2025-2027, up from 5.1% in 2024, driven primarily by real estate exposure.
2. Agricultural Bank of China – Approximately $5.8 trillion. Deeply embedded in rural China’s financial system, ABC faces similar real estate headwinds while supporting Beijing’s rural development priorities.
3. China Construction Bank – Around $5.6 trillion. As its name suggests, CCB’s fortunes are intimately tied to China’s construction sector, making it particularly vulnerable to the ongoing property crisis.
4. Bank of China – Approximately $4.8 trillion. The most internationally oriented of China’s “Big Four,” with significant foreign operations, yet still carrying substantial domestic real estate exposure.
5. JPMorgan Chase – $4.0 trillion in assets. The most profitable large bank globally, JPMorgan’s return on equity reached 18% in 2024, demonstrating that American banks achieve more with less. With 5,021 domestic branches and sophisticated digital platforms, JPMorgan exemplifies the “smaller but mightier” model.
6. Bank of America – $2.65 trillion. The second-largest U.S. bank maintains 3,624 domestic branches and has aggressively invested in digital banking, serving millions through its AI-powered virtual assistant Erica.
7. HSBC Holdings – $3.0 trillion. Europe’s largest bank by assets, HSBC is navigating a strategic pivot toward Asia while managing legacy exposures across its global footprint.
8. BNP Paribas – Approximately $2.9 trillion. France’s largest bank and a European leader in investment banking and corporate finance.
9. Crédit Agricole – Around $2.6 trillion. Another French banking giant with significant retail and corporate banking operations across Europe.
10. Citigroup – $1.84 trillion. Once the world’s largest bank, Citi has streamlined operations but maintains an unparalleled global presence with operations in 109 foreign branches.
The Elephant in the Boardroom: China’s Real Estate Time Bomb
Here’s what the asset rankings don’t show: Chinese banks’ exposure to real estate loans has created systemic vulnerabilities, with non-performing asset ratios for property development loans potentially reaching 7% by 2027 if markets stabilize—and much worse if they don’t.
Walk through any major Chinese city today and you’ll see the problem in concrete and steel: unfinished apartment towers, silent construction sites, and the ghostly remains of a $52 trillion property bubble that’s now deflating. Chinese policymakers removed price caps on housing in 2024, allowing eligible families to buy unlimited homes in suburban areas, a desperate attempt to revive demand that has largely failed.
The human cost is staggering. Mid-2025 data shows mortgage non-performing loan rates at listed banks rising overall, with some banks up more than 20 basis points. Millions of Chinese homeowners now hold “underwater” mortgages—properties worth less than their outstanding loans. Some have lost both their homes and down payments yet still owe banks hundreds of thousands of yuan.
For the Big Four Chinese banks, this isn’t just a loan quality issue—it’s an existential question. Banks’ exposure to housing and local government debt declined to 20.7% in Q4 2024 from 22.2% a year earlier, but that still represents trillions in potentially troubled assets. Beijing’s response? Issuing 500 billion yuan in special treasury bonds in 2025 to support bank recapitalization.
Think about that for a moment. The government that owns these banks is now having to inject capital into them to cover losses from lending that the government itself encouraged. It’s a circular firing squad of state capitalism.
American Excellence: Smaller, Smarter, More Profitable
Cross the Pacific and the banking model looks radically different. JPMorgan Chase’s annualized return on equity for Q2 2025 was 16.93%, a performance Chinese banks can only dream of. With roughly $4 trillion in assets—a third of ICBC’s size—JPMorgan generated comparable or superior profits through better risk management, superior technology, and diversified revenue streams.
American banks aren’t perfect. They face their own challenges: rising commercial real estate defaults, regulatory uncertainty around the Basel III endgame rules, and fierce competition from fintech disruptors. Yet their fundamental business model—strict capital requirements, transparent accounting, and market discipline—creates resilience.
The regulatory framework matters enormously. Basel III requires banks to maintain a minimum Common Equity Tier 1 ratio at all times, plus a mandatory capital conservation buffer equivalent to at least 2.5% of risk-weighted assets. U.S. implementation has been stricter than in many jurisdictions, forcing American banks to hold more capital but also making them genuinely safer.
Compare this to China, where banks have remained cautious about new property exposure, transferring housing risks to non-bank financial institutions. That’s not risk management—that’s risk concealment. The leverage doesn’t disappear; it just moves to less regulated corners of the financial system.
The Digital Divide: Innovation as the New Moat
Size and capital strength matter, but in 2025, technological sophistication increasingly separates winners from also-rans. DBS Bank’s AI investments are projected to reach 750 million Singapore dollars (about $577 million) in 2024 and surpass SG$1 billion in 2025. The Singapore-based bank has deployed over 1,500 AI and machine learning models across 370 use cases, from corporate risk assessment to customer service.
JPMorgan and Bank of America aren’t far behind. BofA’s Erica virtual assistant has handled billions of customer interactions, while JPMorgan uses AI for everything from fraud detection to trading strategies. Only 8% of banks were developing generative AI systematically in 2024, with 78% taking a tactical approach, but that’s changing rapidly.
The Chinese banks? They’re investing heavily in digital infrastructure, to be sure. Yet their technology serves a fundamentally different purpose: facilitating state-directed lending, monitoring transactions for political purposes, and supporting Beijing’s social credit systems. Innovation, yes—but innovation in service of control rather than customer value.
European banks occupy an uncomfortable middle ground. BBVA’s expansion of its OpenAI collaboration will see ChatGPT Enterprise rolled out to all 120,000 global employees, signaling serious AI ambitions. Yet European banks collectively lag their American and Asian peers in both investment and implementation.
Basel III Endgame: The Regulatory Reckoning
Speaking of uncomfortable positions, let’s address the regulatory elephant: the Basel III endgame. Under the original proposal, large banks would begin transitioning to the new framework on July 1, 2025, with full compliance starting July 1, 2028. The proposal would have resulted in an aggregate 16% increase in common equity tier 1 capital requirements for affected bank holding companies.
But here’s the twist: US regulators recently proposed to reduce capital requirements on the largest banks, bowing to intense industry lobbying and political pressure. The revised proposal now calls for only a 9% increase for global systemically important banks—still significant, but less onerous than originally planned.
This compromise may prove disastrous. The average leverage ratio of US global systemically important banks declined from a 2016 peak of 9% to about 7% in 2023 and has remained there. Banks have been gaming the system, increasing risk exposure while maintaining superficially healthy risk-weighted capital ratios.
Meanwhile, the European Central Bank and Bank of England have delayed their Basel III implementation, citing US inaction. We’re witnessing a potential regulatory race to the bottom—exactly what the Basel framework was designed to prevent.
The Geopolitical Wildcard: Trade, Tariffs, and Banking Stress
Banking doesn’t happen in a vacuum. International trade disputes and changes in tariffs are expected to influence the performance of banks, impacting asset quality and growth potential. If U.S.-China trade tensions escalate further—a real possibility given recent political developments—Chinese banks will feel the pain first and hardest.
Reciprocal tariffs between the US and China are exerting pressure on Chinese banks, particularly due to declining demand from export-oriented manufacturers. When factories close or cut production, loan defaults follow. It’s Economics 101, but at a scale that could destabilize the entire Chinese banking system.
American banks have their own trade exposure, of course, but it’s more diversified and often hedged. JPMorgan operates in over 100 countries. Citi, despite its shrinking footprint, remains the most truly global bank. They have options. Chinese banks, despite their size, remain heavily dependent on the domestic economy.
What This Means for 2026 and Beyond
So where does this leave us? Here’s my take, informed by twenty years covering this beat:
First, asset size is an increasingly misleading metric. ICBC’s $6.6 trillion balance sheet looks impressive until you examine what’s actually on it. Quality trumps quantity, and American banks demonstrate this daily through superior profitability and resilience.
Second, the Chinese banking system faces a reckoning. It’s not a matter of if, but when and how severe. Chinese banks were sitting on 3.2 trillion yuan ($440 billion) worth of bad loans by the end of September—a 33% increase from pre-Covid times. These numbers, from the banks themselves, are almost certainly understated.
Third, technology is creating a two-tier banking world. Banks that aggressively adopt AI, blockchain, and advanced analytics will dominate. Those that don’t will become utilities—low-margin, heavily regulated, and perpetually vulnerable to disruption.
Fourth, regulatory arbitrage is back with a vengeance. The Basel III endgame was supposed to eliminate it. Instead, we’re seeing regulators water down requirements in response to bank lobbying. This should terrify anyone who remembers 2008.
Finally, geopolitics increasingly dictates banking success. In an era of great power competition, owning a bank in Shanghai or New York means different things. Chinese banks serve the state; American banks serve shareholders (at least theoretically). European banks are caught in between, trying to navigate relationships with both powers while maintaining independence.
The Billion-Dollar Question
Here’s what keeps me up at night: We’ve seen this movie before. Massive banks, seemingly too big to fail, carrying hidden risks that regulators either can’t see or choose to ignore. Policymakers convinced that “this time is different” because of better capital rules, smarter supervision, or more sophisticated risk management.
It never is.
The difference in 2025 is that the risks are concentrated in banks that operate under fundamentally different rules. When—not if—the Chinese property crisis forces Beijing to choose between bank bailouts and economic growth, the ripples will reach far beyond Asia.
The world’s largest 100 banks account for $95.5 trillion in assets, up 3% year over year. That’s growth, yes, but it’s also concentration. Too much power, in too few hands, making too many bets on too few assumptions.
Jamie Dimon, CEO of JPMorgan, likes to say his bank could survive another 2008-style crisis. He’s probably right—JPMorgan is genuinely well-capitalized and well-managed. But could the global financial system survive a crisis originating in China’s $6 trillion banking sector?
That’s the question that should haunt every central banker and finance minister. Because in 2025, we’re not just worried about banks that are too big to fail. We’re worried about banks that are too big, too opaque, and too politically connected for anyone to fully understand the risks they carry.
The world’s top ten banks in 2025 aren’t just financial institutions. They’re nodes in a global system where everyone’s connected to everyone else through invisible chains of credit, derivatives, and counterparty risk. Pull one thread, and you might unravel the whole sweater.
Sleep tight.
The author is a Senior Opinion Columnist specializing in global finance and policy. Views expressed are personal.
Discover more from The Economy
Subscribe to get the latest posts sent to your email.


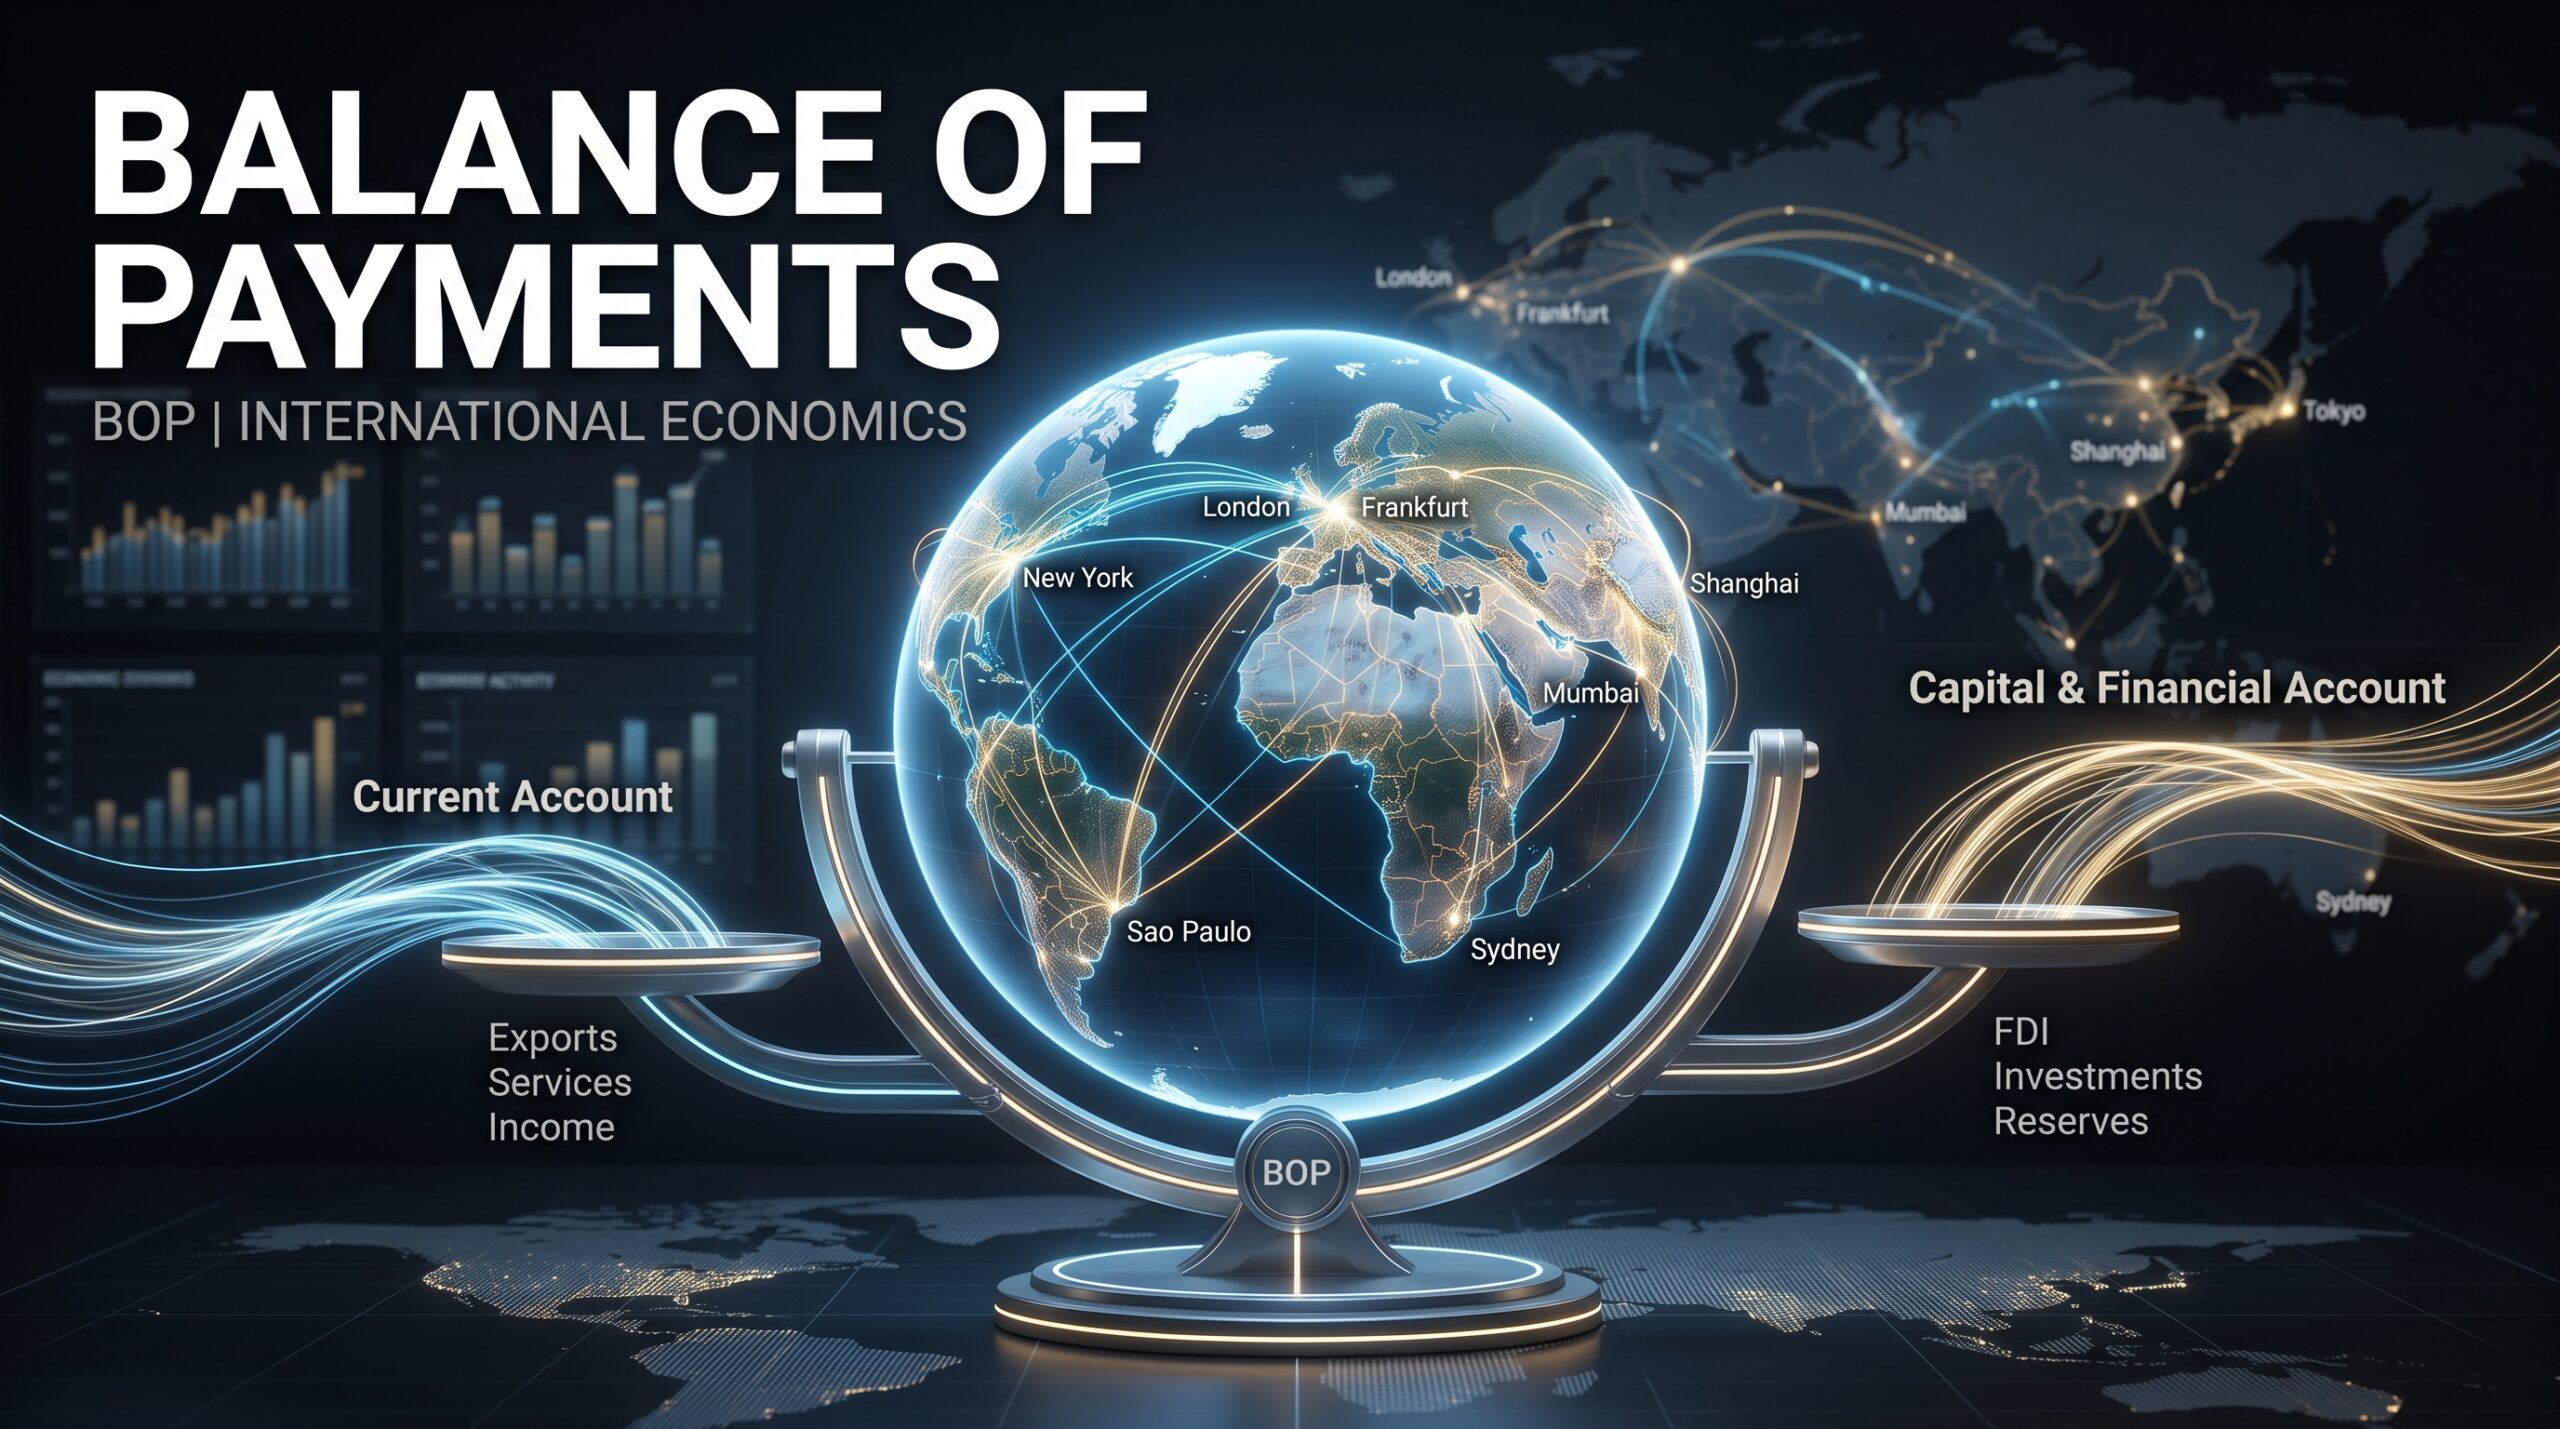
The Ultimate Ledger of a Nation’s International Economic Transactions
The Balance of Payments (BOP) is one of the most comprehensive and critical macroeconomic accounting tools used by economists, financial analysts, and policymakers. It is a systematic record of all economic transactions conducted between the residents of a country (including individuals, businesses, and the government) and the rest of the world over a specific period, typically a quarter or a year.
For platforms like Thefinance.pk and Economy.com.pk, analyzing a nation’s BOP is non-negotiable. While Gross Domestic Product (GDP) measures domestic production, the BOP measures a country’s financial sovereignty, trade competitiveness, and economic connectivity with global markets. If a country is an economic island, the BOP is the detailed logbook of every ship entering and leaving its ports.
The Accounting Identity of BOP
The fundamental rule of Balance of Payments accounting is that it operates on a double-entry bookkeeping system. Every international transaction results in two entries: a credit and a debit. Theoretically, the sum of all elements in the BOP must always equal zero.
$$\text{Current Account} + \text{Capital Account} + \text{Financial Account} + \text{Net Errors and Omissions} = 0$$
In reality, because data collection from thousands of trade ports, banks, and remittance channels is prone to discrepancies, central banks use a balancing item called Net Errors and Omissions to make the ledger balance. When economists talk about a “BOP surplus” or a “BOP deficit,” they are not referring to the entire ledger summing to zero; rather, they are looking at specific sub-accounts—most notably the current account and official reserve assets.
The Three Core Components of the BOP
The Balance of Payments is officially structured into three primary accounts:
1. The Current Account
The Current Account records the flow of goods, services, primary income, and secondary income. It represents the most tangible part of international trade.
- Trade in Goods (Visible Trade): Physical merchandise exports (e.g., textiles, agricultural products) and imports (e.g., machinery, crude oil, electronics).
- Trade in Services (Invisible Trade): Non-physical services such as IT exports, shipping logistics, tourism, insurance, and financial services.
- Primary Income: Compensation paid to non-resident workers and investment income (dividends, interest earned on foreign investments or paid on foreign debt).
- Secondary Income: Current transfers such as worker remittances, foreign aid, and international grants where no direct good or service is received in return. For developing economies like Pakistan, this sub-category—specifically worker remittances—acts as a vital economic cushion.
2. The Capital Account
The Capital Account is relatively small in most economies. It records non-market, non-produced, and intangible asset transfers. This includes the acquisition or disposal of non-produced, non-financial assets (such as patents, copyrights, trademarks, and franchises), as well as debt forgiveness granted by foreign governments.
3. The Financial Account
The Financial Account records international monetary transactions involving financial assets and liabilities. It tracks how a country finances its current account imbalances and invests its surplus capital. It is broken down into four main components:
- Foreign Direct Investment (FDI): Long-term investments where a foreign entity acquires a lasting interest or managerial control in a domestic enterprise (e.g., building a manufacturing plant or acquiring a local telecom company).
- Portfolio Investment: Transactions in financial securities like stocks and bonds. Unlike FDI, portfolio investment is liquid and can enter or leave a country rapidly based on market sentiment.
- Other Investment: Trade credits, loans, currency deposits, and transactions with the International Monetary Fund (IMF).
- Reserve Assets: Foreign currency reserves, gold holdings, and special drawing rights (SDRs) held by the central bank. Changes in reserve assets reflect how the central bank intervened to stabilize the currency.
Why a BOP Crisis Occurs
A Balance of Payments crisis (often referred to as an exchange rate crisis or currency crisis) happens when a country cannot pay for its essential imports or service its external debt obligations because its foreign exchange reserves have been completely depleted.
This typically unfolds through a predictable chain reaction:
- Persistent Current Account Deficits: The country imports vastly more goods and services than it exports, and remittances fail to cover the gap.
- Depleting Reserves: To defend the local currency from crashing, the central bank sells off its foreign exchange reserves (US Dollars, Euros) in the open market.
- Capital Flight: Foreign and domestic investors, sensing economic instability, pull their money out of local stocks and bonds (portfolio investments).
- Exhaustion: Foreign reserves hit critically low levels (sometimes falling below a few weeks’ worth of import cover).
- IMF Bailout: The government is forced to approach international lenders like the IMF for an emergency stabilization program, which usually comes with harsh conditions, including massive interest rate hikes, tax increases, and currency devaluation.
The Strategic Value of BOP Data
For readers of economist.media, monitoring the quarterly BOP statements published by the central bank provides a crystal ball into future economic policy. If the financial account fails to attract enough FDI or loans to cover a widening current account deficit, the writing is on the wall: currency depreciation and policy tightening are imminent. Conversely, a healthy BOP surplus allows a central bank to build up robust foreign reserves, stabilize inflation, and foster investor confidence.
Key Takeaways:
- The Balance of Payments is a complete ledger of all economic transactions between a country and the rest of the world.
- It consists of three main segments: the Current Account, the Capital Account, and the Financial Account.
- Worker remittances and international trade make up the core of the current account in developing nations.
- A BOP crisis occurs when foreign exchange reserves are depleted, forcing nations to seek emergency IMF bailouts.
Authoritative Sources & Further Reading:
- International Monetary Fund (IMF): Balance of Payments Manual (BPM6)
- World Bank: Global Financial Development and BOP Data
- State Bank of Pakistan (SBP): External Sector Statistics
Discover more from The Economy
Subscribe to get the latest posts sent to your email.

Borrowers hoping 2026 would be the year rates finally normalized have instead watched the refinance mortgage market whipsaw by double-digit basis points week to week. On September 10, the average 30-year fixed refinance rate briefly crossed 7%, just three days after sitting at 6.98%, and a week earlier had dropped as low as 7.10% before spiking to 7.29%. That volatility is the story: it isn’t that credit is expensive in any single, stable sense — it’s that the entire yield curve is repricing in real time against a Federal Reserve that may be about to raise rates rather than cut them, a Treasury market absorbing record issuance, and a global economy fragmenting into competing tariff and currency blocs.
For consumers and advisors alike, the operating question for Q4 2026 is no longer “when will rates fall?” — it’s “how do you build a borrowing and savings strategy that is resilient to genuine rate uncertainty in both directions?”
Key Takeaways
- 30-year fixed mortgage rates are oscillating in the 6.7%–7.3% range, with refinance rates typically running higher than purchase rates in September 2026.
- Personal loan rates average 12.2%–12.4% APR for good-credit borrowers (700 FICO), but range from 6.2% at the low end to over 36% for weaker credit profiles.
- High-yield savings accounts are still paying up to 4.2%–4.5% APY, roughly 10–12x the FDIC national average of 0.38%, making cash allocation a genuinely competitive strategy again.
- Refinance applications are up 62% year-over-year even amid rate volatility, driven by borrowers who locked in loans during the 2022–2025 rate-peak years.
- Bankrate’s “Hidden Homeownership Tax” research found 87% of borrowers from that period are overpaying an average of $3,343 a year — a powerful, quantifiable argument for a refinance review.
Refinance Mortgage Rates: Reading Through the Daily Noise
| Rate Type | Approx. Rate (Sept 2026) | 1-Week Range |
|---|---|---|
| 30-year fixed refinance | 6.98%–7.29% | ~30 bps swing |
| 30-year fixed purchase | 6.67%–6.73% | Typically 5–10 bps below refi |
| 15-year fixed refinance | ~6.05%–6.12% | Comfortably under 6.5% |
| 5/1 ARM | 6.64%–7.03% | Most volatile product this month |
The single most important structural fact for any client-facing conversation about refinance mortgage decisions right now: rates don’t track the Fed funds rate directly — they track the 10-year Treasury yield, which is itself being pushed higher by mounting concern over U.S. government debt issuance. When the Treasury announced plans to buy back only $6 billion in longer-term debt in early September — smaller than markets had hoped — yields moved higher and mortgage rates followed within days. This is the fragmentation dynamic in miniature: fiscal policy, not just monetary policy, is now a primary driver of household borrowing costs.
The Refinance Math That Actually Matters
Industry convention has long cited a “1% or 2% lower rate” rule of thumb for when refinancing makes sense, but Bankrate’s own research complicates that shorthand. Consider the payment difference on a $400,000 mortgage:
| Loan Structure | Rate | Monthly P&I | Total Interest Over Life of Loan |
|---|---|---|---|
| 30-year fixed | 6.19% | ~$2,447 | ~$481,021 |
| 15-year fixed | 5.65% | ~$3,300 | ~$194,047 |
The 15-year option cuts total interest paid by more than half — but at a monthly payment nearly $850 higher. For a wealth management advisory or mortgage broker, the right question isn’t “which rate is lower” but “does the client’s cash-flow profile support the shorter term, or does rate-locking on a 30-year with an eye toward a future refinance make more sense given continued volatility?”
Practical refinance triggers for Q4 2026:
- Current rate is at least 1 full percentage point above prevailing refinance rates (the Bankrate “overpaying” research suggests even smaller gaps can justify a review).
- Borrower can eliminate private mortgage insurance (PMI) through home-value appreciation.
- Borrower is consolidating high-interest debt (credit cards, personal loans above 15% APR) into a cash-out refinance at a materially lower blended rate.
- Borrower’s original loan dates to the 2022–2025 rate-peak window — Bankrate data shows this cohort is the most likely to be structurally overpaying.
Personal Loan Rates: A Wide and Widening Spread
Personal loan rates in September 2026 illustrate just how bifurcated consumer credit has become. Bankrate Monitor data puts the average rate at 12.2%–12.4% for a borrower with a 700 FICO score, $5,000 loan amount, and three-year term — but that average masks an enormous range:
| Lender Type | Typical Rate Range | Notes |
|---|---|---|
| Credit unions | 10.6%–10.7% average | Federal rate cap of 18%; best value for members |
| Online fintech lenders | 6.2%–36%+ | Widest range; best rates require excellent credit |
| Commercial banks | ~12.1% average | Requires strong credit and existing relationship |
| Borrowers with 720+ credit (Credible data) | 14.36% (3-yr) / 17.92% (5-yr) | Rose ~0.4 points week-over-week in early Sept |
The spread between a 6.2% best-case rate and a 36% worst-case rate on the same product category is the clearest illustration of “fragmented economy” at the household level: creditworthy borrowers are still finding attractively priced capital, while subprime and near-prime borrowers are facing genuinely punitive terms. For a $10,000 three-year personal loan, total interest costs range from roughly $1,800 at the best tier to $5,300 at the worst — a difference that dwarfs most other financial-planning line items for a middle-income household.
When a Personal Loan Beats a Cash-Out Refinance
- Loan amount is small relative to home equity — refinance closing costs (typically 2–5% of loan value) can erase the benefit of a marginally lower rate.
- Borrower needs funds fast — personal loans typically fund in days; refinances take 30–45 days to close.
- Borrower does not want to reset the amortization clock on their primary mortgage or risk their home as collateral for a non-housing expense.
High-Yield Savings: The Overlooked Half of the Borrowing Conversation
While borrowing costs dominate headlines, the high-yield savings side of the ledger is arguably the more actionable opportunity for most households right now. Top accounts are paying 4.15%–4.5% APY, and select credit-union products have been advertised as high as 10% APY on capped balances. Against a 0.38% national average, this is a 10x-plus differential that costs nothing to capture — no credit check, no underwriting, no risk beyond standard FDIC/NCUA insurance limits.
| Account Type | Typical APY (Sept 2026) | Best Use Case |
|---|---|---|
| Standard high-yield savings | 4.0%–4.5% | Emergency fund, short-term goals |
| Promotional/boosted rate accounts | Up to 4.91% (min. $25K deposit) | Larger cash reserves |
| Credit union tiered accounts | Up to 10% (capped balance) | Small, disciplined savings habit |
| Traditional bank savings | ~0.38% national average | Avoid for anything beyond transactional cash |
The strategic point for a wealth management advisory conversation: in a fragmented, volatile-rate environment, cash is no longer “dead money.” A properly allocated high-yield savings or money-market position can now do real work in a client’s balance sheet while borrowing decisions play out.
FAQ
Should I refinance my mortgage now or wait for lower rates?
With 30-year refinance rates swinging between roughly 6.7% and 7.3% week to week in September 2026, timing the exact bottom is unrealistic. Borrowers whose current rate sits at least a full percentage point above prevailing rates, or who can eliminate PMI, generally benefit from refinancing now rather than trying to time further Fed-driven moves.
What credit score do I need for the best personal loan rates?
Rates as low as 6.2% are generally reserved for borrowers with excellent credit (typically 720+ FICO) applying through online fintech lenders. Borrowers with good but not excellent credit (690–719) are seeing average rates closer to 14–19.5% depending on the lender and term.
Is a high-yield savings account still worth it if the Fed might raise rates?
Yes — HYSA rates have stayed in the 4%+ range through 2026 and would likely rise further if the Fed hikes, making this a rare environment where waiting to open an account costs a household meaningful, quantifiable yield with essentially no downside risk.
Why are refinance rates higher than purchase rates right now?
Refinance rates typically carry a small premium over purchase rates because lenders price in different risk and volume assumptions for refinance transactions; in September 2026 that gap has run roughly 5–14 basis points depending on the loan product.
Discover more from The Economy
Subscribe to get the latest posts sent to your email.

The reliable “tells” that once let a wary consumer spot a scam call — bad grammar, robotic cadence, obvious accent mismatches — have largely disappeared. In 2026, an AI-generated voice can convincingly clone a real person from as little as three to ten seconds of audio, adapt its script in real time under questioning, and pass through a spoofed number that appears to originate from a legitimate bank fraud line. The result is a category of fraud that has moved from a nuisance to a board-level risk, forcing financial institutions to rewrite verification protocols that have gone essentially unchanged for a decade.
Key Takeaways
- Financial institutions reported a 32% rise in deepfake-related fraud attempts in 2025, with over 10% of banks reporting individual deepfake vishing losses exceeding $1 million per case.
- Fraudsters need as little as 3–10 seconds of audio to clone a voice convincingly, with deepfake audio now achieving over 90% accuracy in mimicking real voices, according to multiple 2026 fraud research compilations.
- Vishing now accounts for over 60% of phishing-related incident response engagements, and in more than 80% of voice phishing attacks, attackers use spoofed caller IDs to make calls appear to originate from legitimate numbers.
- The 2024 Arup case remains the reference incident for enterprise risk: an employee at the UK engineering firm authorized 15 wire transactions totaling $25.6 million after joining a video call featuring convincing real-time deepfakes of the company’s CFO and several executives.
- Verizon’s 2026 Data Breach Investigations Report tracks pretexting (synchronous voice or chat manipulation) at 6% of initial access vectors, with phone-based phishing simulations showing a median click rate roughly 40% higher than email-based simulations.
Why Deepfake Vishing Broke the Old Verification Model
Voice-based identity verification has historically relied on a simple, largely unstated assumption: that a familiar voice, speaking in a familiar and contextually appropriate way, is a reasonably reliable signal of identity. That assumption depended on voice cloning being expensive, technically demanding, and largely confined to research labs and high-budget production environments. That constraint dissolved in 2024 and 2025, as open-source models, real-time inference, and cheap, abundant compute closed the technical gap — reducing the cost of a convincing voice-cloning attack from what industry practitioners describe as a “research lab” undertaking to a “weekend project.”
The critical architectural failure this exposes: any verification process that depends on a human listening to a voice and confirming it “sounds right” can now be defeated by AI, because the voice only needs to be convincing under pressure — not indefinitely, and not against forensic scrutiny, just long enough to complete a transaction.
First-Generation vs. Second-Generation AI Vishing
The evolution of AI voice phishing across 2025 and 2026 illustrates why static defenses have consistently fallen behind:
- First-generation (pre-rendered audio): Attackers scripted a short call, generated the audio in advance, and played it through a SIP gateway. Defenders could reliably defeat this by throwing the call off-script — asking an unexpected question, requesting a callback, or changing the topic — because pre-rendered audio could not adapt.
- Second-generation (real-time inference, 2025–2026): Real-time inference services now synthesize responses inside the call itself, with end-to-end latency low enough to feel like a normal conversation. The off-script defense that worked reliably against first-generation attacks is substantially weaker against a system that can adapt its responses live.
This progression matters directly for bank security protocol design: verification procedures built around the assumption that unpredictable questioning defeats vishing are now defending against a threat model that no longer exists in its original form.
The Arup Case: What $25.6 Million Bought as a Lesson
The 2024 Arup incident remains the most frequently cited case study in 2026 vishing analysis, and for good reason: it demonstrates the failure mode at enterprise scale. An employee at the UK engineering firm joined what appeared to be a routine video conference featuring the company’s CFO and several senior executives — everyone looked right, and everyone sounded right. The employee authorized 15 separate transactions totaling $25.6 million to Hong Kong bank accounts before the fraud was identified. The case has become the reference point specifically because it defeated not just voice verification but visual verification simultaneously, illustrating that multi-channel deepfake attacks — voice plus video plus contextually accurate scripting — represent the frontier threat model banks and enterprises must now defend against, not single-channel voice calls in isolation.
How Banks Are Rewriting Security Protocols in 2026
Several concrete protocol shifts are emerging across financial institutions in response to this threat environment:
- Out-of-band verification as a hard requirement. The consistent recommendation across 2026 fraud research is to verify any high-risk request on a channel the caller does not control — for example, calling back through an independently sourced phone number rather than a number provided during the suspicious call itself, or confirming through a separate app-based channel.
- Behavioral and telephony metadata analysis over voice recognition alone. Since caller identity and voice familiarity are no longer sufficient trust signals in high-risk workflows, leading practitioners now emphasize behavioral detection and telephony metadata analysis — call origination patterns, timing anomalies, SIP routing irregularities — as stronger risk signals than voice identity checks.
- Mandatory delay windows for high-value transfers. Given that wire recall success rates drop sharply after the first six hours following a fraudulent transfer, banks are increasingly building mandatory cooling-off periods for large or unusual transfers specifically to create a window for after-the-fact verification.
- Pre-established fraud team relationships. Practitioner guidance increasingly recommends that businesses establish a relationship with their bank’s fraud team before an incident occurs, since wire recall procedures, session revocation, and credential rotation all move faster when a pre-existing escalation path exists.
- No-blame reporting culture. Because deepfake vishing has higher success rates than traditional email phishing due to its emotional-manipulation component, organizations that punish employees for falling victim risk delayed incident discovery; a no-blame reporting culture surfaces incidents in real time rather than days later.
The Data Gap: Where Awareness Training Is Misallocated
A notable finding from 2026 security awareness research is a significant mismatch between actual risk and training prioritization: while 73% of security leaders prioritize phishing reporting training, only 10% prioritize deepfake recognition training specifically — despite 35% of organizations having already experienced a deepfake incident, according to Gartner’s 2025 AI Risk Management Survey. Phone-based phishing simulations show a median click rate roughly 40% higher than email-based simulations, according to Verizon’s 2026 Data Breach Investigations Report, suggesting that voice-channel vulnerability is measurably higher than email-channel vulnerability even as training investment remains skewed toward the latter.
A Practical Vishing Incident Response Framework
- Pre-written wire recall playbook, covering bank fraud-team contact procedures, session revocation, credential rotation, and forensic capture of call metadata
- Mandatory callback verification through independently sourced contact information for any request involving funds transfer, credential reset, or access changes
- Layered channel verification for high-risk requests — requiring confirmation through at least two independent channels (e.g., a callback plus an internal messaging system confirmation) rather than relying on any single channel, however convincing
- Regular, realistic vishing simulation exercises modeled on actual scenarios (bank fraud alerts, executive impersonation, SaaS support calls) rather than generic phishing awareness content alone, given the roughly 40% higher click-through vulnerability documented on phone-based channels
Frequently Asked Questions
How much audio does it take to clone someone’s voice in 2026?
As little as 3 to 10 seconds of audio is sufficient to produce a convincing voice clone using current AI tools, with resulting deepfake audio achieving over 90% accuracy in mimicking the real voice.
What was the Arup deepfake case?
In 2024, an employee at UK engineering firm Arup authorized 15 wire transactions totaling $25.6 million after joining a video call featuring real-time deepfakes of the company’s CFO and several executives — a case widely cited as the reference incident for enterprise multi-channel deepfake fraud risk.
How are banks defending against AI voice phishing in 2026?
Banks are shifting toward out-of-band verification on channels the caller cannot control, behavioral and telephony metadata analysis instead of voice-identity checks alone, mandatory delay windows for high-value transfers, and pre-established fraud-team relationships to speed wire recalls.
Conclusion
The 2026 vishing threat landscape reflects a broader pattern seen across AI-enabled fraud: the technology did not create a new category of crime so much as it removed the practical constraints — cost, technical skill, adaptability — that previously kept an old category of crime in check. Financial institutions rewriting security protocols around out-of-band verification, behavioral metadata, and multi-channel confirmation are responding to a threat model where “it sounded right” and “it looked right” have both stopped being reliable signals of anything at all.
Discover more from The Economy
Subscribe to get the latest posts sent to your email.

Balance of Payments (BOP)

The Falkland Islands Dispute: Sovereign Wealth, Offshore Drilling, and Market Impacts

Gross Domestic Product (GDP): Nominal vs. Real

What is Inflation and the Consumer Price Index (CPI)?

US-China Trade Competition 2026: Supply Chain Relocation Guide

Oil Prices Break $100 in 2026: Middle East Conflict & Energy Markets

South-South Trade Expansion: Digital Integration and Emerging Market Growth

$166B Tariff Refund Tapering Fast: Is Your Business Missing Out?

Stock Market Today: Dow Climbs 500 Points as Markets Shake Off Inflation Jitters

14th WTO Conference 2026: Tariffs & Global Supply Chain Impact

Swish Secures $24M Funding to Disrupt India’s $100B Food Market

Physical AI and Driverless Tech: The Next Trillion-Dollar Industrial Revolution

Enterprise AI Platforms Disrupting B2B SaaS in 2026: Full Analysis

Crypto vs. Safe Haven Assets 2026: Where Institutions Are Hedging

State Farm’s $5B Dividend 2026: Who Qualifies & Payout Dates

US-China Relations in Q3 2026: Trade Tariffs and Supply Chain Risks

Gold’s Wild 2026: From a Record $5,600 Peak to a 24% Crash and Back Toward $4,500

Oil Surges as Strait of Hormuz Traffic Collapses Again

The Rocket That Won’t Quit: Inside SpaceX’s Falcon 9 Launch Machine

Bank of England Set to Hold Rates Through Year-End, Reuters Poll Shows

SpaceX Starship Flight 14: First Orbital Attempt & Starlink V3 Launch Explained

The 2026 Crypto Regulatory Shift: What It Means for Institutional Investors

AI Chip Stocks 2026: The Best Semiconductor Investments Beyond Marvell

Retail Earnings Week: What Home Depot, Target & Walmart Reveal

AI-Powered Training: The Next Multi-Billion Dollar Ecosystem in Fitness

Russia’s Black Sea Oil Exports Fall for a Fifth Straight Week

Global Chip Selloff Deepens: What’s Driving the Aug. 19 Semiconductor Rout

Tween Back-to-School Trends 2026: What’s Driving the $85B Season
-

 Markets & Finance8 months ago
Top 15 Stocks for Investment in 2026 in PSX: Your Complete Guide to Pakistan’s Best Investment Opportunities
-

 Analysis7 months ago
Johor’s Investment Boom: The Hidden Costs Behind Malaysia’s Most Ambitious Economic Surge
-

 Analysis7 months ago
Top 10 Stocks for Investment in PSX for Quick Returns in 2026
-

 Analysis7 months ago
Brazil’s Rare Earth Race: US, EU, and China Compete for Critical Minerals as Tensions Rise
-

 Banks8 months ago
Best Investments in Pakistan 2026: Top 10 Low-Price Shares and Long-Term Picks for the PSX
-

 Investment8 months ago
Top 10 Mutual Fund Managers in Pakistan for Investment in 2026: A Comprehensive Guide for Optimal Returns
-

 Global Economy9 months ago
15 Most Lucrative Sectors for Investment in Pakistan: A 2025 Data-Driven Analysis
-

 Global Economy9 months ago
Pakistan’s Export Goldmine: 10 Game-Changing Markets Where Pakistani Businesses Are Winning Big in 2025