
Business
Stock Market Today: Wall Street Rallies Ahead of Fed Decision as Big Tech Earnings Loom
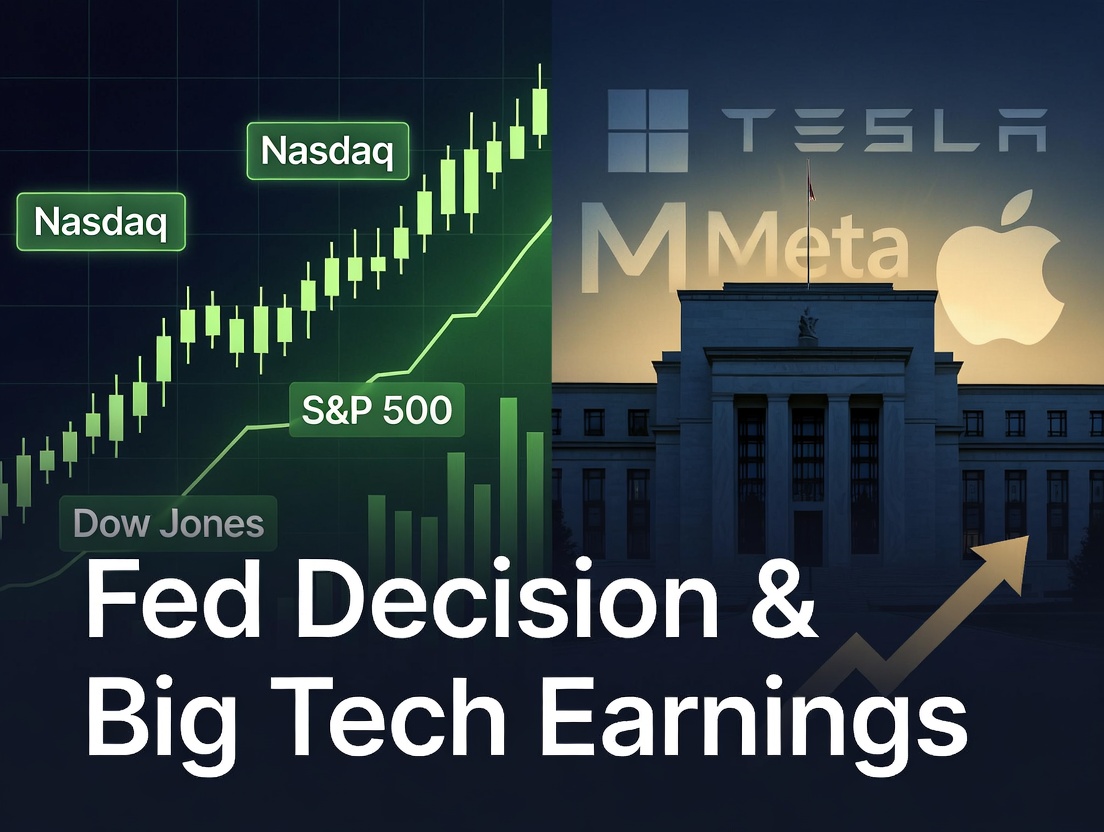
Wall Street opened Wednesday with cautious optimism, as investors positioned for a consequential convergence of monetary policy and corporate earnings that could define the market’s trajectory for months to come. Nasdaq 100 futures rose about 0.5% Yahoo Finance, leading the advance, while S&P 500 futures inched up 0.2% Yahoo Finance. The technology-heavy surge offered a counterpoint to Dow futures, which struggled near the flatline amid sector-specific pressures.
The stock market today reflects a delicate balancing act. The S&P 500 notched a record close on Tuesday of 6,978 Yahoo Finance, placing the benchmark index tantalizingly close to the psychological 7,000 threshold. Yet beneath this surface strength lies a web of uncertainties that few earnings seasons have had to navigate simultaneously: a Federal Reserve caught between political pressure and institutional independence, trillion-dollar questions about artificial intelligence returns, and the specter of policy upheaval at the world’s most powerful central bank.
The Fed Decision: Politics Meets Monetary Policy
Wednesday afternoon’s Federal Reserve announcement marks the central bank’s first rate decision of 2026, and the stakes extend well beyond the expected outcome. CME Group’s Fedwatch tool indicates a 97.2% probability that the Fed will maintain interest rates at the current 3.5% to 3.75% range Stocktwits, effectively pausing the easing cycle that delivered three consecutive quarter-point cuts in the final months of 2025.
The pause itself is unremarkable. What transforms this meeting into a pivotal moment is the extraordinary political backdrop. Earlier this month, the Justice Department served the Fed with subpoenas over testimony Powell made before Congress related to the $2.5bn renovation of the central bank’s headquarters Al Jazeera. In a rare video statement, Powell characterized these moves as pretexts designed to undermine the Fed’s independence, declaring that the threat of criminal charges stemmed from the central bank setting rates based on economic assessment rather than presidential preferences.
The tension between the White House and the Fed has been simmering for months. President Trump has repeatedly called for lower interest rates, even as inflation remains elevated above the Fed’s two percent target. Markets currently expect the Fed to cut once or twice this year — most likely in June and December, according to futures market pricing CNBC. That measured approach stands in sharp contrast to the administration’s more aggressive stance, creating what some economists describe as the most fraught period for central bank independence in modern American history.
According to CNBC, Chair Powell’s press conference will likely become a referendum on Fed autonomy as much as a policy briefing. The question hanging over Wednesday afternoon is whether Powell can navigate this political minefield while maintaining the institutional credibility that underpins effective monetary policy.
Big Tech Earnings: The AI Reckoning Begins
While the Fed commands immediate attention, the real test for equity markets arrives after the closing bell. Microsoft, Meta Platforms, and Tesla report fourth-quarter results Wednesday evening, followed by Apple on Thursday. Collectively, these technology behemoths will provide the first comprehensive read on whether the extraordinary capital expenditures flowing toward artificial intelligence infrastructure are beginning to generate commensurate returns.
The numbers tell a sobering tale of investor expectations. For Microsoft, the expectation is of $3.88 per share in earnings on $80.2 billion in revenues, representing year-over-year growth rates of +20.1% and +15.2% Yahoo Finance. Yet the stock has underperformed recently, pressured by concerns about margin compression as AI-related spending accelerates. Analysts polled by FactSet expect capex to rise to $99 billion this fiscal year CNBC, up substantially from prior periods.
Meta faces perhaps the most acute scrutiny. Analysts expect $8.15 per share in earnings on $58.4 billion in revenues, representing year-over-year growth rates of +1.6% and +20.7% Yahoo Finance. The modest earnings growth belies massive investments in AI and the metaverse. When Meta last reported in October, the stock tumbled despite solid fundamentals, a reaction driven entirely by elevated spending guidance. Investors want clarity on when these investments translate into bottom-line results.
Tesla’s position is equally precarious. The electric vehicle maker faces headwinds from increased competition and margin pressure in its core automotive business, even as it advances autonomous vehicle technology. Apple, meanwhile, must demonstrate that its iPhone supercycle thesis remains intact while addressing questions about its own AI strategy and capital allocation.
Bloomberg reports that the four hyperscalers — Microsoft, Meta, Alphabet, and Amazon — are expected to boost capital expenditures to over $470 billion in 2026 from approximately $350 billion in 2025. That represents an investment surge of historic proportions, predicated on the assumption that artificial intelligence will fundamentally reshape the technology landscape. Whether that thesis proves correct may hinge on the guidance these companies provide this week.
Market Breadth and Underlying Dynamics
The divergence in Wednesday’s pre-market action speaks to broader market tensions. While technology shares lifted Nasdaq futures, the Dow struggled under the weight of sector-specific disappointments. UnitedHealth’s shares tumbled over 15% Yahoo Finance after the Trump administration announced it would keep Medicare payment rates steady, triggering a broader retreat across healthcare insurers.
This uneven performance reflects a market grappling with rotating leadership and uncertain catalysts. The S&P 500’s record close Tuesday marked impressive resilience, yet that strength remains concentrated in a narrow cohort of stocks. The Magnificent Seven technology giants, which once powered market gains with seemingly effortless momentum, have lagged the broader market over the trailing twelve months. Their collective performance through this earnings season will likely determine whether market breadth finally expands or concentration intensifies.
The Path Forward: Scenarios and Implications
As Wednesday’s events unfold, three distinct scenarios emerge. In the first, Powell delivers a dovish hold, signaling patience on rates while emphasizing the Fed’s data-dependent approach. Big Tech earnings meet or exceed expectations, with management teams providing credible paths to AI monetization. Markets rally on reduced uncertainty, and the S&P 500 pushes decisively above 7,000.
The second scenario is less benign. Powell’s press conference devolves into repeated questions about political pressure, undermining confidence in Fed independence. Tech earnings disappoint, or worse, guidance points to continued spending without clear revenue visibility. Volatility spikes as investors reassess both policy support and growth assumptions.
The third possibility splits the difference: The Fed maintains its cautious stance successfully, but tech earnings prove mixed, with some companies demonstrating AI progress while others struggle. Markets digest the results without dramatic moves, entering a period of consolidation as investors await more data.
What seems increasingly clear is that 2026 will test market resilience in ways that 2025’s concentrated leadership never fully addressed. The stock market today stands at an inflection point, caught between political uncertainty, technological transformation, and the timeless challenge of valuation. How these forces resolve may well determine whether this year’s market narrative proves triumphant or cautionary.
Discover more from The Economy
Subscribe to get the latest posts sent to your email.


The ledger books of Silicon Valley have rarely seen such aggressive arithmetic. In the last quarter alone, venture capital flowing into generative AI firms shattered previous benchmarks, with total commitments eclipsing $25 billion. For the architects of Wall Street, this is not merely a surge in venture activity; it is a fundamental recalibration of asset allocation. Institutional investors, once wary of the opaque valuations surrounding unproven LLMs, are now viewing the compute-heavy nature of this transition as a defensible moat. The race has moved beyond the prototype phase and into an industrial-scale battle for infrastructure.
The macro environment remains taut. With central banks maintaining higher-for-longer interest rate stances, the cost of capital should theoretically stifle speculative exuberance. Yet, AI has proven to be a notable exception to traditional fiscal gravity. According to data from the International Monetary Fund, the productivity potential of artificial intelligence is decoupling from broader tech-sector stagnation, drawing capital into a singular, high-velocity vortex. This shift is not incidental; it is systemic. When the Bank for International Settlements released its latest quarterly review, the focus rested heavily on the concentration risk inherent in these massive, multi-billion-dollar funding rounds. The money isn’t just seeking innovation; it’s funding the construction of a new digital grid.
The mechanics of current AI fundraising trends
The primary driver behind these AI fundraising trends is the sheer physical cost of the transition. We aren’t just building software; we are building data centers, cooling systems, and specialized semiconductor foundries. Each round is a down payment on a proprietary pipeline of GPU access. As reported by Bloomberg, the scale of investment in infrastructure-layer startups now rivals the R&D budgets of the entire mid-cap tech sector combined.
This capital is coming from a coalition of traditional venture firms and balance-sheet-heavy tech incumbents. The distinction between “venture” and “corporate strategy” is blurring. When a major cloud provider anchors a $5 billion round for a foundation model startup, it isn’t just an investment; it’s a customer acquisition strategy. This creates a feedback loop: investors provide the capital, the startup buys the hardware, and the hardware provider books the revenue. This circular flow of liquidity is what allows valuations to reach dizzying heights despite a lack of clear, recurring enterprise revenue. Still, the participants are not blind. They are betting that the first-mover advantage in compute volume will dictate the winners of the next decade of digital commerce.
Analytical layer: The search for enterprise ROI
The market is currently wrestling with a simple, brutal question: When does the speculative phase end, and the utility phase begin? Investors are increasingly prioritizing companies that demonstrate tangible enterprise ROI rather than those that simply offer impressive model benchmarks.
How much is being invested in AI startups? Global investment in AI-focused startups surged to over $25 billion in the most recent quarter, representing a 30% increase year-over-year. This concentration of capital is directed primarily toward foundational model builders and specialized semiconductor design firms, as investors look to secure a stake in the core infrastructure powering the next generation of enterprise software applications.
What follows, however, is the structural reality of adoption. Many firms have moved past the “pilot” phase, yet the integration of these tools into core business processes remains fragmented. The secondary keyword, venture capital deployment, is now shifting toward “agents”—autonomous software that performs tasks rather than just generating text. Wall Street is watching closely. The valuation of a model startup is now tethered to its ability to integrate with legacy ERP systems. If a firm cannot demonstrate that its LLM reduces headcount costs or accelerates sales cycles, its ability to secure a Series D or E round is effectively neutralized. The era of “growth at any cost” has been replaced by a rigorous, metric-driven demand for operational efficiency.
Implications for capital markets
The downstream consequences of this capital concentration are profound. For traditional equity markets, the influx of liquidity into private AI firms creates a “talent and capital drain” from public markets. Why go public when private capital is available at such scale and with fewer reporting requirements? This trend risks hollowing out the public equity pipeline, leaving retail investors with limited exposure to the true growth engines of the AI economy.
Furthermore, policymakers are beginning to weigh in. The OECD has recently flagged the potential for market monopolization, noting that the sheer cost of AI infrastructure creates an almost insurmountable barrier to entry. If only four or five entities control the compute backbone of the global economy, the competitive landscape narrows significantly. We are seeing a move toward a high-fixed-cost environment where only the largest, best-capitalized firms can compete. This is a departure from the “garage startup” ethos of the early internet era. That said, the velocity of innovation remains high, as open-source competitors continue to chip away at the moat established by the proprietary titans. The market is betting on a winner-take-most outcome, but history suggests that technological shifts are rarely that clean.
The counter-argument: The bubble hypothesis
Critics of the current trajectory suggest we are in a classic capital-expenditure bubble. They point to the disconnect between the billions spent on training runs and the actual subscription revenue generated by generative tools. The skeptic’s view, often echoed by The Financial Times, is that many of these startups are “compute-traps”—entities that burn through endless cash to maintain their place in the GPU queue without a sustainable path to profitability.
These dissenters argue that when the interest rate cycle eventually turns or the enthusiasm for LLM output plateaus, the market will face a significant correction. They highlight the danger of “zombie” models—firms that survive only on the anticipation of an exit or a strategic acquisition, rather than genuine market demand. It is a cautionary tale that echoes the dot-com era, yet with one critical difference: the infrastructure being built today has immediate utility for high-end enterprise clients. The physical capacity for compute is a real, tangible asset, even if the current valuations assigned to software layers are arguably inflated.
The tension between speculative fervour and structural necessity will define the next eighteen months. Capital is not fleeing the sector, but it is becoming more discerning, more transactional, and significantly more demanding of proof. We are witnessing the maturation of a technological revolution, moving from the chaotic excitement of the inception phase to the cold, hard reality of industrial integration. The winners won’t just be those who raise the most capital; they will be those who survive the inevitable pruning of the current landscape. As the dust settles, the focus will shift from the sheer volume of funds raised to the cold calculation of the balance sheet.
Discover more from The Economy
Subscribe to get the latest posts sent to your email.
For three years, Wall Street forecasters treated a severe downturn as a mathematical certainty. The yield curve inverted, leading economic indicators flashed crimson, and the Federal Reserve orchestrated the steepest borrowing-cost hikes in a generation. Yet the crash never arrived. Instead, the American economic engine simply shifted gears, leaving global peers trailing in its wake. It’s a reality that has forced central bankers to tear up their standard macroeconomic playbooks. We are witnessing an expansion that refuses to die, powered not by speculative froth, but by deep, structural transformations in how American capital and labor function under pressure.
To understand this anomaly, you have to look past the monthly noise. The broader macro landscape reveals an economy that has effectively insulated itself from the very tools designed to slow it down. When the Federal Reserve pushed rates upward, the traditional transmission mechanisms of monetary policy misfired. Historically, expensive credit strangles corporate investment and chokes off household spending. This time, the timeline fractured. According to the International Monetary Fund’s recent global outlook, American growth has consistently outpaced the rest of the G7, expanding at an annualized rate that makes European stagnation look increasingly permanent.
The question is no longer whether a soft landing is possible, but rather how the mechanics of American capitalism rewired themselves to absorb such a colossal macroeconomic shock.
The Core Driver: The Insulation of the American Consumer
The foundation of this ongoing US economic resilience lies in the peculiar structure of American household debt. When you search for the primary shield protecting the broader economy from the Federal Reserve’s rate hikes, look no further than the 30-year fixed-rate mortgage.
Unlike in the United Kingdom or the Eurozone, where variable-rate mortgages dominate and central bank policy rapidly bites into disposable income, the American homeowner is effectively walled off from short-term interest rate volatility. Millions of households refinanced their debt during the zero-interest-rate era of 2020 and 2021. They locked in housing costs at historic lows. As a result, when the Fed funds rate surged past 5%, the effective interest rate on outstanding US mortgage debt barely twitched. This structural quirk gifted American consumers hundreds of billions of dollars in discretionary spending power that, in any other decade, would have been wiped out by debt servicing costs.
Corporate America played a similar game. Large-cap companies spent the pandemic era extending the duration of their debt. They secured cheap capital for five, seven, or ten years. The interest rate shock primarily hit regional banks, commercial real estate, and private equity—sectors that generate headlines but do not individually dictate the velocity of consumer spending.
This financial insulation allowed the labor market to remain historically tight. Data from the Bureau of Labor Statistics shows that job creation has maintained a steady, if cooling, trajectory, keeping the national unemployment rate comfortably below historic danger zones. When people have jobs and fixed housing costs, they spend. Services, travel, and experiential consumption have filled the gaps left by a slowdown in physical goods manufacturing. It’s a consumer-led expansion, but one fortified by a once-in-a-generation debt restructuring.
Structural Shifts and the Labor Hoarding Phenomenon
Move beyond the immediate debt dynamics, and you encounter the deeper US GDP growth factors that explain this prolonged expansion. The American labor market has fundamentally changed since the pandemic.
Why is the US economy doing so well? The US economy is outperforming expectations because of structural insulation and labor hoarding. Businesses, scarred by the severe worker shortages of 2021 and 2022, have chosen to retain staff even as demand cools, prioritizing long-term operational stability over short-term payroll cuts. Coupled with massive fiscal stimulus in infrastructure, this keeps domestic spending remarkably stable.
This concept of labor hoarding is critical. In previous cycles, the moment profit margins contracted, corporations executed mass layoffs. The spreadsheet logic was brutal and immediate. But the post-pandemic scarcity of skilled labor terrified executives. Finding, hiring, and training new talent proved so costly and chaotic that chief financial officers calculated it was cheaper to carry a slightly bloated payroll through a mild slowdown than to fire workers and attempt to rehire them later.
Simultaneously, the supply side of the economy received a massive, coordinated injection of capital. The Inflation Reduction Act and the CHIPS and Science Act unleashed a wave of domestic manufacturing investment. We are seeing factories rise in Ohio, Arizona, and Texas at a pace unseen since the Cold War. This isn’t just government spending; it’s a catalyst that crowded in private capital. Construction spending on manufacturing facilities has doubled, creating a floor under heavy industry and engineering sectors.
That said, the productivity metrics are what truly validate the expansion. We are seeing early signs that the integration of automation and artificial intelligence into enterprise software is beginning to yield actual efficiency gains. Output per hour worked has ticked upward. When an economy produces more value per unit of labor, it can sustain higher wages without necessarily triggering a wage-price inflation spiral. This is the holy grail for central bankers: disinflationary growth.
Global Divergence and the Dollar’s Dominance
The downstream consequences of this exceptionalism are profound, particularly for global markets. The US economy is no longer just moving at a different speed than Europe and China; it is operating on an entirely different trajectory.
This divergence forces a massive realignment in global capital flows. When American yields remain high because the domestic economy can easily tolerate them, the US dollar becomes an inescapable black hole for global investment. Capital flees the stagnant markets of the Eurozone and the property-burdened economy of China, seeking the safety and yield of US Treasuries and American equities.
For policymakers abroad, this creates an excruciating dilemma. The Bank for International Settlements recently noted that central banks in emerging and developed markets are being forced to keep their own interest rates uncomfortably high just to defend their currencies against the dollar. If the European Central Bank cuts rates too aggressively while the Fed holds steady, the Euro collapses, importing inflation back into the continent.
Furthermore, this economic strength grants Washington unprecedented geopolitical leverage. The sheer scale of the American consumer market remains the ultimate prize for global exporters. As supply chains restructure around “friend-shoring” and domestic resilience, the US is effectively dictating the terms of global trade. Multinational corporations are pivoting their supply chains to align with American industrial policy, prioritizing North American assembly to qualify for federal subsidies and avoid tariffs. The gravity of American demand is pulling the center of the global economy firmly back across the Atlantic.
The Bear Case: The Fiscal Sugar Rush
Yet, any rigorous analysis must confront the fragility hidden within the data. The opposing view—the one traded quietly among fixed-income desks and deficit hawks—argues that this is not a structural miracle, but a massive, debt-fueled sugar rush.
The US government is running peacetime deficits that historically only occur during deep recessions or global conflicts. Spending outpaces revenue by trillions. The Congressional Budget Office reports that federal debt held by the public is on track to surpass 115% of GDP by the end of the decade. This is the steel-man argument against American exceptionalism: anyone can generate top-line growth if they are willing to borrow 6% of their GDP every year to fund it.
Critics argue that the fiscal impulse has masked underlying rot. Small businesses, which do not have access to the 10-year corporate bond market, are choking on double-digit borrowing costs. Delinquency rates on credit cards and auto loans for subprime borrowers have surged past 2019 levels. The lower-income quintile of the American consumer base has exhausted its pandemic savings and is now purely surviving on expensive revolving credit.
If the Treasury is forced to continually issue trillions in new bonds to fund the deficit, it could eventually crowd out private investment. Bond vigilantes, largely dormant for a decade, could return, demanding much higher term premiums to hold US debt. If that happens, the protective walls of fixed-rate mortgages and hoarded labor will not be enough to prevent a structural repricing of American assets.
The Verdict on American Resilience
The picture is more complicated than either the breathless optimists or the apocalyptic bears suggest. The United States has engineered a remarkable escape velocity, utilizing a unique combination of fixed-rate consumer debt, reactive labor markets, and aggressive industrial policy to outrun a tightening cycle that should have triggered a recession.
What follows, however, will be a test of fiscal gravity. The architecture of this expansion is brilliant, but it is expensive to maintain. For now, the American economic engine continues to hum, running on a fuel mix that the rest of the world simply cannot replicate. The odds have been defied, but the bill for this resilience is still in the mail.
Discover more from The Economy
Subscribe to get the latest posts sent to your email.

It happened quietly at 11:14 p.m. Pacific time on June 12, 2026. An automated email, sterile and brief, hit the inboxes of enterprise developers from Berlin to Bangalore. Within minutes, the API endpoints for the world’s most capable neural network began returning error codes. Silicon Valley’s borderless internet had finally met the reality of the geopolitical firewall.
Anthropic’s decision to pull the plug on its flagship frontier models was not a product glitch. It was an act of immediate compliance. Just hours earlier, the US Department of Commerce invoked emergency powers under a sweeping new national security directive, effectively reclassifying advanced artificial intelligence weights and cloud-based API access as restricted munitions. The era of global, open-access compute is officially over.
The End of Frictionless Silicon
To understand the sudden blackout, one must look at the architectural shift in Washington’s technological blockade over the past thirty months. Initially, the strategy was purely physical. The Bureau of Industry and Security (BIS) focused on choking off the supply of advanced semiconductors—specifically Nvidia’s high-end GPUs—preventing hardware from crossing adversarial borders.
Yet, regulators quickly realised that hoarding physical chips is irrelevant if foreign entities can simply rent the intellectual output of those chips from server farms in Virginia or Oregon. The loophole was glaring. A developer in a restricted jurisdiction did not need a $40,000 graphics processing unit on their desk; they only needed a credit card and an internet connection to access models trained on billions of dollars of sovereign compute.
That reality forced a drastic policy correction. According to Reuters’ analysis of global cloud infrastructure, foreign entities accounted for roughly 34 percent of all frontier model API calls in the first quarter of the year. Washington viewed this not as a booming export market, but as a slow-motion hemorrhage of strategic intellectual property. The physical embargo has now become a digital quarantine.
The Core Development: The Compute Quarantine
The immediate fallout is unprecedented in the modern software era. As a direct result of the directive, Anthropic suspends latest AI models across all non-allied geographic IP addresses, forcing a sudden and violently disruptive halt to thousands of international enterprise deployments.
The mechanism of this suspension is deeply technical and legally fraught. The Commerce Department has expanded the Foreign Direct Product Rule (FDPR) to encompass what it terms “intangible cloud-compute outputs.” This mandates strict Know Your Customer (KYC) protocols for any cloud provider or model builder operating within US borders. Anthropic, possessing models that vastly exceed the government’s newly lowered compute threshold of $10^{25}$ FLOPs (floating-point operations), found itself instantly out of compliance regarding its overseas enterprise tier.
Rather than risk catastrophic fines or a total shutdown of its domestic operations, the company chose the nuclear option. They severed external access entirely while their legal and engineering teams scrambled to build geofencing architecture capable of satisfying federal auditors.
The collateral damage was instantaneous. European logistics firms, Asian financial institutions, and South American agricultural startups woke up to dead integrations. The Financial Times reports that within the first twelve hours of the suspension, an estimated $4 billion in global enterprise value was disrupted, as automated trading algorithms, customer service agents, and diagnostic tools hard-coded to Anthropic’s architecture suddenly failed.
The blunt nature of the US block reveals a government struggling to write analogue regulations for a digital frontier. By treating API keys like physical exports, the Bureau of Industry and Security is effectively demanding that tech companies act as real-time border patrol agents for the internet.
US AI Export Controls and the New Geopolitics of Compute
This aggressive pivot shifts the battleground from the Taiwan Strait to the server racks of the Pacific Northwest. We are witnessing the weaponisation of artificial intelligence as a primary instrument of foreign policy.
Why did the US block foreign access to Anthropic?
The US blocked foreign access to Anthropic to prevent adversarial nations from using American-trained artificial intelligence for military modernisation, cyberwarfare, and bioweapons research. By extending export controls to cloud APIs, Washington aims to cut off digital access to frontier capabilities that foreign entities cannot physically build themselves due to existing semiconductor bans.
The rationale is entirely rooted in asymmetrical warfare. A model trained to optimise logistics chains for a multinational retailer is fundamentally the same technology required to optimise supply lines for a foreign military. A neural network capable of debugging complex software code can be inverted to hunt for zero-day vulnerabilities in critical civilian infrastructure.
That said, the execution of these US AI export controls reveals a profound anxiety regarding American supremacy. For years, the reigning assumption in Silicon Valley was that exporting AI models was the ultimate form of soft power. You hook the world on your infrastructure, embed your cultural alignment into the weights, and establish total platform dependency.
What follows, however, is a forced decoupling. By cutting off foreign access, the US is inadvertently accelerating the very outcome it fears most: the rise of sovereign, non-Western artificial intelligence.
Market Fractures and Sovereign AI
The downstream consequences of this digital embargo will reshape the global economy for a generation. The immediate victim is the concept of a unified, global software market.
For international developers, the message from Washington is unmistakable: building your business on top of American foundation models is an unacceptable geopolitical risk. You can be unplugged at midnight without warning, recourse, or appeal. This realisation is already triggering a massive capital flight away from US-based API providers.
In Europe, the reaction has been swift and deeply cynical. EU policymakers, already wary of American tech dominance, view the US block as a weaponisation of market share under the guise of national security. Capital allocators in Paris and London are seizing the moment. A recent briefing by The Economist Intelligence Unit highlights that venture funding for indigenous European AI models has surged 400 percent since rumors of the API bans first surfaced in late 2025.
Emerging markets face a much darker reality. Countries across the Global South, lacking the domestic power grid infrastructure and capital required to train their own frontier models, are suddenly facing a profound technological deficit. Cut off from the apex of American innovation, they are being forced into a binary choice: accept technologically inferior open-source models, or turn to state-subsidised Chinese alternatives that come with their own heavy geopolitical strings attached.
This creates a balkanised internet. We are hurtling toward a world divided into high-compute zones and low-compute zones, where access to artificial intelligence is dictated entirely by your passport and your server’s physical latitude. The economic disparity generated by this divide will dwarf the digital divide of the early 2000s.
The Security Imperative vs. Global Innovation
Still, to dismiss the US directive purely as heavy-handed protectionism is to ignore the terrifying capabilities of modern frontier models. The opposing perspective—championed by national security hawks and non-proliferation experts—deserves rigorous examination.
The argument is straightforward: we are distributing the equivalent of digital uranium through a simple monthly subscription. Advanced AI models are no longer sophisticated autocorrect engines; they are reasoning engines capable of executing complex, multi-step actions across the physical and digital worlds.
Proponents of the ban argue that relying on tech companies to self-police their international clients has been a catastrophic failure. A comprehensive study by the Center for Strategic and International Studies (CSIS) recently demonstrated how shell companies operating out of seemingly neutral jurisdictions frequently proxy their compute access to state-sponsored hacking collectives.
From this vantage point, Anthropic’s sudden suspension is not an overreaction, but a dangerously delayed necessary precaution. If a model can assist a foreign biowarfare lab in designing a novel pathogen, or help an adversarial state automate highly sophisticated spear-phishing campaigns against the American power grid, the concept of “frictionless global commerce” becomes structurally suicidal.
The intelligence community views AI models as dual-use technologies on par with nuclear centrifuges. You do not leave centrifuges connected to the public internet, and you do not sell access to them for a fraction of a cent per token. The security imperative dictates that until verifiable, cryptographically secure attribution frameworks exist to guarantee exactly who is using an AI and for what purpose, the default posture must be a closed door.
The Architecture of Isolation
We are entering a deeply precarious phase of the technological revolution. The optimistic consensus of the 2010s—that software would effortlessly dissolve national borders and democratise knowledge—has collapsed under the weight of great power competition.
Anthropic’s midnight shutdown is a watershed marker. It proves that the physical jurisdiction of server farms matters more than the abstract ideals of open-source communities or global enterprise integration. The United States has decided that maintaining its strategic edge in artificial intelligence is worth the cost of fracturing the global digital economy and alienating international allies. The long-term success of this digital quarantine remains highly uncertain, as capital and code possess a unique talent for flowing around arbitrary blockades. The internet was built to route around damage, and the world will inevitably route around Washington.
Discover more from The Economy
Subscribe to get the latest posts sent to your email.

The SpaceX Factor: Hong Kong Stocks Face Liquidity Test From Mega IPO

Economists Bet on Higher Rates as Kevin Warsh Takes Reins at the Fed

Bank of Japan Raises Rates to 1%: The End of Cheap Yen

Industrial Electricity Tariffs in China Raised for Clean Energy Push

China Consumer Spending Falls for First Time Since Covid (2026)

JPMorgan European Retail Banking Strategy: Inside the Chase Expansion

Abu Dhabi Green Economy Chinese Tech: The 2026 Shift

Stocks Surge as US-Iran Deal Ignites Global Rally

Oil Drops 5%: US-Iran Peace Deal Shocks Global Markets (2026)

Fox Roku Acquisition: Inside the $22bn Streaming Power Play

Salesforce Intercom Acquisition: The $3.6bn AI CRM Shakeup

Why Legal AI Start-up Legora is Doubling Its Headcount

Anthropic AI Model Freeze: White House Halts Claude 4 Deployment Over National Security

The Global Economy Is Threatened Again by Trade Imbalances

China Overhauls the World’s Biggest Surveillance Network with Advanced AI

Kevin Warsh Takes the Fed’s Helm — and Walks Straight Into a Rate-Hike Storm

SpaceX, OpenAI & Anthropic IPOs: Wall Street’s $200B AI Test

SpaceX IPO: Inside the $2 Trillion Market Debut

How AI Is Forcing McKinsey and Its Peers to Rethink Pricing

KPMG Australia CEO Resigns After Whistleblower Claims Exposed Investigation Failures

Pakistan Budget FY 2026-27: Relief, Prospects, and the Tightrope Walk

Broadcom Market Value Loss: Revenue Forecast Disappoints

The Guardrails Are Down: How Meta and Google’s AI Models Fold Under Pressure

PwC China Partner Payouts Cut Amid Evergrande Audit Fraud

Stock Market Correction Risk Mounts as Bond Yields Defy the Bull Case

Benefitbay Raises $18M to Build the Plumbing for America’s ICHRA Shift

Nasdaq Tumbles 4% as Chip and Memory Stocks Sink: A $1.2 Trillion Wipeout

China Warns of ‘Severe’ Global Conditions as Economy Shows Weakness
-

 Markets & Finance5 months ago
Top 15 Stocks for Investment in 2026 in PSX: Your Complete Guide to Pakistan’s Best Investment Opportunities
-

 Analysis4 months ago
Top 10 Stocks for Investment in PSX for Quick Returns in 2026
-

 Analysis4 months ago
Brazil’s Rare Earth Race: US, EU, and China Compete for Critical Minerals as Tensions Rise
-

 Banks5 months ago
Best Investments in Pakistan 2026: Top 10 Low-Price Shares and Long-Term Picks for the PSX
-

 Investment5 months ago
Top 10 Mutual Fund Managers in Pakistan for Investment in 2026: A Comprehensive Guide for Optimal Returns
-

 Analysis4 months ago
Johor’s Investment Boom: The Hidden Costs Behind Malaysia’s Most Ambitious Economic Surge
-

 Global Economy6 months ago
15 Most Lucrative Sectors for Investment in Pakistan: A 2025 Data-Driven Analysis
-

 Global Economy6 months ago
Pakistan’s Export Goldmine: 10 Game-Changing Markets Where Pakistani Businesses Are Winning Big in 2025