
Analysis
Apple iPhone 17: Most Popular Lineup Drives Record $57B Quarter

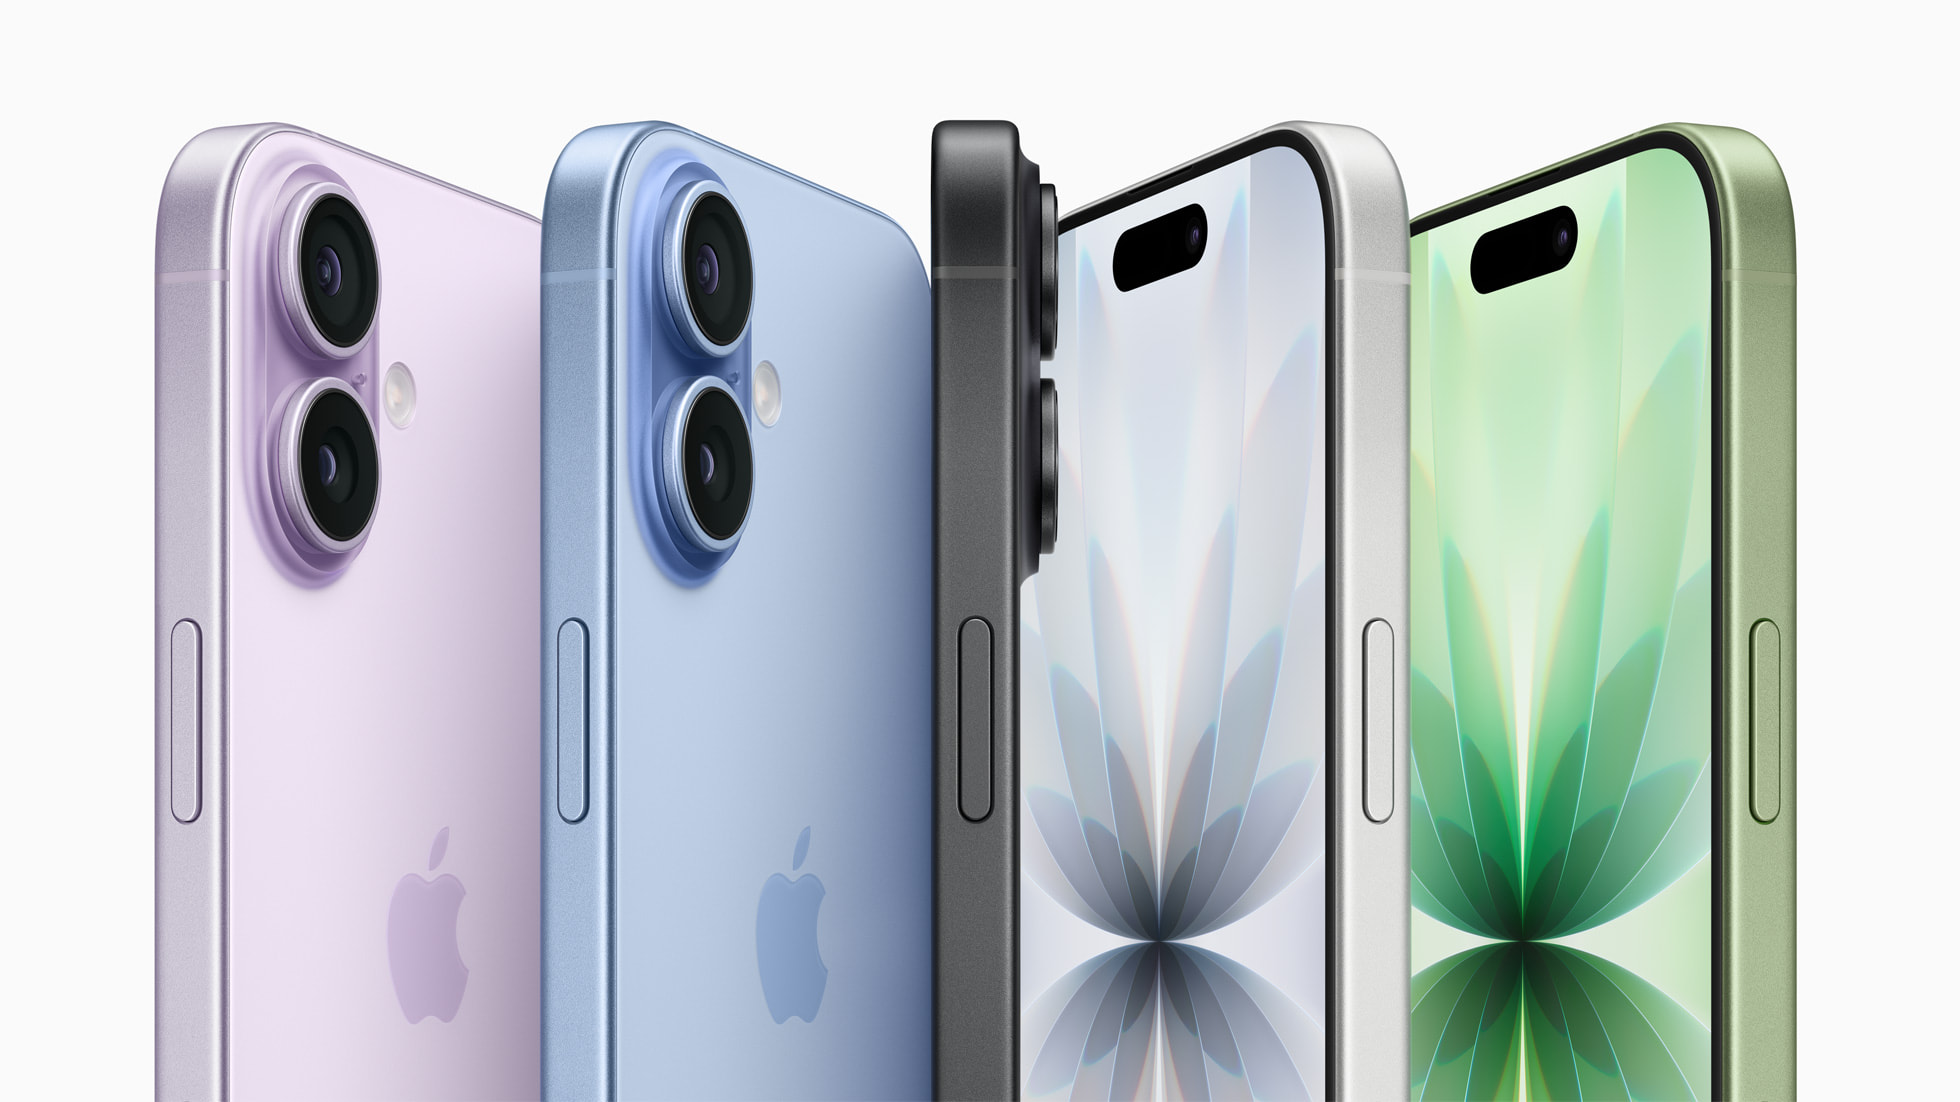
Apple’s iPhone 17 family powered a record $57B March quarter and 17% revenue growth to $111.2B. What the boom reveals about China, AI memory costs, and Apple’s future under John Ternus.
There is a category of corporate achievement that barely registers as remarkable anymore — Apple posting record revenue. The company has done it so often, across so many geographies and product lines, that any given quarter’s superlatives slide past with the effortlessness of a well-rehearsed chorus. But strip away the habituation, and Apple’s fiscal second quarter of 2026 demands genuine attention. Not merely because of the numbers — though $111.2 billion in revenue, growing at 17% year-on-year, is extraordinary for a company of this scale — but because of what those numbers disclose about where premium consumer technology is heading, and under whose stewardship Apple will navigate the journey.
The headline driver was the iPhone 17 lineup, which Tim Cook — in the characteristically understated fashion of a man who has presided over the most profitable consumer electronics run in history — called simply “the most popular lineup in our history.” Cook and CFO Kevan Parekh had cause for satisfaction: iPhone revenue climbed 22% year-on-year to $57 billion, a March-quarter record. The broader question is whether this represents a cyclical high-water mark or a structural inflection point in how consumers — particularly the world’s billion-odd iPhone faithful — think about upgrading.
The Numbers Behind the Boom
| Metric | Q2 FY2026 | Change |
|---|---|---|
| Total Revenue | $111.2B | +17% YoY · Best March Quarter Ever |
| iPhone Revenue | $57.0B | +22% YoY · March-Quarter Record |
| Greater China Revenue | $20.5B | +28% YoY |
| Services Revenue | $30.98B | +16% YoY · All-Time High |
| Net Income | $29.6B | +19% YoY |
| Diluted EPS | $2.01 | vs. $1.65 year prior |
| Gross Margin | 49.3% | Up from 46.6% year prior |
| R&D Expenditure | $11.4B | +33% YoY |
To understand the iPhone 17 effect, consider the full architecture of Apple’s Q2 performance. Net income rose to $29.6 billion, or $2.01 per diluted share — up from $1.65 a year earlier — while gross margin expanded to a formidable 49.3%, a figure most mature hardware companies would regard as science fiction. Every geographic segment posted double-digit growth. Analysts had expected a solid quarter; they received an exceptional one.
Importantly, Cook acknowledged that revenue beat the company’s own guidance “despite supply constraints.” The A19 and A19 Pro chips powering the iPhone 17 family are manufactured by TSMC on its 3-nanometre process — the same advanced node that the semiconductor industry is straining to direct toward AI accelerators. Had Apple been able to fulfil all demand, the numbers would have been larger still. That is not a complaint one often hears from technology executives with genuine credibility. In this case, the underlying data supports it.
“The iPhone 17 family is now the most popular lineup in our history… we believe we gained market share during the quarter.”
— Kevan Parekh, Apple CFO · Q2 FY2026 Earnings Call, April 30, 2026
What Makes the iPhone 17 “Most Popular” in History
The question worth pressing is not whether Apple sold a lot of iPhones — it manifestly did — but why this particular generation broke historic records. The answer is layered. At one level, the iPhone 17 lineup benefited from a broadened family: the addition of the iPhone 17e, a competitively priced entry point, expanded the addressable market meaningfully without compromising the margins that investors have come to expect. Apple has long understood that the most durable moat in consumer technology is the one that admits new entrants at the low end while extracting extraordinary value at the high end.
At another level, the upgrade cycle dynamics were unusually favorable. A significant cohort of iPhone 12 and iPhone 13 users — devices released in 2020–21 — had accumulated four or five years of deferred replacement decisions. The iPhone 17 Pro Max, with its refined camera system, enhanced AI processing capabilities baked into the A19 Pro chip, and display improvements at 120Hz ProMotion across the entire lineup, gave those users a compelling reason to finally act. Cook noted strong demand from both upgraders and customers choosing iPhone for the first time — a dual engine that is relatively rare in mature markets.
The AI Premium Paradox
Here is the productive tension at the heart of Apple’s current moment: the iPhone 17’s outperformance is occurring in a period when Apple Intelligence — the company’s suite of on-device AI features — remains, by most honest assessments, behind the headline capabilities of Google’s Gemini and OpenAI’s GPT family. And yet consumers are buying in record numbers. This tells us something important: the primary driver of iPhone purchases in 2026 remains quality, ecosystem integration, and trust — not raw AI benchmarks.
Apple’s strategic gamble, which involves processing AI computationally on-device rather than surrendering data to cloud inference, appears to resonate with a privacy-conscious consumer base more than many observers anticipated. The recently announced partnership with Google to integrate Gemini capabilities into Siri is a pragmatic acknowledgment that Apple need not build everything — it need only assemble the best experience.
China’s Surprising Comeback
If the iPhone 17’s domestic momentum was expected, the performance in Greater China was genuinely striking. Greater China revenue jumped 28% year-on-year to $20.5 billion — a region that, as recently as 2023, appeared to be entering structural decline for Apple amid Huawei’s resurgence, rising nationalist consumption preferences, and Beijing’s directives encouraging domestic technology procurement in government and state enterprise settings.
What changed? Counterpoint Research data from the first nine weeks of 2026 shows iPhone sales in China surging approximately 23% year-on-year, in a broader smartphone market that contracted by roughly 4%. The divergence is significant. Three forces appear to be operating simultaneously:
- Government subsidies. China’s consumer electronics subsidy programme positioned the iPhone 17 within eligible price bands, stimulating upgrade demand among middle-class consumers sitting on older handsets.
- Supply chain foresight. Apple’s reportedly pre-secured, long-term memory supply agreements with partners like Samsung allowed it to avoid price increases that burdened rival manufacturers.
- Huawei’s ceiling. Despite the technical accomplishment of its Kirin-powered Mate series, Huawei remains constrained in its ability to scale the most advanced silicon domestically.
None of this is a guarantee of durability. The geopolitical environment remains brittle; US–China technology relations have an almost gravitational tendency toward periodic deterioration. Apple’s dependence on China — both as a manufacturing base and as a market representing roughly 18% of revenue — remains the company’s most structurally exposed position. Cook has acknowledged this privately for years; the earnings numbers do not eliminate the risk, they merely defer its salience.
Supply Constraints in the Age of AI: A New Structural Headwind
For most of the past decade, Apple’s primary supply-side challenge was assembling enough final units to meet launch-week demand — a problem of logistics, not components. The current era introduces a categorically different constraint. Cook was explicit on the earnings call: “We expect significantly higher memory costs” in Q3, with the impact of memory inflation likely to “drive an increasing impact on our business” beyond that. The culprit is the global artificial intelligence buildout — the insatiable appetite of data centre operators for high-bandwidth memory has cascaded through the supply chain, creating tightness in the DRAM and NAND markets that consumer device makers now compete within.
This represents a fascinating structural irony. Apple’s devices increasingly market themselves on AI capability — Apple Intelligence, on-device processing, the neural engine improvements in successive chip generations. But the very AI enthusiasm driving those marketing narratives is simultaneously inflating the cost of the memory those devices require. R&D expenditure grew 33% to $11.4 billion in Q2 alone, reflecting accelerating investment in AI infrastructure. Apple is both victim and beneficiary of the AI supercycle.
CFO Parekh noted that Apple faces supply constraints on iPhones and Macs simultaneously, with the MacBook Neo — an apparent instant hit — selling out entirely. Supply constraints on the Mac Mini and Mac Studio may extend “for several months,” Cook said. For investors accustomed to Apple executing flawlessly on supply chains, this is worth monitoring — not because the situation is critical, but because it signals that the company is entering a period where input costs are partially beyond its direct control.
The Services Flywheel Keeps Spinning
Amid the iPhone drama, Apple’s Services division quietly posted yet another all-time revenue record: $30.98 billion, up 16.3%, comfortably beating analyst expectations of $30.4 billion. The significance of this figure compounds annually. Services — Apple TV+, iCloud, the App Store, Apple Pay, Apple Music, and the expanding family of subscription offerings — generates margins that dwarf those of hardware. Every iPhone sold is a gateway into this ecosystem; every year a user remains converts into recurring, high-margin revenue that is largely insulated from component cost volatility.
This is the part of Apple’s business that its most sophisticated investors have spent the past half-decade learning to appreciate. The installed base of active Apple devices now exceeds two billion globally — a captive audience for services monetisation that no competitor can easily replicate. Samsung makes excellent hardware; no one pays monthly for the Samsung ecosystem. This asymmetry is durable, and it explains why Apple’s valuation multiple has proved surprisingly resilient through periods of hardware stress.
The Post-Cook Era: Discipline, AI, and What John Ternus Inherits
This earnings call carried unusual historical weight. It was the first time Apple faced Wall Street since announcing that Tim Cook would step down as CEO, with John Ternus — currently SVP of Hardware Engineering — set to assume the role on September 1, 2026. Ternus is not a household name outside Apple’s own circles, which is, arguably, a point in his favour. He is a product engineer by formation, not a supply chain operator or a financier — the sensibility he brings is that of someone who cares, with genuine depth, about how the things Apple makes actually work.
Cook’s fifteen-year tenure transformed Apple from a premium hardware maker with exceptional margins into a platform business with hardware as its on-ramp. Ternus inherits an extraordinarily strong hand — the most popular iPhone lineup in history, a services business printing cash, a gross margin at near-record levels, and a $100 billion share repurchase authorization freshly renewed by the board. What he also inherits is a set of genuinely difficult problems:
- The AI capability gap relative to pure-software competitors
- The memory cost headwind expected to worsen through 2026
- The China geopolitical exposure that no earnings quarter can fully immunise
- The question of what the next major product platform beyond the iPhone will be
The company that Ternus inherits is not merely the most profitable consumer technology business ever assembled — it is one facing a genuine inflection point in how intelligence, rather than silicon, defines a device’s value.
The signals from the earnings call were instructive. Ternus, in his brief public remarks, struck a note of what might be called calibrated ambition — emphasising the strength of the product roadmap without overclaiming. That restraint is appropriate. Apple has lost credibility in the AI narrative by making promises that Siri has not reliably kept. The Gemini integration partnership — pragmatic, slightly humbling for a company that has historically insisted on vertical integration — suggests that Ternus’s Apple will prioritise experience over ideology. That is the right instinct.
The Broader Premium Smartphone Market: Apple as Gravity Well
Zoom out from Apple’s specific results, and the picture for the broader premium smartphone market is one of continued stratification. Samsung’s Galaxy S25 series performed credibly but could not match iPhone 17’s upgrade momentum. Chinese manufacturers — Xiaomi, OPPO, Vivo — continue to produce technically impressive devices at aggressive price points but remain largely constrained outside their home markets by geopolitical friction and brand trust deficits. Huawei’s recovery narrative remains compelling in China but is circumscribed everywhere else by the consequences of US export controls.
The result is an increasingly bifurcated global smartphone market: Apple dominant above $800, a contested middle ground, and Chinese manufacturers competing intensely in emerging markets. This structure suits Apple well — the premium segment is where the margin lives, and Apple’s ability to raise effective selling prices through a mix of pro-tier innovation and financing options has proved remarkably durable across economic cycles. The iPhone 17 cycle did not merely sustain this position; it deepened it.
Cyclical Win or Structural Dominance? A Measured Verdict
The honest answer is: both, with caveats. The iPhone 17 benefited from a favourable alignment of pent-up upgrade demand, a genuinely compelling product iteration, a broadly stable global consumer environment, and a China market experiencing government-stimulated electronics consumption. Some of those tailwinds will fade. The deferred-upgrade cohort will be substantially exhausted by year-end. Chinese subsidy programmes have defined timeframes. Memory costs will pressure margins in ways that quarters of record iPhone revenue cannot entirely absorb.
And yet the structural case for Apple remains among the most robust in global technology. The ecosystem lock-in is real and deepening. The services revenue base is compounding. The brand carries a form of cultural gravity — particularly among younger consumers — that is extraordinarily difficult to build and stubbornly resistant to erosion. The iPhone 17 being the most popular lineup in history is not an accident: it is the outcome of a decades-long, systematically executed strategy of making the device that people trust most with the most intimate moments of their lives.
Whether John Ternus can sustain that trust while navigating the AI transition — the genuine next frontier of what a smartphone does and means — is the question that will define the next chapter of the company’s history. The Q2 FY2026 earnings are a resounding vindication of what Tim Cook built. They are also the most consequential set of results that Ternus will never have to personally explain. From September, the story is his to write.
Discover more from The Economy
Subscribe to get the latest posts sent to your email.



Key Takeaways
- Rolex’s secondary market rose approximately 7.9% year-over-year as of 2026 (per WatchCharts data) — trailing Patek Philippe (+16.2%) and Tudor (+11.4%) but still outperforming Audemars Piguet (+3.4%).
- Rolex raised U.S. retail prices 4–9% in January 2026 (steel models ~5.6%, gold models ~8.7%), narrowing the historical gap between retail and pre-owned pricing.
- Not every model appreciates: steel sports references (Submariner, GMT-Master II, Daytona) have held value far better than two-tone or widely available dress references like the standard Datejust.
- The Lady-Datejust posted the sharpest 2026 gain among tracked collections — up 22.73%, from roughly $9,269 to $11,376 — driven by demand for smaller, “everyday luxury” watches.
- Gold’s rise past $2,400/oz has directly lifted the investment case for Rolex’s precious-metal references (Day-Date, Sky-Dweller, Yacht-Master).
The Model-by-Model Picture
| Category | 2026 Trend |
|---|---|
| Lady-Datejust | +22.73% (strongest performer among tracked collections) |
| Steel sports models (Submariner, GMT-Master II) | Held value well; corrected from 2022 peak but stabilized above retail |
| Daytona | Corrected from highs above $50,000 to the mid-$30,000s; still among the most sought-after references |
| Two-tone/widely available Datejust | Flat to negative — “holds value” is an overstatement for this category |
| Gold references (Day-Date, Sky-Dweller) | Lifted by gold’s rise above $2,400/oz |
Why the “Rolex Always Appreciates” Myth Is Fading
The pandemic-era boom pushed some references — the Daytona above all — to speculative highs disconnected from historical norms. Since the March 2022 peak, steel sports models have compressed meaningfully, and dealers who bought inventory near the top have in some cases faced 20–40% markdowns on liquidation. The lesson for 2026 buyers: Rolex as a category is not a monolith. Value retention depends heavily on specific reference, condition, and whether the piece comes with box and papers (“full set”).
What’s Actually Driving 2026 Strength
- Retail price increases raise the floor. When a new Submariner retails at $10,050 (up from $9,500), a pre-owned example at $11,000–$12,000 suddenly represents a smaller premium — narrowing the gap without secondary prices actually moving.
- Supply discipline remains Rolex’s core lever. The brand has never confirmed production numbers, and secondary-market premiums remain entirely a function of Rolex’s own manufacturing decisions — a risk factor as much as a support.
- Certified Pre-Owned rollout. Rolex’s now fully rolled-out CPO program has changed how buyers transact in the used market, adding a layer of brand-verified legitimacy that supports pricing.
The Case for Rolex as a Portfolio Diversifier
Financial advisors increasingly frame luxury watches not as a replacement for equities or bonds, but as a tangible, historically low-correlation diversifier — one that carries its own risks (illiquidity, condition-dependent pricing, no yield) but has demonstrated multi-decade resilience for specific references.
Is Rolex a good investment in 2026?
It depends heavily on the specific reference. Steel sports models like the Submariner and Daytona have held or grown in value; two-tone and widely available dress models generally have not. Overall, Rolex’s secondary market rose about 7.9% year-over-year in 2026, trailing Patek Philippe but ahead of Audemars Piguet.
Discover more from The Economy
Subscribe to get the latest posts sent to your email.

Navigating Mortgage and Loan Refinancing in a High-Yield Environment
Global public debt crossing critical thresholds has kept central bank policies volatile, resulting in fluctuating US Treasury yields throughout 2026. For homeowners and commercial property holders burdened by previous high-interest borrowing cycles, finding optimal refinance windows has become a high-stakes financial puzzle. Stalled disinflation and stubborn employment numbers mean rate cuts are incremental, requiring borrowers to act with precision.
Timing your mortgage or commercial loan refinance in this environment requires a deep understanding of yield curve movements and lender risk appetites.
Decoding 2026 Refinance Dynamics
The 10-Year Treasury Yield Benchmark
Mortgage rates continue to track closely with the 10-year US Treasury yield. When macroeconomic anxiety spikes debt issuance, yields rise, tightening consumer borrowing capacity. Savvy borrowers monitor weekly Treasury auctions to lock in rates during brief dip windows.
Hybrid ARMs and Alternative Structures
With fixed rates remaining elevated, 7/1 and 10/1 adjustable-rate mortgages (ARMs) have surged in popularity. These products offer lower initial monthly payments, giving borrowers breathing room until central bank easing cycles fully materialize.
| Loan Product | Current Rate Range | Best For | Key Risk Factor |
| 30-Year Fixed Mortgage | 6.2% – 6.8% | Long-term predictability | Higher initial monthly outlay |
| 7/1 Hybrid ARM | 5.5% – 5.9% | Short-term ownership / flipping | Rate reset risk after year 7 |
| Commercial Refinance | 7.0% – 8.2% | Corporate asset restructuring | Strict DSCR lender covenants |
Actionable Steps for Successful Refinancing
To maximize your chances of securing favorable refinance terms in a volatile market, follow a disciplined preparation strategy.
Boost Your Credit Score Immediately: Lenders in 2026 are applying stringent credit tiering; a 20-point increase can drop your APR by a crucial quarter-point.
Shop Regional Credit Unions: Smaller financial institutions often offer portfolio loans with more flexible underwriting than major national banks.
Calculate the Break-Even Point: Ensure your total closing costs are recouped through monthly savings within 24 months of closing.
“Market Strategist View: Refinancing in 2026 is an exercise in opportunistic timing. Borrowers must maintain immaculate financial profiles ready to strike the moment Treasury yields dip.”
Mastering the complexities of today’s debt environment ensures you can successfully lower your debt service costs and protect your long-term financial stability.
Discover more from The Economy
Subscribe to get the latest posts sent to your email.

The days of pulling generic auto insurance quotes based purely on your zip code and age are officially over. In 2026, insurance comparison engines are powered entirely by generative AI and real-time telematics. These platforms digest thousands of live data points—ranging from your driving smoothness via connected vehicle sensors to real-time traffic congestion patterns—to generate hyper-personalized premiums instantly.
For consumers, this evolution represents both a massive opportunity for savings and a hidden trap for penalty pricing. Understanding how AI algorithms evaluate risk is essential for anyone looking to lower their monthly auto insurance premiums.
How AI Comparison Engines Evaluate Your Risk Profile
Behavioral Telematics and Connected Cars
Modern cars stream performance data directly to insurance aggregators. Generative AI models analyze braking sharpness, acceleration curves, cornering G-forces, and phone distraction metrics. Drivers who maintain smooth, defensive habits are rewarded with dynamic rate cuts of up to 40% compared to traditional rating tiers.
Predictive Traffic and Weather Modeling
AI tools now cross-reference your daily commute route with predictive weather and accident probability models. If your standard parking location or driving corridor has a statistically higher incidence of uninsured motorist claims, your quotes will reflect that hyper-local risk assessment.
| Comparison Factor | Traditional Rating Model | 2026 Generative AI Model | Impact on Premium |
| Mileage & Usage | Annual estimated odometer reading | GPS tracking & live trip duration | High (up to 35% savings) |
| Driving Behavior | MVR driving record & accidents | Real-time braking, speed, & G-force | Critical (determines tier) |
| Vehicle Tech | Make, model, and safety rating | ADAS calibration & repair cost data | Moderate |
Strategies to Lower Your AI-Driven Insurance Quote
To outsmart the algorithm and secure the lowest possible premium in 2026, drivers must proactively manage their digital footprint on insurance platforms.
Opt-In for Telematics Trial Periods: Many insurers offer immediate 15% discounts just for installing their driving app; let it track safe habits for 30 days to lock in permanent savings.
Scrub Unverified Public Records: Ensure your motor vehicle report is free of clerical errors that AI risk models misinterpret as reckless behavior.
Compare AI Aggregators: Use platforms that integrate multi-carrier API feeds rather than single-brand comparison sites to find the best risk-adjusted rate.
“Industry Note: AI-driven pricing rewards transparency and precision. Drivers who actively manage their telematics data consistently out-save those relying on legacy quote calculators.”
Embracing AI comparison tools allows savvy policyholders to customize coverage limits precisely to their driving habits, eliminating wasted premium spend while ensuring robust protection.
Discover more from The Economy
Subscribe to get the latest posts sent to your email.

VIX Index Explained: How to Trade Wall Street’s Fear Gauge Today

Commercial vs Residential Real Estate: Which Wins in 2026?

Presidential Stock Market Performance: How Trump’s Second Term Compares to History

2026 Real Estate Market News: Are We Heading for a Correction?

Bitcoin Price Forecast 2026–2027: Will the 4-Year Cycle Hold?

Fidelity Crypto vs. Traditional Brokerages: A Guide for Modern Investors

The 2026 Global Smartphone Market: AI Integration and Competitor Analysis

SpaceX IPO: How Aerospace Is Reshaping Tech Startup News

Fidelity Investments Review: Maximizing Returns in a Volatile Stock Market

How Crypto Transformed the Trump Fortune: A $1.4 Billion Financial Breakdown

Global Pension Systems Ranked: The World’s Best and Worst Retirement Frameworks

Global Supply Chain Vulnerabilities: From Eurasian Trade Corridors to Food Consumer Recalls

Why 5% U.S. Treasury Yields Signal a Global Market Regime Shift.

Federal Reserve Defies White House Pressure: Inside Trump’s Demand for Sub-1% Interest Rates After Historic 2026 Rate Hike

State Farm’s $5B Dividend 2026: Who Qualifies & Payout Dates

US-China Relations in Q3 2026: Trade Tariffs and Supply Chain Risks

Top 30 Stocks for Investment in PSX for Massive ROI in 2026

SpaceX Starship Flight 14: First Orbital Attempt & Starlink V3 Launch Explained

The 2026 Crypto Regulatory Shift: What It Means for Institutional Investors

AI Chip Stocks 2026: The Best Semiconductor Investments Beyond Marvell

Tween Back-to-School Trends 2026: What’s Driving the $85B Season

AI-Powered Training: The Next Multi-Billion Dollar Ecosystem in Fitness

Oil Prices Break $100 in 2026: Middle East Conflict & Energy Markets

10-Year Treasury Yield Hits 4.80%: What It Means for Rates & Portfolios

Fidelity Investments Review 2026: SPAXX Yields & Zero-Fee Funds

BRICS+ Cross-Border Payments 2026: Interoperability Explained

Shein Clothes Quality & Safety in 2026: What Lab Tests Show

MRVL Earnings 2026: Why Marvell Sank Despite Beating Estimates
-

 Markets & Finance9 months ago
Top 15 Stocks for Investment in 2026 in PSX: Your Complete Guide to Pakistan’s Best Investment Opportunities
-

 Analysis7 months ago
Johor’s Investment Boom: The Hidden Costs Behind Malaysia’s Most Ambitious Economic Surge
-

 Analysis7 months ago
Top 10 Stocks for Investment in PSX for Quick Returns in 2026
-

 Analysis8 months ago
Brazil’s Rare Earth Race: US, EU, and China Compete for Critical Minerals as Tensions Rise
-

 Banks8 months ago
Best Investments in Pakistan 2026: Top 10 Low-Price Shares and Long-Term Picks for the PSX
-

 Investment8 months ago
Top 10 Mutual Fund Managers in Pakistan for Investment in 2026: A Comprehensive Guide for Optimal Returns
-

 Global Economy9 months ago
15 Most Lucrative Sectors for Investment in Pakistan: A 2025 Data-Driven Analysis
-

 Global Economy9 months ago
Pakistan’s Export Goldmine: 10 Game-Changing Markets Where Pakistani Businesses Are Winning Big in 2025