
Travel
Spain Near 100M Tourists: A Structural Travel Map Shift : Booming Travel Economy

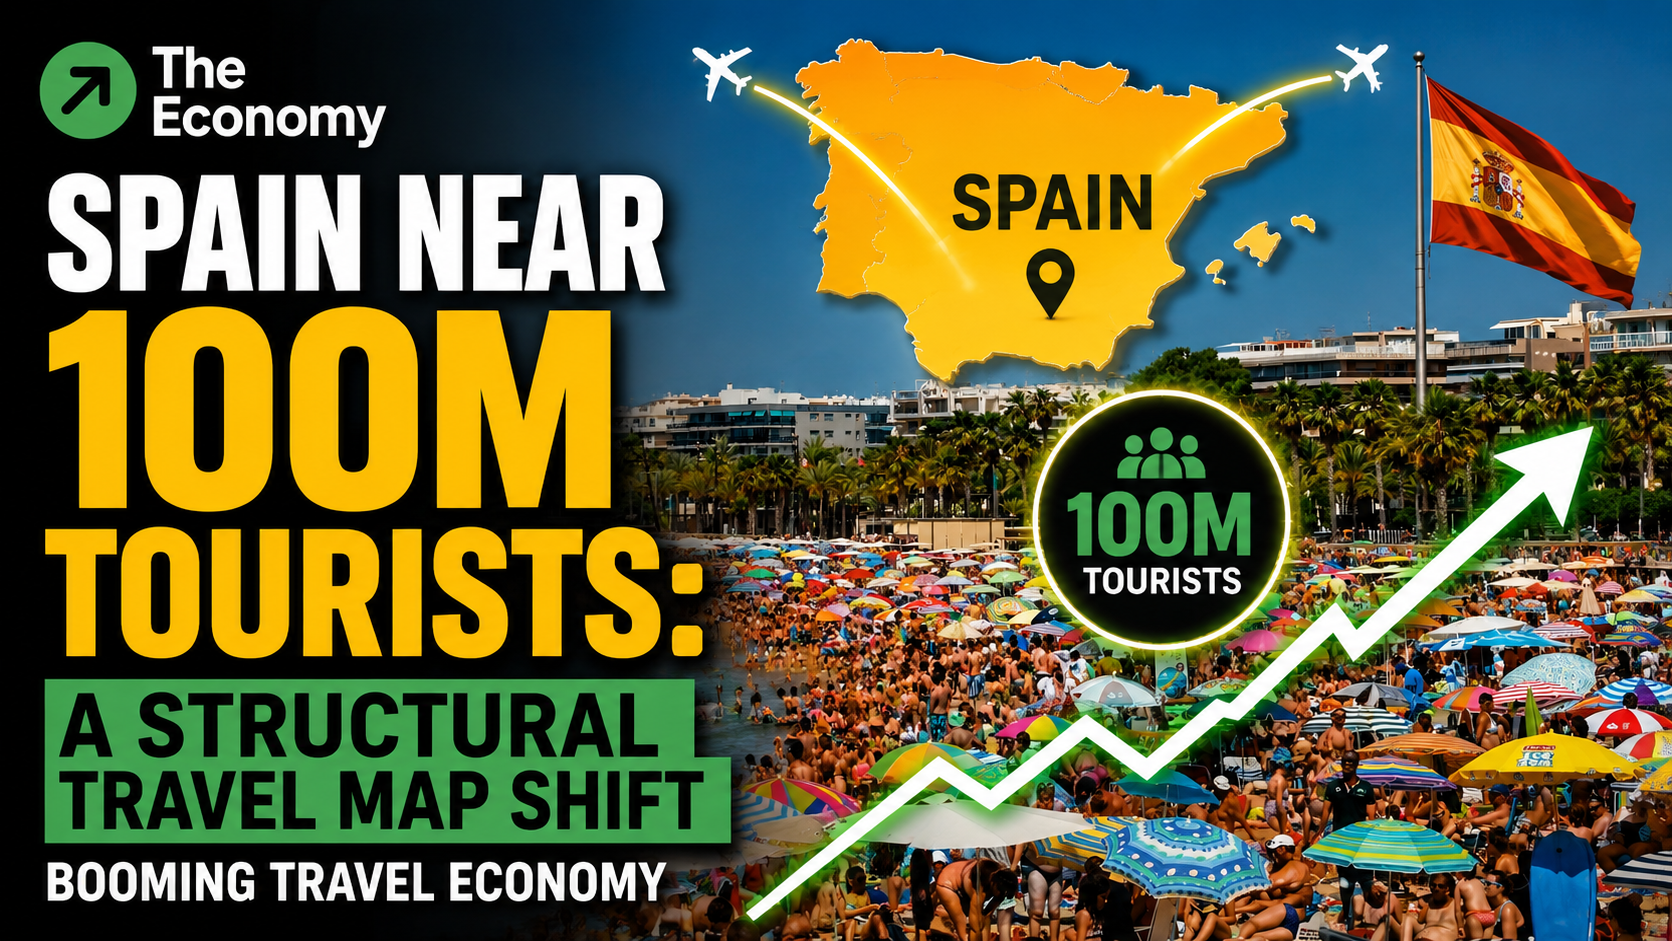
How the Iran war, Mediterranean demand consolidation, and Europe’s geopolitical stability premium are producing a structural realignment in global tourism flows that will outlast any single crisis.
Spain is approaching a number that no country has ever reached: 100 million international tourists in a single calendar year. As of the end of April 2026, with 26.6 million arrivals in the first four months alone — a 3.4% increase year-on-year — the trajectory has become, for the first time, a genuine statistical probability. The question facing the Spanish tourism industry, and the global travel market watching it, is not whether the milestone will be crossed but what it will cost, who will pay, and what it means for the structural architecture of global travel flows that produced it.
The answer to that last question is more important than the headline number. Spain’s tourism surge in 2026 is not a story about one country’s beaches and gastronomy. It is a story about how geopolitical instability in one region permanently redirects demand to another, how safety perception drives structural rather than cyclical change in travel behaviour, and why the Mediterranean is consolidating a dominance in global tourism that its infrastructure was not built to absorb.
The Record and Its Arithmetic
Spain’s National Statistics Institute (INE) confirmed that the country received 96.8 million international visitors in 2025, a new all-time record and a 3.2% increase over 2024 — which was itself a record year. International tourist spending in 2025 reached €134.7 billion, a 6.8% increase on the prior year, reflecting a shift toward higher-value, longer-duration travel by wealthier visitors spending more per trip.
In April 2026 alone, Spain received 9.1 million international tourists — a 5.2% increase year-on-year and a new monthly record. March saw 6.8 million visitors, a 3.3% rise. The United Kingdom remained the single largest source market, contributing approximately 1.7 million visitors in April, followed by France with 1.3 million and Germany with 1.2 million. Average expenditure per traveller reached €1,291 in April, with daily spending of €189 — figures that confirm the premium tourism profile driving the spending surge even as volume growth moderates relative to the pandemic-rebound years.
Exceltur, the Spanish tourism alliance, forecasts tourism GDP at €229.4 billion in 2026, representing real growth of 2.4% on 2025 levels, with tourism’s share of the national economy reaching 13.1%. The World Travel & Tourism Council projects Spain’s tourism sector will contribute €315.7 billion to GDP by 2035, representing more than 17% of the Spanish economy, with 4 million jobs — 700,000 more than the 2025 baseline.
The Iran Variable: Geopolitics as a Tourism Accelerant
Behind the headline arithmetic is a geopolitical accelerant that the industry is only beginning to quantify. The ongoing conflict involving Iran has materially redirected travel demand away from Middle Eastern and Eastern Mediterranean destinations toward European markets perceived as safe, accessible, and well-connected. Spain, Italy, and France are the primary beneficiaries of this structural diversion.
Destinations in the Middle East and eastern Mediterranean normally draw up to 181 million visitors annually. That demand does not disappear when regional instability rises — it relocates. Summer flight bookings to Spain rose 32% year-on-year as of early April 2026, while hotel searches increased 28%, according to Sojern, the digital travel intelligence platform. Cruise lines have repositioned itineraries away from Red Sea and Persian Gulf routes, with the freed capacity redeployed on Mediterranean routes where demand is demonstrably stronger and operational risks are judged to be lower.
Phocuswright’s Spain Travel Market Brief 2026 is explicit on the causality: the geopolitical diversion is functioning as “an additional demand driver” on top of an already sustained positive trajectory. But the same analysis notes a critical asymmetry — the uncertainty created by ongoing conflict will require time to reverse. Traveller confidence in Middle Eastern destinations will not recover the moment a ceasefire is announced. The structural reallocation of travel demand toward perceived-safe European destinations may outlast the conflict by years.
A Structural Realignment, Not a Cyclical Bounce
The distinction between structural and cyclical change matters enormously for destination planning, hotel investment, and airline capacity allocation. A cyclical bounce returns to baseline when the disrupting condition resolves. A structural realignment produces a new baseline.
The evidence in Spain’s case points firmly toward structural. The country’s tourism growth pre-dates the Iran conflict by several years. It pre-dates the post-pandemic revenge travel surge by more than that. Spain has consistently grown its international visitor numbers and spending through multiple economic cycles, geopolitical disruptions, and health crises, with growth rates remaining firmly positive throughout. The Iran conflict has added volume to a trend that was already established.
European Travel Commission (ETC) data confirms that Southern Europe captured 11.71% of international travel intent in early 2026, marking a significant year-on-year increase. Within that, Spain captured the largest incremental gain in global travel demand share among benchmark Mediterranean destinations, ahead of Italy and France. Catalonia led regional arrivals in April with 1.9 million visitors, followed by Andalusia at 1.5 million and the Balearic Islands at 1.4 million.
What is particularly notable is the seasonality shift. Demand is no longer concentrated in the summer peak. Visitors are spreading across spring, autumn, and winter with increasing uniformity. For businesses, that distributes revenue more evenly through the year. For residents in popular areas, it means tourism pressure is becoming nearly permanent — which is producing the political backlash that is now the dominant narrative tension in Spain’s otherwise triumphant tourism story.
Overtourism: The Structural Cost of Success
A YouGov poll in 2024 found that 28% of Spaniards held negative views of foreign tourism — the highest rate in Europe. By 2026, the political economy of Spanish tourism has become significantly more complex. In Barcelona, the city government has committed to reducing the number of tourist rental properties by 10,000 by 2028. In Mallorca and Ibiza, short-term rental listings have already been reduced by approximately half. Nearly 70% of Balearic residents have expressed support for visitor caps.
The housing dimension is the most politically charged. Rising short-term rental supply in tourism-heavy cities has contributed to housing costs that outpace local wages, concentrating the economic benefits of tourism among property owners and hospitality businesses while distributing its costs — congestion, noise, displacement — across the broader resident population. Barcelona, San Sebastián, Seville, and the Canary and Balearic Islands are all managing active political tension over tourism capacity.
The Spanish government’s response has been measured: promoting higher-value, longer-stay, off-peak travel to reduce the per-arrival footprint; investing in infrastructure for northern and inland regions that remain significantly under-touristed; and implementing regulatory frameworks for short-term rentals that attempt to balance housing markets with legitimate hospitality supply.
The tourism-resident conflict in Spain is not exceptional. It is the leading edge of a pattern that will define destination governance globally as travel volumes continue to grow. Amsterdam, Venice, Kyoto, and Dubrovnik have all enacted visitor limitations in recent years. Spain’s scale makes its experience the most important test case for how high-income democracies manage the political economy of mass tourism without destroying the economic engine that funds the services residents depend on.
Spain’s Competitive Positioning in the Global Market
Spain’s emergence as the dominant beneficiary of geopolitical demand diversion is not accidental. It reflects a set of structural advantages that cannot be easily replicated by competing destinations on a short time horizon.
Infrastructure depth is the first advantage. Spain has large international airports — Madrid Barajas and Barcelona El Prat are two of Europe’s five busiest — major cruise ports on both Atlantic and Mediterranean coasts, and a high-speed rail network that connects mainland cities efficiently. The carrying capacity of this infrastructure is sufficient to absorb demand surges that would overwhelm smaller destinations.
Destination diversification is the second advantage. Spain offers beach tourism on four distinct coastlines, major urban cultural destinations (Madrid, Barcelona, Seville, Valencia), gastronomy tourism of global reputation, skiing in the Pyrenees and Sierra Nevada, and rural agrotourism across regions including La Rioja, Extremadura, and Galicia. No single demand category saturates the country’s capacity simultaneously — though the concentration of international arrivals in a handful of regions means that regional infrastructure remains under severe pressure.
Safety perception — relative to the Middle Eastern and eastern Mediterranean alternatives — is the third and currently most powerful advantage. Spain’s measured stance on foreign conflicts has allowed it to project stability to key visitor markets (UK, Germany, France, US) while its geographic position as a Western European democracy with NATO membership provides the institutional reassurance that wary travellers increasingly demand before booking non-refundable travel.
The 100 Million Question
Spain received approximately 96.8 million international tourists in 2025. The first four months of 2026 grew 3.4% year-on-year. Applying that rate to the full 2025 baseline produces a figure of approximately 100.1 million — comfortably above the symbolic threshold. But the final 2026 total will be determined by factors not yet known: summer weather patterns, air capacity constraints, fuel costs, household budget pressure in key source markets, and the trajectory of the Middle East conflict through the peak travel season.
What can be stated with confidence is that the structural conditions producing Spain’s tourism surge are neither temporary nor self-correcting. The geopolitical demand diversion from the Middle East will persist for as long as the conflict and its reputational aftermath endure. The Mediterranean’s safety premium relative to other long-haul alternatives will compound over time as infrastructure investment follows demand. And Spain’s fundamental tourism proposition — climate, culture, cuisine, connectivity — is not subject to the same political and security risks affecting its competitors for global travel demand.
The country approaching 100 million visitors is not the same country that first broke its previous records in the mid-2010s. It is wealthier by tourism spend, more diversified by season, more invested in premium visitor profiles, and more politically aware of the social costs of the industry it depends on. Managing the next 100 million — how many come, where they go, how long they stay, and what they spend — is the most consequential economic policy question facing Spanish tourism for the remainder of the decade.
Frequently Asked Questions (FAQs)
- Q: How many tourists visited Spain in 2026?
- A: Spain received 96.8 million international tourists in 2025, a new record, and is on course to approach or exceed 100 million in 2026 based on early data showing 3.4% year-on-year growth in the first four months.
- Q: Why is Spain breaking tourism records in 2026?
- A: Spain is benefiting from a combination of its established tourism infrastructure, safety perception relative to the Middle East, and geopolitical demand diversion from conflict-affected regions redirecting travellers toward stable European destinations.
- Q: What is overtourism in Spain?
- A: Overtourism refers to the strain on infrastructure, housing markets, and quality of life in popular Spanish destinations — including Barcelona, Mallorca, and the Canary Islands — caused by visitor volumes that exceed the carrying capacity of local communities and environments.
Discover more from The Economy
Subscribe to get the latest posts sent to your email.


Travel
Blue Origin New Glenn Explosion 2026: The Multibillion-Dollar Setback Shaking Aerospace Stocks
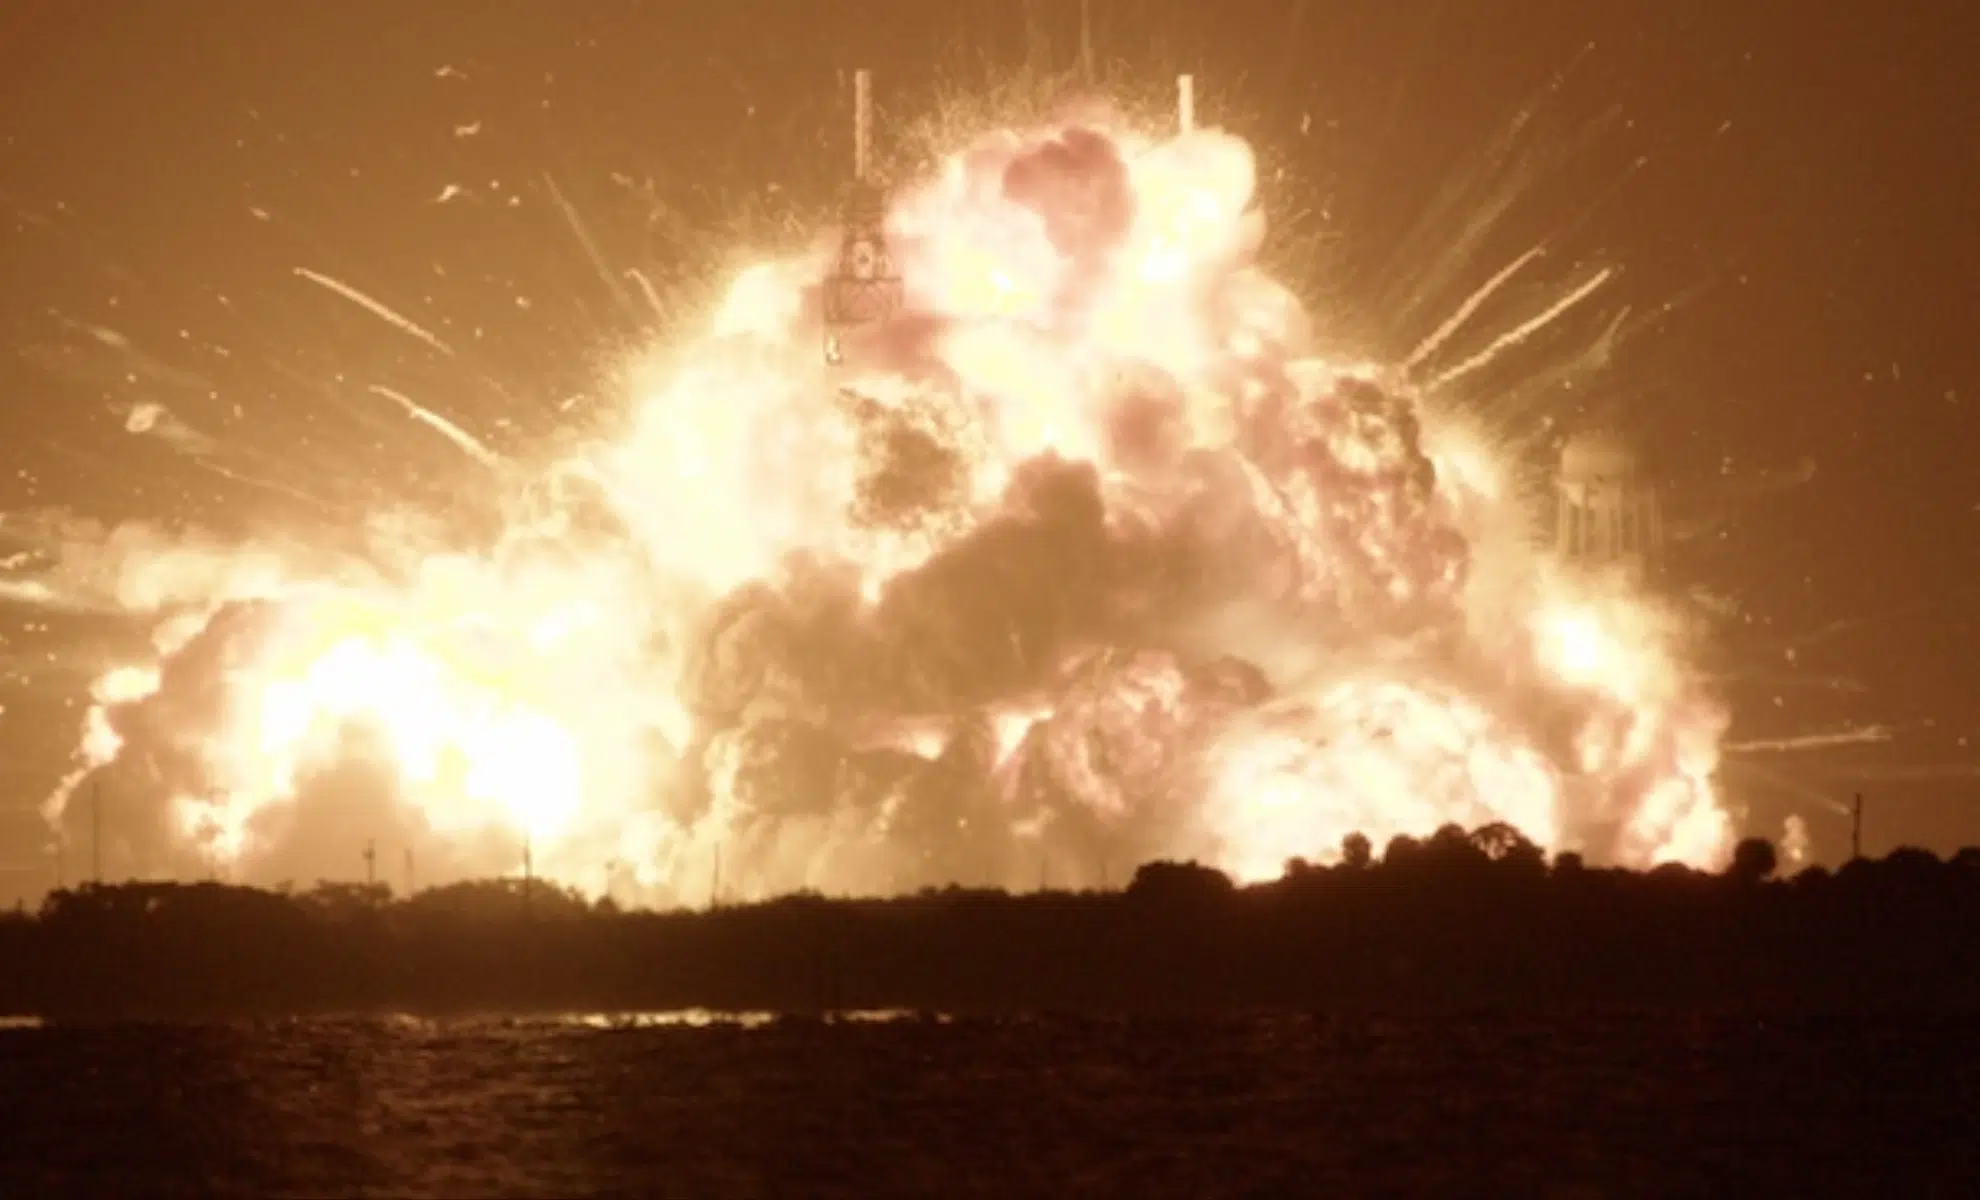
On the night of May 28, 2026, Blue Origin’s New Glenn rocket erupted into a fireball on the pad at Launch Complex 36, Cape Canaveral Space Force Station. What was supposed to be a routine static-fire test ahead of a June launch instead became one of the largest on-pad explosions in the history of American spaceflight.
For casual space enthusiasts, this was a dramatic video clip. For aerospace investors, defense contractors, and anyone with exposure to space-sector ETFs, it was something else entirely: a multibillion-dollar disruption to the commercial launch market, with ripple effects still working through NASA’s Artemis program, Amazon’s satellite ambitions, and the broader space economy investment thesis that has underpinned some of 2026’s hottest portfolios.
What Actually Happened at Launch Complex 36
Engineers were counting down to a brief hold-down firing of New Glenn’s seven methane-fueled BE-4 engines when something went catastrophically wrong at the base of the 188-foot first stage.
- The first stage was quickly engulfed in fire.
- The 86-foot upper stage began to tilt and fall as the booster below it collapsed.
- Moments later, the fully fueled vehicle’s methane and liquid oxygen ignited, destroying the rocket and severely damaging Blue Origin’s only operational New Glenn pad.
No injuries were reported. Blue Origin confirmed on social media that all personnel were accounted for, and founder Jeff Bezos publicly pledged that the company would rebuild “whatever needs rebuilding.” A preliminary investigation later pointed to a failure in one of the rocket’s BE-4 engines as the root cause.
It’s worth noting this wasn’t New Glenn’s first stumble. The rocket’s third flight in April 2026 had already drawn FAA scrutiny after its second stage failed to reach its intended orbit, even as the reused first-stage booster nailed its droneship landing. May’s pad explosion piled a second, far more severe failure on top of an already shaky return-to-flight campaign.
A preliminary investigation attributed the May 28, 2026 explosion — which occurred during a pre-launch static-fire test at Cape Canaveral’s Launch Complex 36 — to a failure in one of New Glenn’s BE-4 first-stage engines. No injuries were reported, but the vehicle was destroyed and Blue Origin’s only New Glenn launch pad was severely damaged.
Why This Is a Financial Story, Not Just a Space Story
This is where competitor coverage tends to stop at “big rocket goes boom.” The more important angle — and the one with real CPC value in finance and investing verticals — is what happens next to capital, contracts, and insurance markets.
1. Blue Origin has exactly one New Glenn pad. Unlike SpaceX, which can shift Falcon operations between Kennedy Space Center’s Pad 39A and Vandenberg’s SLC-4E, Blue Origin has no backup launch site for its heavy-lift rocket. That single point of failure means every delayed launch is a delayed revenue event — for Blue Origin, and for every downstream customer waiting on a manifest slot.
2. Amazon’s Leo (Kuiper) network takes a direct hit. The New Glenn flight scheduled for June was slated to carry a batch of Amazon’s Leo broadband satellites — Amazon’s answer to Starlink. Amazon has contracted Blue Origin for 24 total launches. Every week New Glenn sits grounded is a week Amazon’s satellite constellation timeline slips further behind SpaceX’s head start, a dynamic that matters directly to anyone modeling Amazon’s broadband and logistics capital expenditure against near-term revenue.
3. Artemis lunar timelines are now a live question mark. NASA had just awarded Blue Origin contracts covering a fall Blue Moon Mark 1 lander mission and future crewed lunar lander flights under Artemis. NASA’s own leadership acknowledged the anomaly would require assessment of “near-term mission impacts” to Artemis and the broader Moon Base program. Any slip in lunar lander readiness has second-order consequences for the primes, subcontractors, and defense-adjacent suppliers that feed into the Artemis supply chain — names that show up in most aerospace and defense sector funds.
4. Insurance and reinsurance markets are already repricing. Launch-vehicle insurance is a specialized, thinly traded market. A pad-destroying anomaly of this scale — comparable in visibility to the September 2016 SpaceX Falcon 9 pad explosion, after which the pad was out of commission for more than a year — tends to push underwriters toward higher premiums across the entire commercial launch sector, not just for Blue Origin. That’s a cost that eventually shows up in every launch contract, including government ones funded by taxpayers.
The Investor Playbook: What Actually Moves on This News
For readers searching “how does this affect my portfolio,” here’s the practical breakdown:
- Publicly traded space-sector ETFs and space-adjacent industrials (engine suppliers, composite materials firms, ground-systems contractors) often see short-term volatility around anomalies like this, even when the affected company itself is privately held — because the market reads it as a proxy for sector-wide launch risk.
- Amazon (AMZN) faces a modest but real narrative headwind on its satellite broadband buildout, a storyline that retirement-focused and growth-focused investors alike should track heading into Amazon’s next earnings cycle.
- Legacy aerospace primes with diversified launch and defense portfolios historically absorb single-vendor anomalies better than pure-play space startups — a data point worth weighing for anyone comparing concentrated space-sector plays against diversified aerospace and defense holdings.
- Investors evaluating exposure here should treat this as a volatility event, not a thesis-breaker — but volatility events are exactly the moments when working with a fiduciary financial advisor who understands sector-specific risk (rather than reacting to headlines alone) tends to separate disciplined portfolios from reactive ones.
What Competitors Are Missing
Most outlets covering this story stopped at the dramatic footage and a same-day statement from Bezos. Few have connected:
- The single-pad vulnerability as a structural risk factor unique to Blue Origin versus its multi-pad competitors.
- The downstream Amazon Leo timeline math against SpaceX’s existing Starlink lead.
- The insurance market repricing that will quietly raise costs across the entire launch industry, government and commercial alike.
That’s the analysis that actually helps a reader — investor, policy watcher, or industry professional — understand what this event means, rather than just what it looked like.
The Road Ahead
Blue Origin has publicly committed to rebuilding Launch Complex 36, but heavy-lift pad reconstruction historically takes many months to over a year based on comparable incidents. Key dates and developments to watch:
- The final FAA/Blue Origin root-cause investigation report.
- Any revised Amazon Leo launch manifest reallocating satellites to other providers (including potentially SpaceX, ULA, or Arianespace) to hedge the delay.
- NASA’s updated Artemis lunar lander schedule, expected as the agency assesses mission impacts.
- Whether Blue Origin adds a second New Glenn pad — a project already reportedly under consideration — to eliminate the single-point-of-failure risk this explosion exposed.
Until those milestones land, treat every “New Glenn returns to flight” headline as provisional. The financial story here isn’t the fireball — it’s the multi-year capital and contract reshuffling now underway across the commercial launch industry.
Discover more from The Economy
Subscribe to get the latest posts sent to your email.
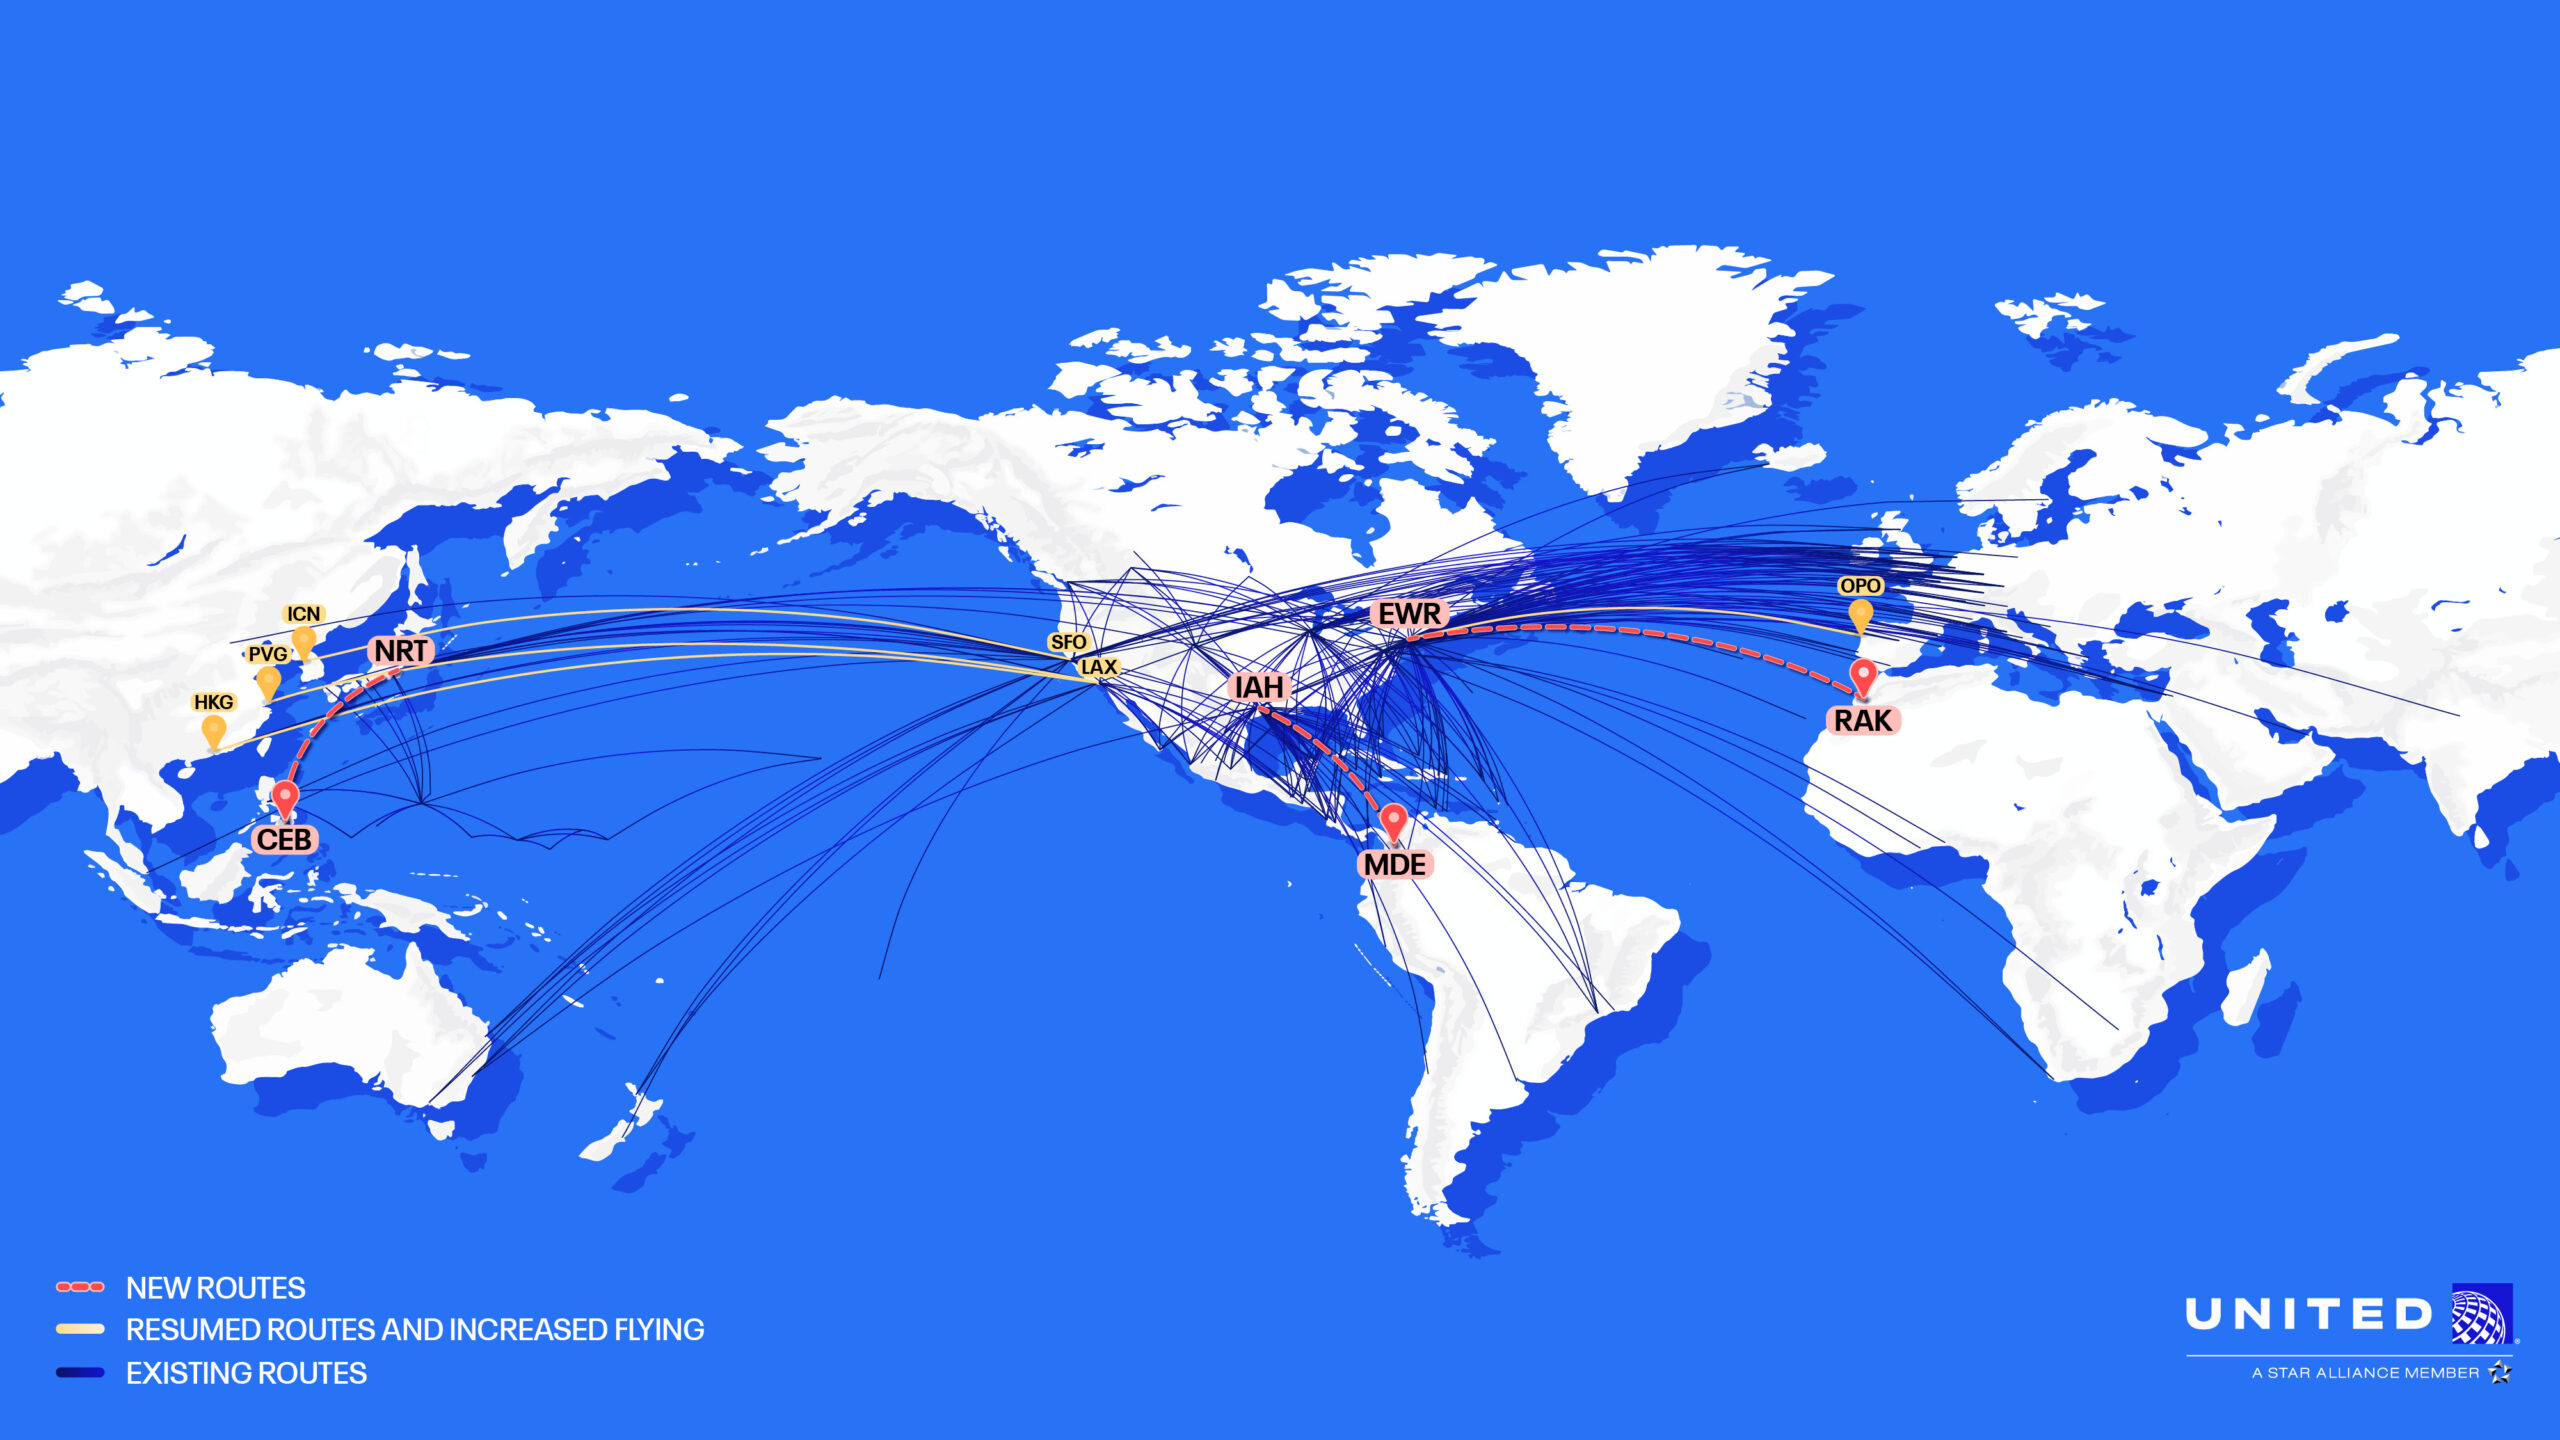
United Airlines announced the largest international network expansion in its history on August 25, 2026: 10 new international cities plus three additional routes between existing network points, launching between March and June 2027. Seven of the ten new destinations currently have no nonstop US service from any carrier, and the expansion leans heavily on United’s new Airbus A321XLR — a long-range narrowbody that lets the airline serve smaller, lower-demand markets across southern Europe and beyond that wouldn’t support a widebody aircraft.
Full Route List: New Destinations & Existing-Route Additions
| New Destination | Hub | Region | Nonstop US Exclusivity |
|---|---|---|---|
| Toulouse, France | Newark (EWR) | Europe | Only US nonstop |
| Marseille, France | Newark (EWR) | Europe | Only US nonstop |
| Luxembourg City, Luxembourg | Newark (EWR) | Europe | Only US nonstop (year-round) |
| Ibiza, Spain | Newark (EWR) | Europe | Only US nonstop |
| Valencia, Spain | Newark (EWR) | Europe | Only US nonstop |
| Ljubljana, Slovenia | Newark (EWR) | Europe | Only US nonstop |
| Terceira, Portugal (Azores) | Newark (EWR) | Europe | Only US nonstop |
| Olbia, Sardinia (Italy) | — | Europe | Shared with other carriers |
| Catania, Sicily (Italy) | — | Europe | Shared with other carriers |
| Okinawa, Japan | San Francisco (SFO) | Asia | New nonstop |
| Existing-Route Additions (Not New Cities) | Route | Launch |
|---|---|---|
| Denver – Paris | New daily nonstop | Starting May 27, 2027 |
| Washington Dulles – Milan | New nonstop | Summer 2027 |
| Los Angeles – Osaka | New nonstop (complements existing SFO–Osaka) | Summer 2027 |
| San Francisco – Tel Aviv | Restart | March 28, 2027 (3x weekly) |
| Returning 2026 Routes for Summer 2027 | Hub |
|---|---|
| Split, Croatia | Newark/New York |
| Bari, Italy | Newark/New York |
| Glasgow, Scotland | Newark/New York |
| Santiago de Compostela, Spain | Newark/New York |
Sources: United Airlines official press release (PRNewswire, Aug. 25, 2026), Fodor’s, The Points Guy, CBS News, CNBC — all Aug. 25–Sept. 2, 2026.
Deep Dive: Reading United’s Route Strategy Beyond the Headline List
The A321XLR Is the Enabling Technology Behind This Entire Expansion
The single most important detail behind this announcement isn’t any specific city — it’s the aircraft making the routes economically viable. United’s new “Born to Explore” Airbus A321XLR is a long-range, single-aisle (narrowbody) jet that can fly widebody-caliber distances with a smaller, lower-capacity cabin. That distinction matters enormously for route economics: destinations like Toulouse, Marseille, Ibiza, Valencia, and Luxembourg City generate enough point-to-point demand to fill a 150–200 seat narrowbody profitably, but likely couldn’t support a 250–300+ seat widebody aircraft on a sustainable basis. The A321XLR is what allows United to open genuinely niche European markets that were previously uneconomical for any US carrier to serve nonstop — which is also why seven of the ten new cities have zero existing nonstop US competition.
United took delivery of its first A321XLR in June 2026, out of a total order of 50 aircraft, with additional deliveries continuing over the coming months and years. The aircraft is initially flying select domestic routes before transitioning to international service — a phased rollout that gives United time to build pilot and crew familiarity before the more complex international routes launch in spring 2027.
Why Southern Europe, Specifically, and Why Now
United’s chief network planner Patrick Quayle has been explicit that this expansion doubles down on a proven regional pattern: southern Europe. The new routes to Marseille and Toulouse (France), Valencia and Ibiza (Spain), and Olbia and Catania (Italy) all reflect a deliberate bet that leisure demand to southern European coastal and cultural destinations has outperformed alternative regions the airline has tested. That’s a lesson learned the hard way: United has explicitly confirmed it will not resume routes to Bergen, Norway, or Stockholm, Sweden — both previously launched and subsequently canceled — with Quayle noting plainly that neither performed well. Similarly, United’s 2025 Dakar, Senegal route will not return in 2027, another data point in the airline’s ongoing process of testing and pruning based on real load-factor performance rather than route-map ambition alone.
The Newark Hub Is the Biggest Winner
Of the ten new destinations, eight route out of United’s Newark Liberty International Airport (EWR) hub — a concentration that reinforces Newark’s role as United’s primary transatlantic gateway, distinct from its other international hubs at Washington Dulles, Chicago, Denver, and San Francisco. This hub concentration has logistical implications for travelers: connections through Newark to reach these new niche European destinations will generally be more direct and frequent than routing through United’s other hubs, a detail worth factoring into any award-ticket or itinerary-planning strategy built around this expansion.

The Milan Route Fills a Notable Network Gap
The new Washington Dulles–Milan nonstop is worth flagging separately from the leisure-focused southern Europe additions: United executives specifically noted that Milan was the largest international market the airline did not already serve nonstop from its Dulles hub — meaning this addition closes a gap in United’s business-and-finance-market coverage (Milan being Italy’s financial capital) rather than chasing new leisure demand, a different strategic rationale from most of the other additions on this list.
The Trans-Pacific Competitive Backdrop
United’s Okinawa addition and the broader Asia-Pacific push arrive against an intensifying competitive backdrop: Delta Air Lines’ president has publicly stated the airline wants to challenge United’s dominance on trans-Pacific routes specifically, and Delta has itself added new service to Tokyo-Narita and Manila in 2026 while launching a previously announced Los Angeles–Hong Kong route. United’s Los Angeles–Osaka addition, layered on top of its existing San Francisco–Osaka service, reads as a direct response to this competitive pressure — reinforcing United’s West Coast Japan network at a moment when Delta is actively contesting the same trans-Pacific corridor.
United Airlines announced 10 new international cities for 2027 — including Ibiza, Luxembourg City, Ljubljana, and Okinawa — in its largest-ever network expansion. Seven of the ten cities have no existing nonstop US service, with most routes launching from Newark using United’s new A321XLR aircraft between March and June 2027.
What “Largest Expansion in Company History” Actually Means in Context
United frames this as its largest international network expansion ever, and the underlying numbers support that framing at face value: 10 new cities plus 3 additional routes on existing city-pairs, building on a base of 58 international destinations added since 2017 and a current international network exceeding 160 destinations. CEO Scott Kirby has attributed the scale of this particular expansion partly to aircraft manufacturer supply catching up after prior years of production constraints — a subtler point worth noting given how much of the broader travel and aerospace sector has been shaped by exactly these kinds of supply-chain bottlenecks in recent years.
Actionable Takeaways for Travelers
- Book early for the seven exclusive-nonstop markets if a specific niche European destination is on your list. Routes like Ibiza, Valencia, Luxembourg City, and Ljubljana have no competing nonstop US service, meaning United controls pricing on these specific city-pairs — award availability and fare sales are likely to be less predictable than on competitive routes.
- Note the seasonal end dates before booking travel outside the summer window. Most of the new destinations run seasonal service ending in September or October 2027; only Luxembourg City is confirmed as year-round — plan accordingly if you’re hoping to use these routes outside peak summer months.
- Route through Newark for the fastest connections to most new destinations. With eight of ten new cities based at EWR, Newark-originating or Newark-connecting itineraries will generally offer more direct scheduling than alternative United hubs.
- Watch for MileagePlus award chart availability closer to the March–June 2027 launch windows. New routes often carry more generous award availability in their first one to two seasons as United works to build initial demand and brand awareness for previously unserved markets.
- Consider the San Francisco–Tel Aviv restart’s limited frequency when planning around it. At three times weekly, this route requires more flexible trip-date planning than a daily service would, despite United’s claim of offering the most business-class seats of any carrier on the city pair.
Frequently Asked Questions
What new international routes is United Airlines adding in 2027?
United is adding 10 new international cities — Toulouse, Marseille, Luxembourg City, Ibiza, Valencia, Terceira, Ljubljana, Olbia, Catania, and Okinawa — plus new nonstop service on three existing city pairs (Denver–Paris, Washington Dulles–Milan, Los Angeles–Osaka) and a restart of San Francisco–Tel Aviv, all launching between March and June 2027.
Which United Airlines routes have no nonstop competition from other US airlines? Seven of United’s ten new destinations — Toulouse, Marseille, Luxembourg City, Ibiza, Valencia, Ljubljana, and Terceira — currently have no nonstop US service from any carrier, making United the sole nonstop option on those specific routes.
What aircraft is United using for its 2027 route expansion?
United’s new Airbus A321XLR, a long-range narrowbody aircraft that took its first delivery in June 2026 out of a total order of 50 planes, enables the airline to profitably serve smaller international markets that couldn’t support a widebody aircraft, and underpins most of the new southern European route additions.
When do United’s new 2027 international routes start?
The new routes begin rolling out as early as March 2027, with the Denver–Paris route starting May 27, 2027, and most other new seasonal European destinations launching between spring and early summer 2027, typically running through September or October.
Discover more from The Economy
Subscribe to get the latest posts sent to your email.
Travel Economy
The Rise of Green Aviation: Balancing High Fuel Prices with Sustainable Infrastructure

Key Takeaways
- Sustainable aviation fuel (SAF) prices in Europe surged to an average of $2,830 per ton in Q2 2026 — up 31% from the year’s average and roughly double the price of conventional jet fuel.
- IATA forecasts average 2026 jet fuel prices of $152 per barrel, almost 70% higher than the prior year, driven by the Strait of Hormuz closure — a shock that has also dragged SAF prices higher since the two remain closely linked.
- SAF still represents well under 1% of global jet fuel use in 2026, despite years of airline net-zero commitments and offtake agreements.
- China’s SAF export quota (1.38 million tonnes/year) is large enough to cover all of Europe’s expected 2026 SAF demand, creating a potential price-relief valve as EU antidumping duties remain absent.
- Corporate demand — not airline economics — is increasingly financing SAF scale-up, via book-and-claim mechanisms that let companies like Google fund SAF without physically receiving the fuel.
Two Fuel Crises Happening at Once
2026 has delivered a rare double shock to aviation’s cost base: conventional jet fuel and its “green” alternative have both spiked simultaneously, and for the same underlying reason. The global energy landscape changed dramatically at the end of February 2026 when air strikes on Iran and subsequent retaliation effectively shut the Strait of Hormuz to commercial shipping, triggering the largest supply disruption in the history of the global oil market — around 25% of global crude oil flows through this narrow waterway, together with 35% of liquefied petroleum gas, 7% of liquefied natural gas and refined products, and 19% of chemicals. IATA now forecasts an average jet fuel price of $152 per barrel in 2026, almost 70% higher than the prior year.
Crucially, this shock did not spare sustainable aviation fuel — it made SAF’s cost problem worse, not better. The closure of the Strait of Hormuz has increased SAF price volatility in 2026: European prices surged to an average of $2,830 per ton, or $8.58 per gallon, in the second quarter of 2026 — up 31% from the year’s average, and roughly double the price of conventional jet fuel in Northwest Europe, which has averaged $1,404 per ton since the Iran war began.
Why SAF and Oil Prices Move Together
Airlines remain exposed to fuel price volatility because SAF prices are still strongly linked to oil markets until production and supply can increase significantly — meaning the “green premium” narrows or widens depending on where conventional jet fuel sits, rather than SAF trading as an independent, insulated market. This linkage is the central structural weakness of the current green-aviation transition: SAF was meant to offer price stability alongside emissions reduction, but in 2026 it has instead amplified the industry’s exposure to the same Middle East volatility affecting conventional fuel.
The Scale Problem: Still Under 1% of Global Fuel Use
Despite years of policy support and corporate commitments, SAF’s actual market penetration remains minimal. As of 2024, SAF production represented only 0.53% of global jet fuel use, and SAF accounted for just 0.6% of total jet fuel in 2025. SAF currently represents less than 1% of global aviation fuel use, and it is several times more expensive than conventional aviation fuel because of more expensive feedstocks, still-developing production technologies, lack of physical and market infrastructure, and high upfront investment needs.
The cost gap remains stark even by the industry’s own most optimistic accounting. Assuming a 75% carbon intensity reduction, willingness-to-pay research translates into a green premium of $2.34 to $3.93 per gallon, putting the resulting SAF price range at $9.40 to $10.96 per gallon. The European Union Aviation Safety Agency estimated the average production cost of SAF in 2024 ranged from €1,461 per tonne for biofuels to €7,695 per tonne for e-fuels — meaning even the cheapest SAF pathway costs roughly double conventional jet fuel, before Middle East-driven volatility is even factored in.
The Policy Architecture: Mandates Are Tightening
Regulation, rather than pure market economics, remains the primary force pulling SAF demand forward. The EU’s ReFuelEU Aviation Regulation has set a minimum supply mandate for SAF starting at 2% in 2025 and increasing to 70% by 2050, with a sub-mandate specifically for synthetic e-fuels. In the US, federal support operates through direct financial incentives: the Inflation Reduction Act’s Section 13203 established a SAF tax credit worth a minimum of $1.25 per gallon, while the FAA administers Fueling Aviation’s Sustainable Transition (FAST) grants for SAF-related infrastructure investment.
The Sustainable Aviation Fuel Grand Challenge, a multi-agency US federal initiative, targets expanding domestic SAF consumption to 3 billion gallons by 2030 and 35 billion gallons by 2050, while achieving at least a 50% reduction in lifecycle emissions. These are ambitious targets relative to a market currently supplying well under 1% of global demand — underscoring just how much production capacity still needs to be built.
A New Financing Model: Corporate Book-and-Claim
Perhaps the most significant 2026 development is not a price trend but a financing innovation that decouples SAF demand from airline balance sheets. On June 5, 2026, Google and American Airlines announced a three-year agreement under which Google will purchase sustainable aviation fuel certificates associated with 35 million gallons of SAF — American takes physical delivery of the fuel at Chicago O’Hare, while Google receives the emissions attributes, with the arrangement relying on book-and-claim accounting, in which the physical fuel and the environmental attribute are legally separated and transferred to different parties.
This model matters enormously for the sector’s investment case: it means large corporate buyers with strong balance sheets and climate commitments — not fuel-margin-constrained airlines — can become the primary demand signal funding SAF production scale-up, potentially accelerating capacity growth faster than airline offtake agreements alone would achieve.
Comparative Table: Conventional Jet Fuel vs. SAF, 2026
| Metric | Conventional Jet Fuel | Sustainable Aviation Fuel (SAF) |
|---|---|---|
| 2026 average price (Europe, Q2) | ~$1,404/ton | ~$2,830/ton (up 31% YTD) |
| Share of global aviation fuel use | ~99%+ | <1% |
| Price driver | Direct crude oil/geopolitical exposure | Linked to oil markets + feedstock/production constraints |
| Primary demand driver | Operational necessity | Regulatory mandates (ReFuelEU) + corporate book-and-claim deals |
| 2026 outlook | Elevated but potentially easing with Hormuz resolution | Expected to remain 2-3x conventional fuel price through 2030 |
Why It Matters: A Potential Relief Valve From China
One under-covered dynamic could meaningfully affect SAF economics for European carriers specifically. Additional price relief for European markets could come from Chinese SAF imports, as the EU currently has no antidumping duties on Chinese sustainable aviation fuel, potentially creating downward pressure on prices as supply increases. China’s SAF export quota is 1.38 million tonnes per year, which would be enough to cover all of Europe’s expected 1.37 million tonnes of SAF demand in 2026. If that trade channel opens further, it would represent one of the more significant near-term SAF price catalysts available to European carriers — though it also raises the same trade-policy tensions playing out across other green-technology sectors between China and Western markets.
What to Do Next
- Track Strait of Hormuz resolution progress as a direct SAF price catalyst, given the demonstrated linkage between conventional oil shocks and SAF pricing in 2026.
- Monitor EU antidumping-duty decisions on Chinese SAF imports — this single trade-policy variable could materially reprice the European SAF market given China’s quota capacity matching regional demand.
- Favour airlines and logistics firms engaging in book-and-claim corporate partnerships over those relying solely on direct offtake agreements, given the more resilient demand base corporate buyers provide.
- Treat SAF’s sub-1% market share as the realistic near-term baseline, not a transitional anomaly — production scale-up constraints mean the cost premium is likely to persist through at least 2030 under most industry forecasts.
- Watch US SAF tax credit and FAST grant funding levels as a leading indicator of domestic production capacity growth relative to the EU’s regulatory-mandate-driven approach.
FAQ
Why did sustainable aviation fuel prices rise even more sharply than conventional jet fuel in 2026?
SAF prices in Europe surged 31% in Q2 2026, roughly double conventional jet fuel prices, because SAF remains strongly linked to oil markets even as it also faces its own separate feedstock and production-capacity constraints — meaning it absorbed both the oil shock and its own structural cost premium simultaneously.
What percentage of global aviation fuel is currently sustainable aviation fuel?
SAF currently represents less than 1% of global aviation fuel use, despite years of airline net-zero pledges and regulatory mandates.
How are companies funding SAF development without airlines bearing the full cost? Book-and-claim arrangements, such as Google’s 2026 deal with American Airlines for certificates tied to 35 million gallons of SAF, let corporate buyers purchase the environmental attributes of SAF separately from the physical fuel — allowing non-airline companies to fund production scale-up directly.
Discover more from The Economy
Subscribe to get the latest posts sent to your email.

Solar Panel Installation Cost in 2026: Why the Math Changed Overnight

Business Insurance: What Coverage You Actually Need and What It Costs in 2026

Auto Insurance Quotes: How to Get the Lowest Rate Without Losing Coverage

Huntington Online Banking: Full Features, Fees, and How It Compares in 2026

Apply for a Bank Account Online: What You Need and How Long It Actually Takes

World’s Largest Economies: Ranking the Top Global Powers

Business Loan: A Complete 2026 Guide to Rates, Types, and Qualifying

Fast Invoice Factoring: How to Turn Unpaid Invoices Into Cash Within 24 Hours

Investment Banking Services: What They Cost and How to Choose the Right Firm in 2026

Structured Settlement Loan: What “Cash Now” Offers Actually Cost You

DUI Attorney: Why Your First Call After an Arrest Should Never Be to the Court

Personal Injury Lawyer: A Complete Guide to Filing Your Claim in 2026

Commercial Vehicle Accident Lawyer: Holding Companies Accountable Beyond the Driver

Inside the White House Feud: How Trump’s Allies Are Painting Anthropic’s Dario Amodei as the Face of ‘AI Doomerism’

Top 30 Stocks for Investment in PSX for Massive ROI in 2026

SpaceX Starship Flight 14: First Orbital Attempt & Starlink V3 Launch Explained

Oil Prices Break $100 in 2026: Middle East Conflict & Energy Markets

Fidelity Investments Review 2026: SPAXX Yields & Zero-Fee Funds

AI Chip Stocks 2026: The Best Semiconductor Investments Beyond Marvell

BRICS+ Cross-Border Payments 2026: Interoperability Explained

Tween Back-to-School Trends 2026: What’s Driving the $85B Season

10-Year Treasury Yield Hits 4.80%: What It Means for Rates & Portfolios

Shein Clothes Quality & Safety in 2026: What Lab Tests Show

China’s US$10.8 Billion Trade Shortcut: Why the Pinglu Canal Matters

MRVL Earnings 2026: Why Marvell Sank Despite Beating Estimates

IMF & World Bank 2026 Global Economic Outlook: Growth, Inflation, Debt

Middle East War Economics 2026: Oil Prices & Energy Markets

High-CPM Finance Niches 2026: Publisher Monetization Blueprint
-

 Markets & Finance9 months ago
Top 15 Stocks for Investment in 2026 in PSX: Your Complete Guide to Pakistan’s Best Investment Opportunities
-

 Analysis7 months ago
Johor’s Investment Boom: The Hidden Costs Behind Malaysia’s Most Ambitious Economic Surge
-

 Analysis7 months ago
Top 10 Stocks for Investment in PSX for Quick Returns in 2026
-

 Banks8 months ago
Best Investments in Pakistan 2026: Top 10 Low-Price Shares and Long-Term Picks for the PSX
-

 Analysis8 months ago
Brazil’s Rare Earth Race: US, EU, and China Compete for Critical Minerals as Tensions Rise
-

 Investment9 months ago
Top 10 Mutual Fund Managers in Pakistan for Investment in 2026: A Comprehensive Guide for Optimal Returns
-

 Global Economy9 months ago
15 Most Lucrative Sectors for Investment in Pakistan: A 2025 Data-Driven Analysis
-

 Global Economy9 months ago
Pakistan’s Export Goldmine: 10 Game-Changing Markets Where Pakistani Businesses Are Winning Big in 2025