
Global Economy
Lagarde: ECB Ready to Raise Rates ‘At Any Meeting’ as Iran War Fuels Inflation

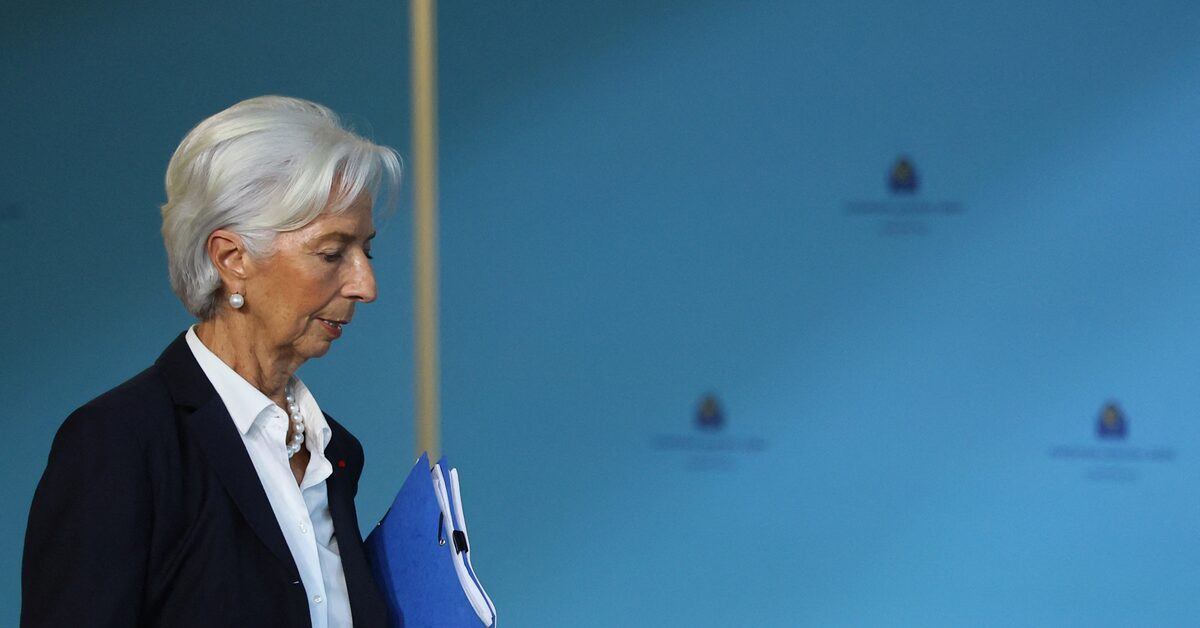
The central bank that spent two years engineering the perfect soft landing is now watching the runway catch fire.
Speaking at the ECB Watchers Conference in Frankfurt on Wednesday, European Central Bank President Christine Lagarde delivered the most explicit hawkish signal Frankfurt has fired in nearly four years: “We are prepared, if appropriate, to make changes to our policy at any meeting.” The Irish Times Six short words. Enormous implications.
The timing is not accidental. Soaring energy costs brought on by the conflict in the Middle East are stoking fears of another inflation spike like the one four years ago, with Bundesbank chief Joachim Nagel and others signalling borrowing costs may need to be lifted as soon as April if the price outlook sours further. The Irish Times Lagarde’s carefully chosen phrase — “at any meeting” — is central-bank language for: we are not waiting for a scheduled window; the next move could come at any of the eight annual gatherings on our calendar. Markets heard her clearly.
The immediate market reaction confirmed it. ECB-dated OIS now price 16 basis points of hikes through April — up from 14.5bp before the sources update hit the wires — while Bloomberg reported the possibility of a rate hike in April, and Reuters sources suggested April was too early but June increasingly viable. Marketnews The euro, which had been softening all week amid risk-aversion, traded at 1.1457 against the greenback — down from 1.1778 before U.S.-Israeli attacks on Iran began — making imports, including energy, more expensive for buyers in the eurozone. Morningstar European equities absorbed a fresh leg lower, and German Bund yields climbed as traders repriced the front end.
This is not the Christine Lagarde who, just weeks ago, was serenely describing Frankfurt’s policy stance as being in a “good place.” That phrase — her mantra through six consecutive hold decisions — has now been retired, deliberately. “We are starting from a good base, so I’m not saying we are in a good place — we are both well-positioned and well-equipped to deal with the development of a major shock that is unfolding,” CNBC she told reporters after the March 19 Governing Council decision. The language shift is not cosmetic. In the theology of ECB communications, “good place” was a dovish comfort signal; its removal is an act of institutional vigilance.
The Iran Shock: Why the ECB’s Inflation Calculus Collapsed Overnight
To understand how dramatically the picture shifted, consider the ECB’s own projections. At the December 2025 meeting, staff projected headline inflation averaging 1.9% in 2026, 1.8% in 2027, and 2.0% in 2028 — a Goldilocks path that seemed to confirm the ECB could sit comfortably at its neutral 2% deposit rate indefinitely. European Central Bank That serenity lasted exactly eleven weeks.
U.S.-Israeli attacks on Iran began in late February 2026 Global Banking and Finance, and by the time the Governing Council convened on March 19, the energy landscape had been redrawn. Brent crude closed at $90 per barrel on the technical cut-off date of March 11 — yet by the meeting itself, it was trading in a range of $112–$115, having touched $119 during the session. The Irish Times Natural gas prices followed a similar trajectory. The ECB’s own updated staff projections incorporated this shock, and the numbers are stark.
The ECB’s latest staff projections show inflation averaging 2.6% in 2026, before easing to 2.0% in 2027 and 2.1% in 2028 Euronews — a revision of more than half a percentage point for this year alone, driven entirely by energy. But the baseline is already obsolete. In a more adverse scenario — involving stronger and longer-lasting disruptions to oil and gas supply through the Strait of Hormuz — inflation could rise to 3.5% in 2026. In a severe scenario, where energy prices remain elevated for longer, headline inflation could reach as high as 4.4% in 2026. Euronews
To put that last number in context: eurozone inflation has not touched 4% since the tail-end of the post-Ukraine energy crisis. The ECB would be back in emergency territory before summer.
Growth, meanwhile, has been revised sharply lower. The ECB expects GDP growth of just 0.9% in 2026, 1.3% in 2027, and 1.4% in 2028 TRADING ECONOMICS — essentially stagnation-adjacent for the current year. The stagflationary cocktail that haunted the 2022–2023 cycle is back on the table.
‘Monitor Closely’: Decoding the ECB’s Institutional Vocabulary
Inside the ECB, language carries the weight of precedent. Officials and seasoned ECB-watchers know that certain phrases function as coded escalation signals — a vocabulary that stretches back decades and is never used carelessly.
The fact that the well-known phrase “monitor closely” has returned to ECB communications is a clear signal that the central bank has shifted to a higher alert. In the past, the term “monitor closely” had always been a sign of high alertness — the time it was used was during the short-lived banking tensions in March 2023 and before in 2022. In the distant past, “monitor closely” was followed by “vigilance” in the run-up to rate hikes. ING THINK
That sequencing matters enormously. The 2022 cycle — when the ECB spent months saying it was “monitoring” inflation before eventually being forced into the most aggressive tightening campaign in its history — is the institutional ghost Frankfurt is desperate not to repeat. “In those four years, we have learned,” Lagarde said, noting that interest rates are now higher, inflation lower, and the labour market less overheated than four years ago, when the economy was re-emerging from the COVID-19 pandemic. “I think we also understand better the mechanism of the pass-through into indirect and second-round effects.” Global Banking and Finance
That self-aware acknowledgment of the 2022 policy mistake is the most important sentence Lagarde has delivered in years. It signals that the ECB’s reaction function has fundamentally changed: the central bank will not let second-round effects embed before it acts. “We will not act before we have sufficient information on the size and persistence of the shock and its propagation,” she said at the ECB Watchers Conference. “But we will not be paralysed by hesitation: our commitment to delivering 2% inflation over the medium term is unconditional.” The Irish Times
What Markets Are Pricing: Hike Paths, Bond Yields, and the April Trigger
The market reaction to the ECB’s hawkish pivot has been swift and instructive. Traders are pricing in two or three rate hikes by December, even as most economists still see no change, betting that the ECB would not tolerate another war-fuelled spike in inflation after being stung by Russia’s 2022 invasion of Ukraine. Global Banking and Finance
The April 29–30 meeting is now in live play. ECB policymakers would be ready to raise interest rates as soon as their next meeting should fallout from the war in Iran push inflation too far above target, according to people familiar with the situation. While nothing has been decided yet and a later date may be more appropriate, factors including signs of second-round effects could trigger such a move at the April 29–30 gathering. Bloomberg
The oil price threshold matters. A rate rise at the April meeting would require an even bigger surge in energy prices, with one of the sources mentioning a $200 per barrel oil price as a potential trigger. Benchmark Brent crude touched $119 per barrel on March 19. The ECB itself said that a “severe” scenario under which crude peaks at almost $150 per barrel by June would likely require “tighter monetary policy.” Global Banking and Finance
Economists at Barclays said the ECB would raise rates in a scenario where Brent crude settled at around $100 a barrel — compared to $113 at the time of the meeting — and natural gas at 70 euros. RTÉ With spot prices already comfortably above that threshold, the bar to a June hike, at minimum, is looking increasingly low.
Key Takeaways:
- ECB deposit rate remains at 2.0% (sixth consecutive hold), main refinancing rate at 2.15%
- Lagarde replaced “good place” language with “well-positioned and well-equipped” — a significant hawkish shift
- Baseline 2026 inflation: 2.6%; severe scenario: 4.4%
- Brent crude at ~$112–119/bbl at March 19 meeting vs. March 11 cut-off assumption of $81/bbl
- Markets pricing 16bp of hikes through April; 2–3 hikes by December
- EUR/USD at approximately 1.1457, weaker post-war, amplifying imported inflation
- April 29–30 ECB meeting is the next live decision point
The Stagflation Trap: Growth Risks and the Dual Mandate Squeeze
Here lies the ECB’s cruellest dilemma. The same oil shock that threatens to push inflation higher is simultaneously crushing the growth outlook. GDP growth has been revised down to just 0.9% for 2026 — barely above stagnation — as the war weighs on real incomes, business confidence, and consumption. Euronews An economy growing at sub-1% is not one that screams “raise rates.”
And yet Lagarde has made clear that the ECB will not be paralysed by this tension. The key variable is second-round effects — the mechanism by which an initial energy shock bleeds into wages, services prices, and long-run inflation expectations. “If persistent, higher energy prices may lead to a broader increase in inflation through indirect and second-round effects — a situation which requires close monitoring,” Lagarde said. Euronews
“The experience of the 2022 energy crisis, and consumers’ expectations still scarred from that episode, could make the ECB quicker to hike if energy pressures are sustained,” HSBC economist Fabio Balboni noted. Morningstar Crucially, Isabel Schnabel, a prominent anti-inflation hawk among ECB policymakers, has also warned about the “scars” that episode left on households and businesses — though she notes an important difference: monetary and fiscal policies are not loose this time, which should help limit inflationary pressures. RTÉ
In a scenario where the war in the Middle East and soaring energy prices remain limited in time, the ECB will talk like a hawk but not walk like a hawk. However, if energy prices stay high or higher for longer and find their way into other parts of the eurozone economy, the central bank apparently wouldn’t shy away from rate hikes. ING THINK
That is the critical fork in the road. Duration, not magnitude, is the decisive variable. A spike that resolves in eight weeks is one problem. A sustained disruption lasting into Q3 2026 — with supply chains rerouted, shipping costs elevated, and wage negotiators armed with fresh grievances — is something else entirely.
Global Spillovers: The Fed, the BOE, and Emerging Market Currencies
Frankfurt is not facing this shock in isolation. The Federal Reserve kept rates unchanged, as expected, and its Summary of Economic Projections showed policymakers still expect to deliver one rate cut in 2026 and another one in 2027. Officials revised inflation higher, with PCE inflation now expected at 2.7% at the end of 2026 versus 2.4% in December, while growth was revised to 2.4% versus 2.3% previously. FXStreet
The Bank of England, meanwhile, voted unanimously to keep its benchmark interest rate on hold at 3.75%. Before the war in Iran erupted in late February, the BOE had been expected to cut its key interest rate. CNBC That rate-cut cycle is now indefinitely suspended.
Central banks in the United States, Canada, Japan, Britain, Sweden, and Switzerland delivered broadly similar messages — a global synchronised pause, with a hawkish tilt. Global Banking and Finance The synchronicity matters: when multiple major central banks simultaneously signal willingness to tighten, the knock-on effects for emerging market economies that borrowed in dollars and euros — from Turkey to Indonesia to South Africa — can be severe, as capital flows back towards developed-market yields.
For the euro area, the weaker EUR/USD compounds the inflation problem directly. Energy is priced in dollars. A euro that buys fewer dollars means European households pay more for every barrel of crude and cubic metre of gas, regardless of what happens to spot commodity prices. The currency channel is, in effect, a built-in amplifier on the energy shock — and it is currently working against Frankfurt.
What Investors and Businesses Should Watch
What Investors Should Watch:
- April 30 ECB Decision: The next meeting is the true test. Monitor Brent crude pricing in the two weeks preceding — if it holds above $100/bbl, a hike becomes a live possibility. If it retreats toward $85, the ECB is likely to hold and reassess in June.
- Second-Round Effect Indicators: Watch the ECB’s Wage Tracker (updated monthly), eurozone services inflation, and industrial selling price surveys. These are Lagarde’s own stated tripwires.
- Inflation Expectations: The 5y5y EUR inflation swap — the market’s long-run inflation gauge — is the ECB’s preferred thermometer for anchoring risks. Any sustained move above 2.5% would be an emergency signal for Frankfurt.
- Hormuz Developments: Geopolitical developments in the Strait of Hormuz remain the dominant macro variable for the next 6–8 weeks, overriding all conventional economic indicators.
- EUR/USD: A further decline in the euro amplifies the imported inflation channel, potentially pulling the ECB’s trigger sooner. Watch 1.12 as a line in the sand.
Eurozone Growth at Risk: The Political Economy of Austerity Under Fire
There is a painful irony in the current configuration. Germany, the eurozone’s fiscal anchor, is finally loosening its legendary Schuldenbremse — the constitutional debt brake — to fund defence and infrastructure spending, a stimulus long demanded by Brussels. That fiscal expansion, however welcome in the short run, arrives precisely as the energy shock threatens to reignite inflation.
Investors are already bracing for higher government borrowing in response to the Iran crisis — a shift that comes on top of Germany’s plans to sell more debt to ramp up military and infrastructure spending. That could further fuel inflation and has already pushed up bond market borrowing costs before any ECB action. Global Banking and Finance
The result is a doubly challenging environment for southern European sovereigns — Italy, Spain, Portugal — whose financing costs are sensitive to both ECB policy rates and market risk premia. Should the ECB raise rates in June, peripheral bond spreads will widen, potentially triggering the very financial fragmentation that Frankfurt’s Transmission Protection Instrument (TPI) was designed to prevent.
Growth in the eurozone could drop by 0.2% in 2026 if the impact of the conflict persists, according to the UK-based National Institute of Economic and Social Research. Morningstar Against an already-revised baseline of 0.9%, that would push the eurozone to the verge of contraction. The ECB’s communications department will have to perform extraordinary feats of policy narrative management to explain rate hikes amid near-recession conditions — if that moment arrives.
The Verdict: Hawkish Pivot, Conditional Tightening, and the Long Game
Step back from the daily noise, and the strategic picture that emerges from Frankfurt is coherent, if uncomfortable. The ECB has made a deliberate choice to move from passive accommodation to active vigilance — not a tightening, but a pre-positioning. All in all, a rate hike is not yet on the table, but today’s meeting clearly marks a hawkish pivot. ING THINK
Lagarde’s “at any meeting” formulation is the monetary policy equivalent of a chess player picking up a piece and placing their hand on it, without yet committing to a square. The signal is intentional: the ECB has options, the ECB is watching, and the ECB will not repeat 2022’s mistake of labelling a sustained shock “transitory.”
“This hawkish tilt supports our view that the ECB is more likely to raise rates rather than lower them this year, with cuts now seemingly out of the question,” noted Roman Ziruk, senior market analyst at Ebury. The Irish Times
The next six weeks — running up to the April 29–30 Governing Council — will determine whether this is a credible hawkish posture or the opening act of an actual tightening cycle. The variables are brutally simple: oil prices, wage data, and the trajectory of a war that no economist’s model fully anticipated. If Lagarde sounds like a hawk today, it is because history — painful, recent, institutional memory — has taught her that waiting costs dearly.
In Frankfurt, the fireside chat is over. The fire is outside.
There is something quietly extraordinary about watching Christine Lagarde retire the phrase “good place” after using it as a near-liturgical mantra through six consecutive hold decisions. Central bank language is a form of institutional trust management — every repeated phrase becomes a commitment, and every abandoned phrase becomes a statement about the world having changed.
The phrase “at any meeting” is doing significant work here. It is not “we are considering raising rates.” It is not “the next meeting is live.” It is a blanket statement of optionality: we could act in April, June, July, September — wherever the data takes us. This is textbook forward guidance deployed in reverse — rather than anchoring expectations of inaction, Lagarde is deliberately leaving them unanchored, forcing markets to price a broader distribution of outcomes.
The deeper question — and the one that keeps ECB-watchers up at night — is whether the central bank has internalized the right lesson from 2022. That crisis showed the catastrophic cost of wishful thinking: the ECB’s initial “transitory” framing delayed tightening by crucial months, allowing inflation expectations to drift and ultimately requiring emergency-speed rate hikes that hurt growth. The self-awareness Lagarde displayed this week, noting “in those four years, we have learned,” is encouraging. But institutional memory is most reliable when it is written into frameworks and processes, not just recited from podiums.
What this moment also reveals is the irreversibility of the geopolitical dimension in central banking. For three decades post-Cold War, energy markets were treated as a background variable — occasionally disruptive, never structural. 2022 changed that. The Iran shock of 2026 confirms it. Central banks are now, unavoidably, geopolitical actors — making monetary decisions whose outcomes depend on military developments they cannot observe, predict, or control. Christine Lagarde did not train for that role at Sciences Po. But she is, with increasing command, learning to inhabit it.
People Also Ask: Related Questions
- Will the ECB raise interest rates at the April 2026 meeting? ECB sources reported by Bloomberg and Reuters suggest a hike is possible at April 29–30, contingent on sustained energy price elevation and emerging second-round inflation effects. Markets are pricing 16bp of hikes through April.
- What did Lagarde say at the ECB Watchers Conference on March 25, 2026? Lagarde said the ECB “will not be paralysed by hesitation” and is “prepared, if appropriate, to make changes to our policy at any meeting” — the clearest hawkish signal since the Iran war began.
- How does the Iran war affect eurozone inflation and ECB rates? The conflict has pushed Brent crude above $115/bbl, causing the ECB to revise its 2026 inflation forecast from 1.9% to 2.6%. A severe scenario with sustained energy disruptions could push inflation to 4.4% in 2026, which the ECB has said would require tighter monetary policy.
- What is the current ECB interest rate in 2026? As of March 19, 2026, the ECB deposit facility rate is 2.0%, the main refinancing rate is 2.15%, and the marginal lending rate is 2.4%. All three are unchanged for the sixth consecutive meeting.
- How is EUR/USD responding to ECB hawkish signals and the Iran war? EUR/USD has weakened from around 1.1778 pre-war to approximately 1.1457, reflecting combined risk-aversion and dollar strength. A weaker euro amplifies imported energy inflation, potentially accelerating the ECB’s decision to raise rates.
Discover more from The Economy
Subscribe to get the latest posts sent to your email.


Executive Summary & Key Takeaways
The global macroeconomic landscape is defined by monetary policy shifts, technological supply chain realignments, and shifting demographic dynamics. According to official economic monitoring by the International Monetary Fund (IMF World Economic Outlook) and the World Bank Group, global GDP exceeds $125 trillion in nominal terms.
- Top Position: The United States maintains its position as the largest nominal economy at $32.38 trillion, driven by tech innovation, resilient consumer demand, and deep capital markets, as highlighted by the U.S. Bureau of Economic Analysis.
- PPP Leader: China dominates Purchasing Power Parity (PPP) with an output of $44.30 trillion, reflecting its massive industrial capacity and domestic consumption scale.
- European Dynamics: Germany holds the 3rd spot nominally ($5.45 trillion), navigating energy transitions and industrial re-tooling ahead of Japan ($4.38 trillion).
- Emerging Growth Engines: India leads among major emerging markets with real GDP growth expanding above 6.4%, positioning it to challenge top-tier positions over the coming decade.
Global GDP Ranking Matrix: Top 10 Economies
Below is a comparative breakdown of the top 10 economies, combining Nominal GDP, PPP GDP, Nominal GDP Per Capita, and Real GDP Growth Rates aggregated from primary statistical repositories including Eurostat and the Federal Reserve Economic Data (FRED).
| Rank | Country | Nominal GDP (USD)∣PPPGDP(Int.) | Nominal GDP Per Capita | Real Growth Rate (%) | Key Dominant Sector |
| 1 | United States | $32.38 Trillion | $32.38 Trillion | $94,430 | 2.32% |
| 2 | China | $20.85 Trillion | $44.30 Trillion | $14,874 | 4.41% |
| 3 | Germany | $5.45 Trillion | $6.41 Trillion | $65,303 | 0.79% |
| 4 | Japan | $4.38 Trillion | $7.26 Trillion | $35,703 | 0.72% |
| 5 | United Kingdom | $4.26 Trillion | $4.72 Trillion | $61,056 | 0.80% |
| 6 | India | $4.15 Trillion | $18.90 Trillion | $2,813 | 6.48% |
| 7 | France | $3.60 Trillion | $4.73 Trillion | $52,083 | 0.86% |
| 8 | Italy | $2.74 Trillion | $3.87 Trillion | $46,505 | 0.52% |
| 9 | Russia | $2.66 Trillion | $7.53 Trillion | $18,525 | 1.09% |
| 10 | Brazil | $2.64 Trillion | $5.23 Trillion | $12,313 | 1.91% |
In-Depth Profile of the Top 10 Economies
1. United States
- Nominal GDP: $32.38 Trillion | PPP GDP: $32.38 Trillion | Per Capita: $94,430
- Growth Rate: 2.32%
- Economic Analysis: The U.S. economy remains the world’s chief financial powerhouse. Its growth is underpinned by flexible labor markets, dominant technology giants, and capital allocation mechanisms tracked by the Federal Reserve System. The nation’s strength in artificial intelligence, software infrastructure, biotechnology, and energy self-sufficiency shields it against foreign supply chokepoints.
- Macro Risk: High national debt levels and elevated interest rates aimed at controlling service-sector inflation.
2. China
- Nominal GDP: $20.85 Trillion | PPP GDP: $44.30 Trillion | Per Capita: $14,874
- Growth Rate: 4.41%
- Economic Analysis: China is the world’s industrial foundation and the largest economy measured by Purchasing Power Parity. According to global trade documentation from UNCTAD, China leads in global manufacturing export volumes, electric vehicle supply chains, solar tech, and rare earth processing.
- Macro Risk: Real estate market structural adjustments, local government debt debt-servicing burdens, and demographic headwinds from an aging workforce.
3. Germany
- Nominal GDP: $5.45 Trillion | PPP GDP: $6.41 Trillion | Per Capita: $65,303
- Growth Rate: 0.79%
- Economic Analysis: Germany serves as the industrial core of the European Union. Supported by a specialized network of medium-sized industrial leaders (Mittelstand), Germany excels in high-precision engineering, chemical processing, and industrial machinery.
- Macro Risk: Transitioning away from historically cheap pipeline gas toward green hydrogen/renewable infrastructure, combined with structural labor shortages.
4. Japan
- Nominal GDP: $4.38 Trillion | PPP GDP: $7.26 Trillion | Per Capita: $35,703
- Growth Rate: 0.72%
- Economic Analysis: Known for technological innovation and precision manufacturing, Japan benefits from high foreign assets, advanced robotics, and heavy domestic research investment. Trade flows published by the OECD iLibrary highlight Japan’s high value-add manufacturing integration across Asia and the Americas.
- Macro Risk: Persistent demographic contraction and high public debt-to-GDP ratios managed by the Bank of Japan.
5. United Kingdom
- Nominal GDP: $4.26 Trillion | PPP GDP: $4.72 Trillion | Per Capita: $61,056
- Growth Rate: 0.80%
- Economic Analysis: The UK relies heavily on services, which account for roughly 80% of total economic output. London remains one of the world’s premier financial centers, excelling in asset management, insurance, cross-border fintech, and legal services.
- Macro Risk: Supply-chain re-anchoring post-Brexit and sluggish domestic capital investment rates.
6. India
- Nominal GDP: $4.15 Trillion | PPP GDP: $18.90 Trillion | Per Capita: $2,813
- Growth Rate: 6.48%
- Economic Analysis: India is the world’s fastest-growing major economy. Driven by rapid digital public infrastructure expansion, nationwide transport investments, and expanding manufacturing under global supply chain diversification strategies (“China + 1”), India is rapidly scaling up both domestic consumption and industrial exports.
- Macro Risk: Job creation for a massive young workforce and infrastructure expansion bottlenecks.
7. France
- Nominal GDP: $3.60 Trillion | PPP GDP: $4.73 Trillion | Per Capita: $52,083
- Growth Rate: 0.86%
- Economic Analysis: France operates a diversified economy featuring strong tourism, aerospace (Airbus), luxury consumer conglomerates (LVMH, Kering), and nuclear energy generation. Its low-carbon electricity grid provides cost-stability advantages over neighboring industrial markets.
- Macro Risk: Public deficit management and rigid labor market structural adjustments.
8. Italy
- Nominal GDP: $2.74 Trillion | PPP GDP: $3.87 Trillion | Per Capita: $46,505
- Growth Rate: 0.52%
- Economic Analysis: Italy’s economy relies on an export-oriented manufacturing base in its northern regions, specializing in luxury automobiles, industrial automation, pharmaceutical production, and high-end textiles.
- Macro Risk: Public sector debt servicing and structural regional economic disparities between North and South.
9. Russia
- Nominal GDP: $2.66 Trillion | PPP GDP: $7.53 Trillion | Per Capita: $18,525
- Growth Rate: 1.09%
- Economic Analysis: Russia’s economy is anchored by natural resources, defense-industrial state expenditures, and energy commodity exports to non-Western trading partners across Eurasia and Africa.
- Macro Risk: International financial restrictions, currency volatility, and sanctions-driven technology supply constraints.
10. Brazil
- Nominal GDP: $2.64 Trillion | PPP GDP: $5.23 Trillion | Per Capita: $12,313
- Growth Rate: 1.91%
- Economic Analysis: Brazil dominates Latin America’s economic landscape, propelled by agricultural exports (soybeans, beef, sugar), iron ore extraction via Vale, deepwater oil exploration, and a sophisticated fintech banking sector.
- Macro Risk: Fiscal deficit volatility and vulnerability to global commodity price cycles.
Methodology: How Economic Output is Measured
Evaluating economic scale requires understanding three primary economic indicators:
                  ┌────────────────────────────────────────────────┐
                  │          Gross Domestic Product (GDP)          │
                  └───────────────────────┬────────────────────────┘
                                          │
            ┌─────────────────────────────┼─────────────────────────────┐
            ▼                             ▼                             ▼
┌───────────────────────┐     ┌───────────────────────┐     ┌───────────────────────┐
│     Nominal GDP       │     │        PPP GDP        │     │    GDP Per Capita     │
├───────────────────────┤     ├───────────────────────┤     ├───────────────────────┤
│ Expressed in current  │     │ Adjusted for local    │     │ Total output divided  │
│ USD exchange rates.   │     │ purchasing power.     │     │ by population.        │
│ Identifies global     │     │ Reflects internal     │     │ Measures average      │
│ capital power.        │     │ economic scale.       │     │ living standard.      │
└───────────────────────┘     └───────────────────────┘     └───────────────────────┘
- Nominal GDP (Current Prices in USD): Measures the market value of all final goods and services produced within a country in a given year. Nominal values convert domestic output using prevailing market exchange rates. While ideal for assessing international purchasing power, it fluctuates with currency market swings.
- Purchasing Power Parity (PPP): Adjusts for relative price levels and local living costs using an international basket of goods. According to data methodology guides from the Bank for International Settlements (BIS), PPP offers a realistic view of domestic production capability and domestic consumer capacity.
- GDP Per Capita: Divides total economic output by total population. This distinguishes between sheer economic scale (e.g., India or China) and individual living standards (e.g., Switzerland, Luxembourg, or the United States).
Key Takeaways for Global Economic Trends
- The Shift Toward Multipolar Growth: Asia’s expanding market share—led by China, India, Indonesia, and Vietnam—continues to outpace global growth averages, shifting the center of gravity of manufacturing and consumption.
- Energy Transition Dynamics: Nations with sovereign clean tech supply chains (China) or independent nuclear grids (France) gain structural cost advantages over those dependent on imported fossil fuels.
- Demographics vs. Productivity: Aging populations across Europe and East Asia mean future expansion depends heavily on capital deployment into automation, AI infrastructure, and high-margin service exports.
Discover more from The Economy
Subscribe to get the latest posts sent to your email.
Why did Wendy’s stock fall in 2026? The Wendy’s Company withdrew its full-year 2026 financial outlook and cut its dividend to help fund a turnaround effort after reporting second-quarter results showing global systemwide sales down 6.5% year-over-year, according to the company’s official second-quarter earnings release. The decline was driven by an 8.2% drop in U.S. sales, only partially offset by 3.4% growth internationally — a split that has defined the company’s story for most of the year.
New leadership has been blunt about the scale of the problem. President and CEO Bob Wright, who returned to the company to lead the turnaround, said directly that traffic, the brand’s value proposition, and franchisee economics were not meeting expectations, while outlining five specific areas of focus: rebuilding a quality menu at compelling value, marketing that drives demand, operational excellence, a stronger digital experience, and turning restaurants themselves into a growth engine.
The Numbers Behind the Turnaround
Featured Snippet Target: Wendy’s Q2 2026 results showed revenue of $571 million, net income of $32.6 million, and adjusted EBITDA of $124.1 million, but global systemwide sales fell 6.5% year-over-year — driven primarily by an 8.2% U.S. sales decline — prompting the company to withdraw its full-year guidance and cut its dividend.
The pressure had been building for several quarters before the Q2 announcement. In the first quarter of 2026, Wendy’s reported revenue of $541 million (up 3.3% year-over-year) but adjusted earnings per share of just $0.12 — down 40% from $0.20 in the same quarter of 2025 — as global systemwide sales fell 5.5% on a constant-currency basis, driven by a 7.8% drop in U.S. same-restaurant sales, according to financial analysis from TIKR. Management attributed part of that decline to severe winter weather in January and February, alongside intentional operating-hour reductions tied to the company’s store-footprint optimization initiative, known internally as Project Fresh.
International growth has been the one consistent bright spot. Wendy’s international business delivered 6% systemwide sales growth in the first quarter, powered by new restaurant development in the Philippines and Mexico — a pattern that continued into the second quarter, when international sales grew 3.4% even as the U.S. business contracted sharply.
Is Project Fresh Actually Working?
Company-operated restaurants that have fully implemented the Project Fresh operational playbook outperformed the broader U.S. system by 310 basis points in same-restaurant sales during the first quarter, according to comments from Interim CEO and CFO Ken Cook on the Q1 earnings call — an early data point management has pointed to as evidence the turnaround approach works where it has actually been rolled out. On the subsequent Q4 earnings call, Cook told analysts that October marked the low point for the business, with sequential improvement through late 2025 and early 2026, before adverse January weather disrupted that recovery trend, according to call notes compiled by StockStory.
The restructuring has a real physical footprint: roughly 5% to 6% of U.S. Wendy’s locations are set to close, with most of those closures concentrated in the first half of 2026 — building on 240 U.S. location closures the chain had already carried out the prior year, according to reporting picked up by Fast Company. Franchisee buy-in has been a recurring analyst question on earnings calls, with Cook emphasizing frequent communication and flexibility as franchisees weigh whether the new operational playbook genuinely improves their unit economics.
What Wall Street Thinks
Analyst sentiment on Wendy’s stock has remained genuinely split rather than converging on a clear verdict. Coverage compiled by Barchart noted that the stock trades at roughly 12 times current-year earnings and under eight times 2030 forecasts — a valuation implying significant potential upside if the turnaround succeeds — but also flagged that the number of analysts covering the stock rose 30% in the first quarter of 2026 alone, with the resulting consensus landing on a “Hold” rating and a roughly even split between Buy and Sell recommendations. That’s an unusually wide disagreement for a large-cap consumer stock, reflecting genuine uncertainty about whether management’s turnaround playbook can offset structural share losses to competitors such as McDonald’s.
Rising beef costs added a separate layer of margin pressure through the first half of the year. Wendy’s Chief Accounting Officer and Global Head of FP&A Suzanne Thuerk indicated commodity inflation would run in the high single digits during the first half of 2026 due to double-digit beef inflation, before moderating to a low single-digit pace in the back half of the year as the company began cycling past the prior year’s elevated beef costs.
The Bottom Line
Wendy’s 2026 story is a genuine turnaround-in-progress rather than a settled outcome in either direction. The company has been transparent about the scale of its U.S. traffic and value-proposition problems, has a specific operational framework (Project Fresh) with early data suggesting it improves results where implemented, and has an international business that continues to grow steadily even as the U.S. core contracts. But the dividend cut, withdrawn guidance, and split analyst sentiment all signal that management itself is not yet confident enough in the pace of recovery to make firm forward commitments.
Next step: Investors and franchise-industry watchers should track same-restaurant sales trends specifically at fully-converted Project Fresh locations in upcoming quarters — that cohort, more than the blended company-wide average, is the clearest read on whether the turnaround strategy itself is working.
Discover more from The Economy
Subscribe to get the latest posts sent to your email.
Former President Donald Trump’s financial balance sheet is undergoing unprecedented pressure. While his estimated net worth fluctuated dramatically following the public listing of Trump Media & Technology Group (TMTG), his real-world liquidity faces severe headwinds from court-ordered judgments, mounting interest, commercial real estate debt maturities, and escalating legal fees.
Understanding the magnitude of Trump’s financial landscape requires separating volatile paper equity from available cash, real estate assets, and legal liabilities.
1. The $454 Million Civil Fraud Judgment and Appeal Bond Dynamics
The largest immediate financial threat stems from New York State Supreme Court Judge Arthur Engoron’s ruling in the civil fraud lawsuit brought by New York Attorney General Letitia James.
- Initial Ruling: Trump was found liable for systematically inflating asset values to secure favorable loan terms and insurance rates.
- Financial Penalty: The court ordered disgorgement of approximately $354 million in ill-gotten gains, plus pre-judgment interest that pushed the initial obligation past $454 million.
- Accruing Interest: Statutory post-judgment interest accrues at 9% per annum (roughly $112,000 per day), steadily increasing the total debt while appeals proceed.
According to legal reporting from [Reuters], securing an appeal bond proved exceptionally difficult. Over 30 surety companies rejected Trump’s requests to guarantee the full amount without liquid collateral, as insurers overwhelmingly refuse to accept real estate as bond backing. An appellate bench subsequently allowed a reduced bond of $175 million, which Trump posted via Knight Specialty Insurance Company to stay enforcement while the appellate division reviews the merit of the ruling.
2. E. Jean Carroll Defamation Verdicts: $88.3 Million in Liability
In addition to state-level regulatory judgments, federal jury decisions in New York have created substantial financial commitments:
| Case | Jury Award | Status / Collateral Mechanism |
| Carroll I (Sexual Abuse & Defamation) | $5.0 Million | Placed in court-monitored escrow during appeal. |
| Carroll II (Defamation) | $83.3 Million | Secured via an $91.6 million appeal bond posted through Federal Insurance Co. (Chubb). |
As detailed by [CNBC], these judgments require collateralization regardless of ongoing appeals. Trump was forced to lock up cash or liquid securities to secure these bonds, directly contracting his available operational liquid reserves.
3. Trump Media (DJT): Paper Billions vs. Realizable Cash
The public debut of Trump Media & Technology Group Corp. (NASDAQ: DJT) via a SPAC merger briefly added billions to Trump’s paper net worth. However, financial analysts at [Forbes] note that transforming paper valuation into usable cash presents critical structural obstacles:
- Fundamental Disconnect: TMTG’s multi-billion-dollar valuation stands in stark contrast to its underlying balance sheet, which showed modest revenues against notable operational expenses.
- Market Impact of Cashing Out: Trump owns roughly 57% to 60% of the company. Any large-scale liquidation of his shares to cover cash liabilities risks signaling a loss of confidence, potentially triggering a sharp price decline before significant volume can be sold.
- Lock-Up Agreement Expirations: While lock-up restrictions initially prevented insider selling, the expiration of these periods subjects the stock to heightened market volatility and short-selling pressure.
4. Commercial Real Estate Exposure & Refinancing Headwinds
A substantial portion of Trump’s traditional wealth remains tied up in commercial real estate—a sector currently suffering from high interest rates, declining office occupancies, and tightened banking credit standards.
Trump Asset Portfolio Exposure
├── Commercial Properties (High debt exposure / Refinancing risk)
│   ├── 40 Wall Street (NYC)
│   └── Trump Tower Commercial Space (NYC)
├── Golf Courses & Resorts (Stable cash flow / High capital expenditure)
└── Brand Licensing & Cash Equivalents (Encumbered by legal escrow/bonds)
Key commercial debt obligations reported by [The Wall Street Journal] highlight specific vulnerabilities:
- 40 Wall Street (New York): The property’s debt was placed on lender watchlists in recent years due to rising vacancy rates, falling net operating income (NOI), and elevated ground-lease costs.
- Refinancing Risks: With commercial mortgage-backed securities (CMBS) debt maturing across several properties, refinancing in a high-rate environment significantly increases debt service payments, squeezing operational margins.
5. Political Action Committee (PAC) Legal Expense Drain
Legal fees have consumed a massive share of Trump’s available political fundraising funds. As documented by [The New York Times], Donald Trump’s leadership PAC, Save America, has spent tens of millions of dollars funding legal defense fees for the former president and co-defendants across multiple jurisdictions.
This drain on donor funds creates a dual liability:
- It diverts resources away from political field operations and advertising.
- It exposes the campaign structure to ongoing cash demands as criminal and civil proceedings drag on.
Financial Outlook & Solvency Risks
Trump’s asset portfolio is characterized by a strong imbalance between illiquid real estate equity and immediate cash demands.
Total Cash Demands (Judgments + Bonds Posted) : ~$260M+ Cash Restricted/Encumbered
Pending Liabilities (If Appeals Fail)        : ~$540M+ Total Direct Civil Cash Penalties
While Trump’s overall asset base—including golf courses, residential property, and brand licensing—remains valuable, his immediate solvency depends heavily on appellate court decisions. Should the appellate courts uphold the full civil fraud judgment without reduction, the need for immediate cash could force distressed asset sales or high-cost private equity financing, fundamentally altering the Trump Organization’s financial baseline.
Discover more from The Economy
Subscribe to get the latest posts sent to your email.

Silver Price Today: Why the Xi-Trump AI Standoff Is Fueling a Safe-Haven Rally

Citibank & Dólar Estadounidense: Forex Playbook After the Xi-Trump Truce

How the Trump-Xi White House Summit Is Reshaping Mortgage Rates Today for Real Estate Investors

Indonesia Navigates Mega-Project Risks as China and Russia Eye the 2,772km Trans-Kalimantan Railway

Trump-Xi 2026 Summit Takeaways: The Trade Truce, Taiwan, and the AI Divide

Solar Panel Installation Cost in 2026: Why the Math Changed Overnight

Business Insurance: What Coverage You Actually Need and What It Costs in 2026

Auto Insurance Quotes: How to Get the Lowest Rate Without Losing Coverage

Huntington Online Banking: Full Features, Fees, and How It Compares in 2026

Apply for a Bank Account Online: What You Need and How Long It Actually Takes

World’s Largest Economies: Ranking the Top Global Powers

Business Loan: A Complete 2026 Guide to Rates, Types, and Qualifying

Fast Invoice Factoring: How to Turn Unpaid Invoices Into Cash Within 24 Hours

Investment Banking Services: What They Cost and How to Choose the Right Firm in 2026

Top 30 Stocks for Investment in PSX for Massive ROI in 2026

SpaceX Starship Flight 14: First Orbital Attempt & Starlink V3 Launch Explained

Oil Prices Break $100 in 2026: Middle East Conflict & Energy Markets

BRICS+ Cross-Border Payments 2026: Interoperability Explained

AI Chip Stocks 2026: The Best Semiconductor Investments Beyond Marvell

Fidelity Investments Review 2026: SPAXX Yields & Zero-Fee Funds

Tween Back-to-School Trends 2026: What’s Driving the $85B Season

10-Year Treasury Yield Hits 4.80%: What It Means for Rates & Portfolios

Shein Clothes Quality & Safety in 2026: What Lab Tests Show

China’s US$10.8 Billion Trade Shortcut: Why the Pinglu Canal Matters

MRVL Earnings 2026: Why Marvell Sank Despite Beating Estimates

IMF & World Bank 2026 Global Economic Outlook: Growth, Inflation, Debt

Middle East War Economics 2026: Oil Prices & Energy Markets

High-CPM Finance Niches 2026: Publisher Monetization Blueprint
-

 Markets & Finance9 months ago
Top 15 Stocks for Investment in 2026 in PSX: Your Complete Guide to Pakistan’s Best Investment Opportunities
-

 Analysis7 months ago
Johor’s Investment Boom: The Hidden Costs Behind Malaysia’s Most Ambitious Economic Surge
-

 Analysis7 months ago
Top 10 Stocks for Investment in PSX for Quick Returns in 2026
-

 Banks8 months ago
Best Investments in Pakistan 2026: Top 10 Low-Price Shares and Long-Term Picks for the PSX
-

 Analysis8 months ago
Brazil’s Rare Earth Race: US, EU, and China Compete for Critical Minerals as Tensions Rise
-

 Investment9 months ago
Top 10 Mutual Fund Managers in Pakistan for Investment in 2026: A Comprehensive Guide for Optimal Returns
-

 Global Economy9 months ago
15 Most Lucrative Sectors for Investment in Pakistan: A 2025 Data-Driven Analysis
-

 Global Economy9 months ago
Pakistan’s Export Goldmine: 10 Game-Changing Markets Where Pakistani Businesses Are Winning Big in 2025