
Asia
Singapore’s Gold Rush: Retailers Import Record Stock and Build Massive New Vaults

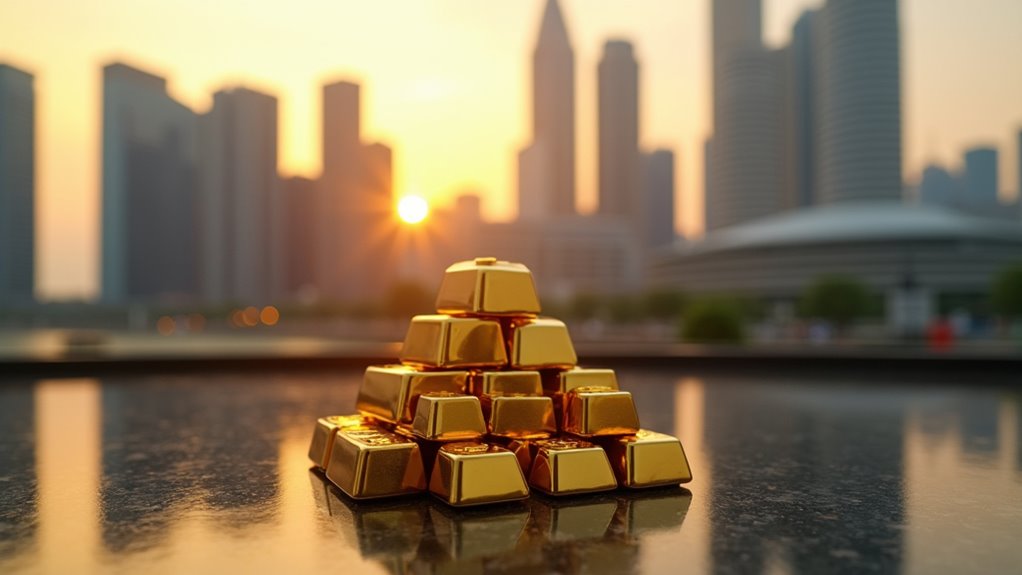
The shipment arrived at Changi before dawn — sixteen pallets of PAMP Suisse bars, crated and heat-sealed in Zurich, routed through a cargo carrier that had quietly rerouted its flight path to avoid airspace over the Persian Gulf. By the time the sun came up over Singapore’s eastern shoreline, the bars were already being logged into The Reserve’s inventory system, disappearing into one of fifteen high-security gold vaults assembled from 350 tonnes of composite steel. No fanfare. No press release. Just another morning in what is becoming, by almost every available metric, the world’s most consequential new epicentre for physical gold demand.
What is unfolding in Singapore in the first quarter of 2026 is not a story that fits neatly into the familiar grammar of commodity cycles. This is not the panicked hoarding of 2008 or the pandemic-era scramble of 2020. It is something more deliberate, more structural — and, remarkably, more demographically diverse than anything the city-state’s gold industry has seen in living memory. The queues at Orchard Road jewellers, the cranes rising above Changi South, the twenty-four-year-olds photographing serial numbers on one-kilogram bars with their phones — together, they tell a story about how geopolitical rupture reshapes financial behaviour, and why Singapore, for reasons that are as much architectural as accidental, sits at the centre of it.
How the Middle East Crisis Ignited Singapore’s Gold Demand Surge
To understand the Changi shipment, you have to understand what happened 4,000 kilometres to the west.
Gold prices surged again in early March 2026, breaching US$5,300 per ounce following United States and Israeli strikes on Iran, before settling near US$5,050 amid broader volatility linked to oil prices and inflation expectations. worldgoldpricepro The strikes effectively scrambled global risk calculations overnight. Equity indices from Tokyo to Frankfurt registered sharp losses. Insurance premiums on cargo passing through the Gulf of Oman spiked to levels not seen since the tanker wars of the 1980s. And in Singapore, dealers’ phones began ringing before the smoke had cleared.
The price trajectory tells its own story. Gold reached a record US$5,589.38 per ounce on January 28 before retreating, then rebounded above US$5,300 in early March following the US and Israeli strikes on Iran, amid broader volatility linked to oil prices and inflation expectations. Gata In the weeks that followed, that volatility — far from deterring buyers — became an accelerant. Every dip below the psychologically significant US$5,000 level triggered what dealers describe as “dip-buying waves” that emptied display cases within hours.
The current gold rally is distinguished by record central bank buying since 2022, with purchases more than twice their 2015–19 average. Central banks’ share of total demand rose to nearly 25 percent in 2024, compared with 12 percent in 2015–19. World Bank What is new in early 2026 is that this institutional floor — already historically elevated — is now being augmented from below by a retail surge of remarkable breadth and intensity. The World Gold Council’s most recent demand outlook flags continued central bank buying of approximately 850 tonnes through 2026. But it is the retail dimension, particularly in Southeast Asia, that analysts say is catching the market structurally off-guard.
Singapore’s Gold Demand Hits Historic Levels: The Data Behind the Rush
The numbers coming out of Singapore’s bullion ecosystem in the first quarter of 2026 are, by any historical standard, extraordinary.
Silver Bullion founder Gregor Gregersen said sales of gold and silver bullion surged about 350 per cent year-on-year in the 12 months to March 1, driven largely by heavy buying during price dips after a late-January correction. Gata That figure — a near-fourfold increase over a twelve-month period — would be remarkable in any market. In one that deals in physical precious metals, where supply chains depend on Swiss refineries, LBMA-certified carriers, and bonded logistics corridors that can take days to navigate, it is close to unprecedented.
At pawnshop operator ValueMax, managing director Yeah Lee Ching reported a “noticeable increase” in gold purchases, particularly for LBMA bars and 916 jewellery. The company, which posted revenue of S$425 million, plans to significantly expand its inventory of PAMP Suisse bars. worldgoldpricepro The detail about PAMP Suisse — a Geneva-headquartered refinery whose gold bars are among the most liquid and universally recognised bullion instruments in the world — matters. These are not buyers purchasing gold chains as ornaments or gifts. They are making portfolio allocations, with the same calculus that guides any serious financial decision.
David Mitchell, founder and managing director of Indigo Precious Metals, reported that his Bukit Pasoh Road outlet has seen demand more than double in 2026 compared with the same period last year. worldgoldpricepro He has also seen the supply side straining under the pressure. According to industry insiders, demand has outpaced supply, partly due to constraints in refining capacity and logistics in key hubs such as Switzerland, the UK, and Hong Kong. Malay Mail The paradox is acute: the greatest surge of physical gold demand in a generation is arriving at precisely the moment when the global system for producing, hallmarking, and delivering refined bullion is most constrained.
The escalating Middle East conflict created unexpected supply chain constraints. Airspace closures disrupted traditional logistics routes, particularly affecting gold imports from the United Arab Emirates to key consuming markets, creating a paradoxical situation where supply constraints narrowed rather than widened price discounts. World Bank In practical terms, that means premiums are rising. Buyers prepared to pay above spot are being rewarded with faster delivery. Those seeking standard pricing are waiting.
Singapore’s New Gold Vaults: Inside the Infrastructure Bet at Changi South
The most durable evidence that something structurally significant is happening in Singapore’s gold market lies not at retail counters but in the construction activity near the eastern end of the island.
Encased in sleek onyx, The Reserve soars some 32 metres above Singapore’s Changi Airport. The six-storey warehouse is designed to hold 10,000 tonnes of silver — more than a third of global annual supply — and 500 tonnes of gold, equivalent to about half of what central banks purchased in 2023. Bloomberg Completed in 2024 by Silver Bullion after its previous facility ran out of space, The Reserve is the kind of infrastructure statement that speaks louder than any marketing campaign. Fifteen individual high-security gold vaults were assembled from 350 tonnes of composite steel UL-class 2 vault panels, giving an estimated 500-tonne storage capacity for gold and other valuables. The Northern Miner
But even this monument to bullion ambition is being expanded. Silver Bullion is expanding storage capacity to 2,500 tonnes with 22 new vaults at its secure facility in Changi South, anticipating revenues of around S$2.5 billion for 2026 split evenly between gold and silver. worldgoldpricepro A S$2.5 billion revenue projection for a single Singapore-based precious metals company would have seemed fantastical five years ago. Today, given the rate at which inventory is moving, dealers describe it as conservative.
The strategic logic behind Singapore’s vault-building goes beyond current demand. “London took 200 years to build the infrastructure to become the centre of the world gold market,” said Albert Cheng, chief executive of the Singapore Bullion Market Association. “We have lots of work to do, but it won’t take us that long.” Silver Bullion Singapore’s advantage over London — and increasingly over Zurich and Dubai — is not merely geographic. It is jurisdictional. In consultation with key stakeholders including bullion banks and the Singapore Bullion Market Association, Singapore removed the Goods and Services Tax on Investment Precious Metals in October 2012, recognising that IPM are essentially financial assets, much like stocks, bonds, and other financial instruments that are typically GST-exempt. World Gold Council
Combined with Singapore’s permanent absence of capital gains tax and a regulatory framework whose stability is calibrated over decades rather than election cycles, this creates a storage and trading environment that global wealth managers find uniquely hospitable. Prior to the GST exemption, only 2% of world gold demand flowed through Singapore; the government aimed to increase that to between 10% and 15%. World Gold Council The events of early 2026 suggest that target may be within reach ahead of schedule.
Why Young Singaporeans Are Buying Gold Bars: The Demographic Revolution
The most consequential dimension of Singapore’s 2026 gold rush may be the one hardest to capture in a spreadsheet: the age of the people buying.
Alongside middle-aged customers, a growing number of younger investors in their 20s and 30s are entering the market, viewing gold as a long-term investment asset. Malay Mail This cohort is not buying gold the way their parents did — 916 jewellery selected for a wedding gift, to be locked in a drawer and forgotten. They are approaching it as a rational, data-driven portfolio allocation, comparing gold’s performance against Singapore REITs, US equities, and cryptocurrency across five-year rolling windows, and finding the metal increasingly persuasive.
What is driving this gold buying trend among younger Singaporeans is a confluence of anxieties that are distinctly of this era. They have watched two episodes of equity market carnage in a single decade. They have seen cryptocurrency oscillate between revolutionary asset class and spectacular fraud. They have observed, in real time, how quickly property liquidity evaporates when credit tightens. Gold, by contrast, is boring — and in 2026, boring is exactly what a significant slice of Singapore’s under-35 professional class is looking for.
In the first quarter of 2025, Singapore’s bullion sales reached a record 2.5 tonnes of gold bars and coins sold, a 35% increase compared to the previous year, and the highest quarterly demand since 2010. World Gold Council The Q1 2026 figures, when they are published, are expected to dwarf that record. Dealers describe a pattern in which younger buyers — many of them digital-native, fluent in live spot prices and LBMA certification requirements before they ever set foot in a dealership — are approaching their first gold purchase with more preparation than most first-home buyers bring to a property viewing.
Jewellery retailers are also seeing changes in customer behaviour, with more customers trading in older pieces purchased at lower prices for new designs or multiple items, reflecting both profit-taking and shifting preferences. worldgoldpricepro Angelina Lau of SK Jewellery Group has noted the evolution: the transaction is no longer purely sentimental. It is financial reasoning dressed in gold filigree.
Singapore vs. Hong Kong: The Race to Become Asia’s Gold Safe Haven
Singapore’s emergence as the region’s pre-eminent gold storage hub has not gone uncontested. The competition for the title of Asia’s gold safe haven is intensifying on multiple fronts.
Hong Kong plans to expand gold storage capacity to more than 2,000 tonnes in three years, up from its current 200 tonnes, and has launched renminbi-denominated contracts, mounting an explicit challenge to Singapore’s vault supremacy. Silver Bullion The proximity to mainland China — the world’s largest gold consumer and producer — gives Hong Kong a structural advantage that Singapore cannot replicate. “On the vaulting side, we are ahead in Singapore; on trading, I would say Hong Kong is ahead,” said Gregor Gregersen. “Both hubs have realised that the world is changing and they need to revisit their role when it comes to gold.” The Reserve
But Singapore holds advantages that are not easily dislodged. Political neutrality — the city is not perceived as being within either the Washington or Beijing sphere — is increasingly valued by the private wealth flows that drive high-value bullion storage decisions. “Vis-à-vis Dubai, we are a more credible financial center; vis-à-vis Hong Kong, we are seen as not part of China and therefore more neutral,” World Gold Council a government official noted in policy commentary that now reads as almost prophetically accurate. In a world fragmenting along geopolitical fault lines, neutrality is itself a premium product.
Switzerland remains the historical benchmark, but the LBMA’s own research has documented Singapore’s deliberate and systematic effort to build LBMA-equivalent frameworks over the past decade. Swiss refiner Metalor established regional operations in Singapore in 2013, the year after the GST exemption came into force. Major logistics firms — Brink’s, Malca-Amit, Loomis — have embedded significant Singapore operations. JPMorgan and UBS both offer bullion services from the city. The ecosystem that London took two centuries to build, Singapore has been attempting to construct in two decades.
The Broader Economic Calculus: Inflation, Interest Rates, and the Erosion of Paper Certainty
The surge in Singapore gold demand sits within a wider macro environment that is, for gold, almost perversely favourable.
Gold prices surged to record highs amid rising geopolitical tensions and strong investor demand supported by central bank purchases. Precious metals are projected to remain elevated into 2026, according to the World Bank’s Commodity Markets Outlook. News Directory 3 The traditional relationship between rising interest rates and weaker gold — higher yields make non-yielding bullion relatively less attractive — has broken down in 2026 in a way that is forcing even gold sceptics to revisit their models. The inflation being priced into the market is not the textbook demand-pull variety that central banks can cool with a sequence of rate hikes. It is geopolitically sourced, energy-driven, and supply-side in character — precisely the form that monetary policy is least equipped to address.
HSBC analysts emphasised that gold’s traditional safe-haven characteristics do not insulate it from significant price fluctuations. ANZ Bank issued guidance projecting gold would reach $5,800 per ounce during the second quarter of 2026. World Bank J.P. Morgan has published a year-end target of US$6,300. Even assuming significant volatility around those projections, the directional consensus among major institutional analysts is striking in its alignment: gold has further to run, and the structural drivers — central bank diversification away from dollar assets, geopolitical fragmentation, demographic shifts in investor preference — are not resolved by a ceasefire.
According to Bloomberg’s precious metals research desk, Singapore’s storage facilities are filling faster than at any point since the city formally positioned itself as a bullion hub. That rate of fill is not driven purely by crisis buyers. It reflects a long-term allocation decision being made, simultaneously, by sovereign wealth funds, family offices, retail investors, and twenty-six-year-olds who have been quietly reading the World Gold Council’s research on their lunch breaks.
Risks and Realities: What Could Reverse Singapore’s Gold Boom
Honest analysis demands a reckoning with the downside scenarios, and they are not trivial.
“We have seen more buyers than sellers over the past year, but more sellers are now entering the market, which is typical after strong price movements,” noted David Mitchell of Indigo Precious Metals. worldgoldpricepro The pattern he describes — later entrants buying near the top as earlier investors take profits — has preceded corrections in every previous gold cycle. At over US$5,000 per ounce, gold is priced for a world in which the Middle East crisis is both sustained and escalatory. Any credible diplomatic movement toward de-escalation would likely trigger a sharp correction, leaving buyers who entered at current levels nursing paper losses.
There is also the structural question of whether Singapore’s vault ambitions are outrunning the liquidity that would make them self-sustaining. “What really matters in this industry is building up liquidity,” said Gregersen. Both hubs have realised that the world is changing and they need to revisit their role when it comes to gold. Silver Bullion Storage capacity without trading depth is a warehouse, not a market. Singapore has the former in abundance; the latter remains a work in progress.
And yet — even applying the most conservative stress tests to the scenario — the case for Singapore as the defining Asian node in global gold infrastructure grows stronger with each passing quarter of the current crisis. The city has spent fourteen years building the regulatory, logistical, and fiscal architecture for exactly this moment. The demand has arrived.
The Unmistakable Signal: Singapore’s Gold Story Is Only Beginning
There is a particular kind of intelligence that operates in commodity markets — not the frenzied intelligence of a trading floor, but the slow, patient intelligence of capital seeking sanctuary over decades. It moves in response to tectonic forces: the fragmentation of great-power relationships, the erosion of confidence in paper systems, the generational transfer of wealth to cohorts who carry different memories and different instincts.
What Singapore’s gold rush of early 2026 represents, viewed through that longer lens, is not a crisis trade. It is a structural repositioning — of capital, of infrastructure, and of investor psychology — that the crisis has accelerated but not invented. The cranes above Changi South would have risen eventually. The young Singaporeans queuing at ValueMax would have found their way to bullion eventually. The Middle East has simply compressed the timeline.
The metal that outlasted the Roman Empire, the Ottoman Empire, and Bretton Woods is finding a new generation of custodians. They are arriving at the counter with spreadsheets on their phones and specific questions about LBMA certification. They are building vaults visible from the landing approach at one of the world’s busiest airports. They are, in their very deliberateness, making the most bullish possible argument for gold’s enduring relevance — not because the world is ending, but because they have decided, with clear eyes and careful calculation, that they would rather own some of it.
That calculation, repeated several hundred thousand times across the city-state and the broader region it serves, is what a gold rush looks like when it is driven not by panic, but by conviction.
Discover more from The Economy
Subscribe to get the latest posts sent to your email.


Are Asian stock markets rising in 2026?
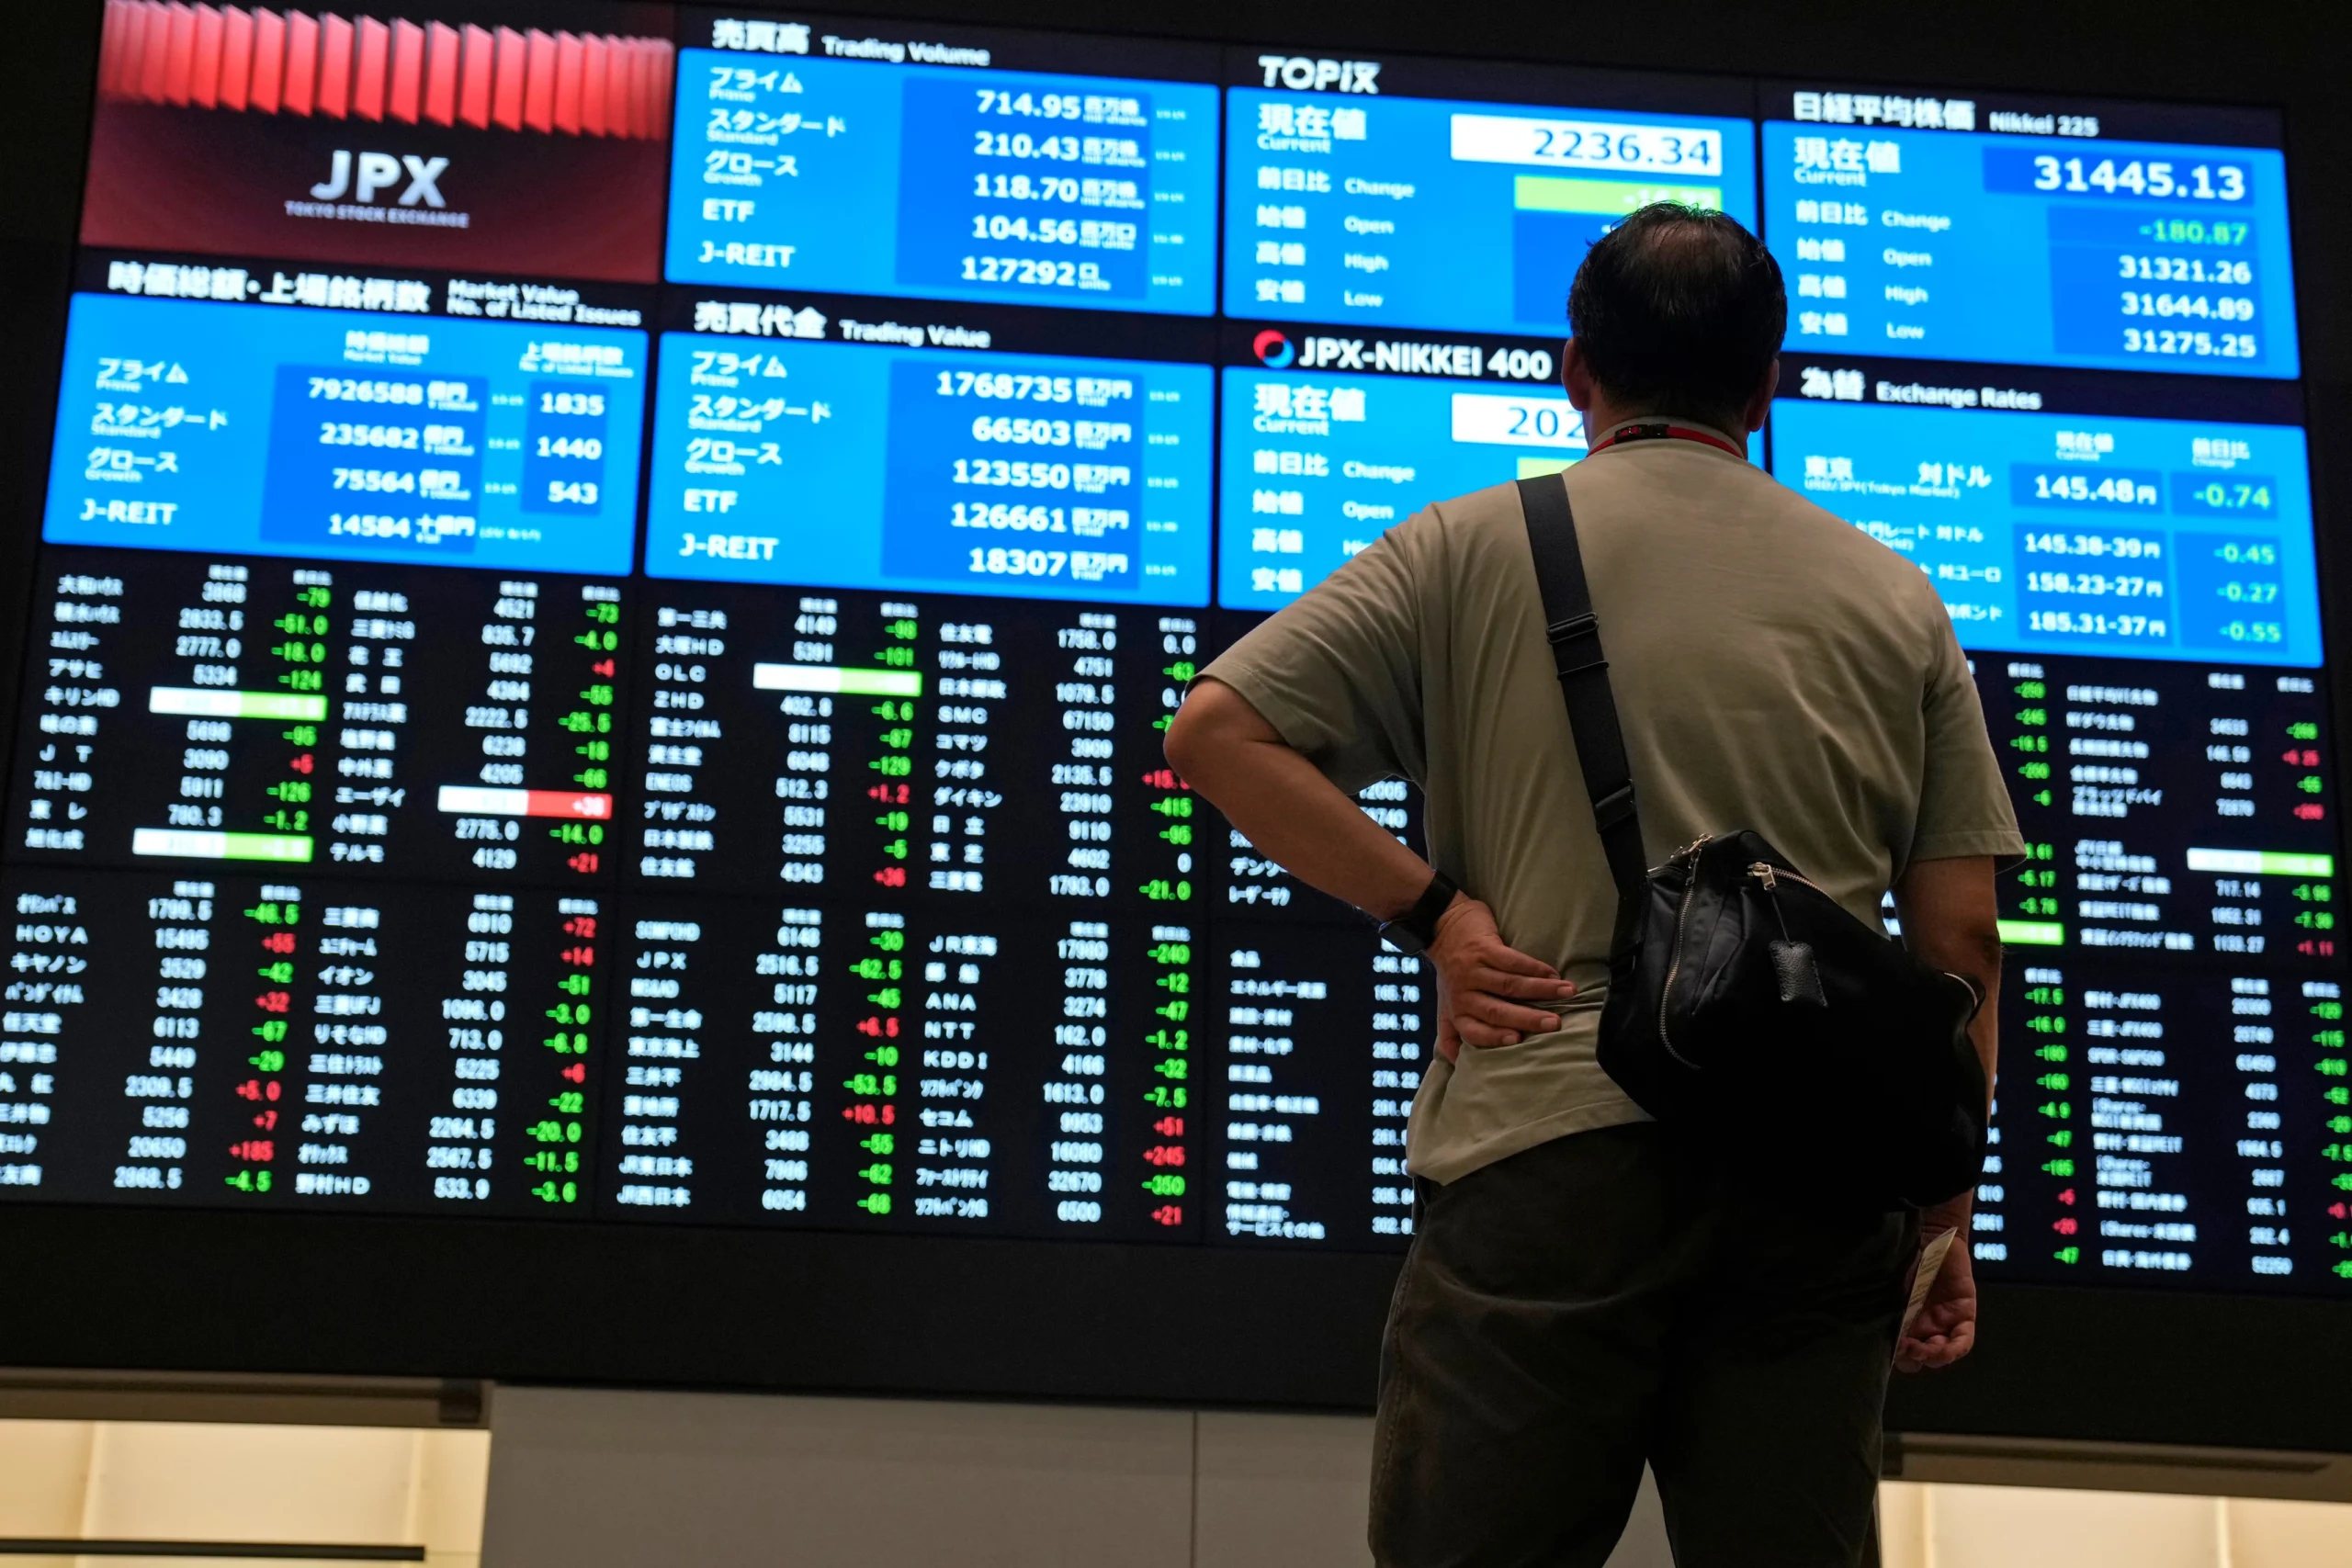
Most of them are, but for very different reasons. Japan’s Nikkei 225 is trading at levels roughly 44% higher than a year ago on continued AI-linked technology strength; China’s benchmark indices climbed to multi-year highs at the start of the year on AI optimism and signs of economic recovery; and Pakistan’s KSE-100 has been one of the most volatile large gainers globally, crossing record highs early in the year before enduring sharp single-session pullbacks in September. Understanding each market separately matters more than treating “Asia” as one trade.
Japan: A 15-Year-Plus Bull Run Meets a Hawkish Central Bank
The Nikkei 225 closed at 65,018.95 on September 18, 2026, gaining 1.38% on the session and sitting 44.34% above where it stood a year earlier, according to data compiled by Trading Economics. That move came even as the Bank of Japan raised its policy rate by 25 basis points to 1.25% — a widely expected but still consequential tightening step, as policymakers balance elevated inflation and wage growth against pressure from U.S. Treasury Secretary Scott Bessent for currency and trade cooperation. Japan’s annual inflation rate held at 1.9% in August, with core inflation at 1.7% — below the Bank of Japan’s 2% target for a seventh straight month, suggesting the central bank still has room to normalize policy gradually rather than aggressively.
Technology and AI-related names have led Japan’s rally, with chip-equipment and materials names such as Advantest and Lasertec posting some of the sharpest single-day gains, echoing similar advances on Wall Street. That correlation is a theme across the region: Asian equity performance in 2026 has tracked the U.S. AI-capex story almost as closely as it has tracked domestic fundamentals.
China: AI Optimism Meets an Overheating Warning
China’s equity markets opened 2026 on a tear. The benchmark CSI 300 Index advanced 1.6% to close at its highest level in four years on January 6, while the Shanghai Composite rose 1.5% to its strongest level since July 2015, fueled by sustained optimism over the country’s AI advances and early signs of broader economic recovery, according to Bloomberg. Materials and technology shares led the advance, and the rally coincided with a robust pipeline of onshore AI-related IPOs.
That said, the rally showed early signs of overheating even in January: the 14-day relative strength index on the Shanghai Composite climbed above 75 — firmly into technical overbought territory — a level it had not touched since the previous September. Momentum has been uneven since; by late July, the Shanghai Composite had pulled back to a 16-week low on the CSI 300 gauge even as the broader index posted modest daily gains, reflecting a market still working through the tension between AI-driven optimism and valuation discipline. On the macro side, the IMF’s own China growth revisions this year have tracked a similar push-pull, with earlier 2025 forecasts putting Chinese growth near 4.8% before moderating toward roughly 4.2% as trade and property-sector headwinds persist.
Malaysia and Singapore: Steady Gains, Regional Correlation
Malaysia’s FTSE Bursa Malaysia KLCI has spent much of 2026 grinding toward multi-year highs rather than posting dramatic single-day swings. The index touched a more-than-six-year high near 1,686 points in early January, according to New Straits Times, and by early September had climbed further to around 1,714–1,715 points, per Bursa Malaysia futures data reported by Bernama, Malaysia’s state news agency. Analysts at Rakuten Trade have described the index as being in a healthy uptrend across both short- and long-term timeframes, with pullbacks read as consolidation rather than a change in trend.
Singapore’s Straits Times Index has moved in tandem with regional sentiment through the year, trading in the high-3,900-point range during mid-2026 sessions alongside comparable moves in Hong Kong’s Hang Seng and South Korea’s Kospi — a reminder that Southeast Asian and Northeast Asian benchmarks remain tightly correlated on any given trading day, even when their underlying economic drivers differ.
Pakistan: The Region’s Most Volatile Outperformer
Featured Snippet Target: Pakistan’s KSE-100 Index began 2026 at a record high above 176,000 points, climbed further past 186,000 and 188,000 in the following days on institutional buying and expectations of a policy rate cut, but has since seen sharp single-session pullbacks — including a 3,078-point, 1.79% drop on September 10 — underscoring how the world’s best-performing frontier market in early 2026 has also been among its most volatile.
The Pakistan Stock Exchange’s rally traces back to a shift in domestic asset allocation: brokerage house Topline Securities described the move from fixed-income instruments into equities — driven by falling returns on traditional savings vehicles — as the primary fuel behind sustained liquidity and elevated valuations, according to coverage from Aaj News. Banking names including United Bank Limited, Habib Bank, and MCB, alongside energy majors like Oil and Gas Development Company, have repeatedly featured among the index’s top contributors on both up and down days.
By early September, the picture had turned choppier. The KSE-100 gained 399 points on September 4 to close at 175,328, per ARY News, before dropping over 3,000 points just days later on September 10 — a reminder that Pakistan’s rally, while historic in percentage terms, remains far more sensitive to single-session sentiment shifts than its larger regional peers.
The Cross-Market Pattern
Three threads tie these otherwise disconnected markets together in 2026. First, AI-linked capital spending is now a genuine cross-border driver — Japanese and Chinese tech names have both rallied on echoes of the same U.S. hyperscaler capex story. Second, central bank policy divergence is widening: Japan is tightening from historically ultra-loose settings, while Pakistan has been cutting rates to support a still-fragile broader economy. Third, frontier and emerging markets — Pakistan chief among them — are delivering far larger percentage swings, in both directions, than developed Asian benchmarks, rewarding investors who can tolerate volatility but punishing those who chase momentum without hedging for pullbacks.
The Bottom Line
Asia’s 2026 story is not one market but five distinct ones moving on different clocks — Japan’s AI-and-rate-hike rally, China’s optimism-versus-overheating tension, Malaysia and Singapore’s steadier regional drift, and Pakistan’s high-beta swings around a genuine structural re-rating. Anyone allocating across the region needs a market-by-market view rather than a single “Asia” thesis.
Next step: Track Bank of Japan policy meetings, China’s Politburo economic guidance sessions, and Pakistan’s State Bank Monetary Policy Committee decisions together — the three events, spaced through the remainder of 2026, are the clearest near-term catalysts for each market’s next move.
Discover more from The Economy
Subscribe to get the latest posts sent to your email.

The World Bank’s June 2026 assessment carries a phrase that should stop any investor mid-scroll: a “lost decade” of development for many emerging markets.
Global growth is projected to slow from 2.9% in 2025 to 2.5% in 2026 — the lowest rate since the COVID-19 pandemic — amid weaker prospects for energy-importing economies and those directly affected by hostilities.
Within that aggregate, Asia is splitting into two distinct groups. Understanding which side an economy falls on is now the primary emerging-market allocation decision.
Key Takeaways
- Global growth: 2.5% in 2026, firming in 2027–28 as energy supplies recover and trade strengthens.
- The revision was brutal. January 2026 projected 2.6% with an upward revision; June cut it.
- India remains the outlier. FY2026-27 growth of 6.6%, rebounding to 7.2% in FY2027-28.
- China decelerates. Growth slowing to 4.4% in 2026 from 4.9%.
- The 2020s are on track to be the weakest decade for global growth since the 1960s.
The Two Reports That Define 2026
The World Bank publishes Global Economic Prospects twice a year, and the gap between the January and June 2026 editions is the story.
January: Cautious Optimism
The January report described a global economy proving more resilient than anticipated despite persistent trade tensions and policy uncertainty, with growth easing to 2.6% in 2026 before rising to 2.7% in 2027 — an upward revision from the previous June forecast.
About two-thirds of that upgrade came from the United States alone.
June: The Energy Shock
By June, the Middle East conflict had driven sharp energy price increases and the projection fell to 2.5%, with emerging market and developing economies facing the weakest per capita income growth since the pandemic.
The Bank explicitly notes that the conflict’s impact on global trade has been partly offset by robust AI-related investment, while consensus inflation expectations picked up notably following the energy price surge. Local-currency bond yields and external bond spreads remained higher in commodity importers.
That last sentence is the whole emerging-market thesis in one line: commodity importers are paying more to borrow at exactly the moment they need to borrow more.
Asia’s Two Tiers
| Economy | Projection | Position |
|---|---|---|
| India | 6.6% FY26-27, 7.2% FY27-28 | Domestic-demand-led, upgraded |
| China | 4.4% in 2026 (from 4.9%) | Export-supported, stimulus-dependent |
| EMDEs (all) | 4.0% in 2026 (from 4.2%) | Slowing |
| EMDEs excl. China | 3.7% in 2026 | Flat versus 2025 |
| United States | 2.2% in 2026 | Tax-incentive supported |
The EMDE-excluding-China figure of 3.7%, unchanged from 2025, is the number that matters most and gets quoted least. Strip out China, and the developing world is not slowing — it simply is not accelerating. Stagnation at a level too low to close income gaps.
The India Case
India stands apart in the June projections. Growth is projected to moderate to 6.6% in FY2026-27 — a 0.1 percentage point upgrade relative to January — before rebounding to 7.2% in FY2027-28, a 0.6 point upgrade.
The moderation reflects private demand cooling under input cost pressures. The rebound reflects structural factors:
- Trade agreements. Implementation of major FTAs with the EU, UK and Australia is described as crucial to offsetting cooling merchandise demand from traditional Western markets.
- FDI sustainability. Trade agreements and structural business reforms are expected to sustainably support inflows across the forecast horizon.
- Fiscal trade-offs. Lower fuel taxes and GST reforms temporarily erode the revenue base, requiring a shift toward slower public capex growth and current spending cuts to avoid deficit spikes.
That last point is the underappreciated risk. India’s growth upgrade is partly financed by revenue concessions that must eventually be reversed or absorbed.
The China Case
China’s projected slowdown to 4.4% in 2026 came with an upward revision of four-tenths of a percentage point from the previous June forecast, attributed to fiscal stimulus and increased exports to non-US markets.
That revision has since been validated by trade data. The question for 2027 is whether export strength can persist if global demand slows to the 2.5% pace the Bank projects.
China’s position is structurally different from India’s: externally driven where India is domestically driven, stimulus-dependent where India is reform-dependent.
What the “Lost Decade” Framing Actually Means
The World Bank’s language is deliberately stark. If current forecasts hold, the 2020s are on track to be the weakest decade for global growth since the 1960s and too low to avert stagnation and joblessness in emerging market and developing countries.
The distributional evidence is concrete: at the end of 2025, nearly all advanced economies enjoyed per capita incomes exceeding their 2019 levels, but about one in four developing economies had lower per capita incomes than before the pandemic.
Chief Economist Indermit Gill framed the underlying tension precisely: the global economy has become less capable of generating growth while appearing more resilient to policy uncertainty — a divergence he warned cannot persist without fracturing public finance and credit markets.
Investment Implications by Tier
Tier 1 — Energy importers in the technology value chain. India, Vietnam, Malaysia, Taiwan, Korea. AI-related export revenues offset higher energy costs. Currency and equity performance has held up.
Tier 2 — Energy exporters outside the conflict zone. Gulf states excluding those directly affected, parts of Africa and Latin America. Favourable terms of trade, fiscal space expanding.
Tier 3 — Energy importers outside the technology chain. Pakistan, Bangladesh, Sri Lanka, Kenya, much of Sub-Saharan Africa. Higher import bills, higher borrowing costs, no offsetting export windfall.
Tier 3 is where sovereign stress concentrates. Higher local-currency bond yields and wider external spreads in commodity importers mean refinancing costs rise as fiscal positions deteriorate.
What This Means for the Global Market in 2027
The 2027 recovery is conditional on two assumptions. Activity is expected to firm in 2027–28 as energy supplies recover and trade strengthens. Both require the conflict to de-escalate. Neither is guaranteed.
AI adoption is the identified upside. The Bank names artificial intelligence adoption, clean energy investment and regional trade agreements as potential long-term recovery catalysts. Only the first is currently delivering at scale.
Sovereign debt is the accumulating risk. Elevated yields in commodity importers compound every year they persist. A 2027 refinancing wave at current spreads would strain multiple frontier sovereigns simultaneously.
Regional trade agreements are the underrated policy lever. India’s FTA implementation is the clearest test case. If it delivers the projected FDI and export offset, it becomes a template for the rest of emerging Asia.
Compare the IMF and World Bank carefully. The Fund projects 3.0% for 2026; the Bank projects 2.5%. The difference is methodological — PPP versus market exchange rate weighting — not a disagreement about the world.
Frequently Asked Questions
What is the World Bank’s global growth forecast for 2026?
The June 2026 Global Economic Prospects projects global growth slowing to 2.5% in 2026, down from 2.9% in 2025 — the lowest rate since the pandemic.
What is India’s projected GDP growth?
India is projected to grow 6.6% in FY2026-27 before rebounding to 7.2% in FY2027-28, both upgrades relative to January 2026 projections.
Why are World Bank and IMF forecasts different?
The World Bank weights using market exchange rates while the IMF uses purchasing-power-parity weights, which gives more weight to faster-growing emerging economies.
What does “lost decade” mean for emerging markets?
The Bank warns the 2020s could be the weakest decade for global growth since the 1960s, with roughly one in four developing economies having lower per capita incomes at end-2025 than in 2019.
Discover more from The Economy
Subscribe to get the latest posts sent to your email.

S&P 500 at 7,620, FTSE at 10,698, Nikkei at 64,136. Compare US tech, European dividends and Asian growth as three central banks split on rates.
Executive Summary / Key Takeaways
- The three major regions are now priced off three different monetary regimes: the Fed hiking into strength, the ECB hiking into weakness, and the Bank of Japan normalising from near zero.
- On the day of the Fed’s hike, the Dow fell more than 600 points while the Nasdaq finished close to flat — a clean demonstration that “US equities” is no longer a single exposure.
- European indices held up: the FTSE 100 sat at 10,697.57 (+0.44%) while the DAX at 25,440.81 and Euro Stoxx 50 at 6,260.38 slipped.
- Japan outperformed on currency mechanics, with the Nikkei at 64,136 and the Topix at 4,094.
- Yardeni Research cut its year-end S&P 500 target to 7,900 from 8,400, citing yield pressure from rising energy prices.
Regional equity allocation has spent a decade being a low-conviction decision. Global indices moved together, US technology led, and everything else was a funding source. September 2026 broke that pattern within a single trading week.
The trigger was monetary divergence. The Federal Reserve raised rates to 3.75%–4.00% on 16 September. The ECB had already lifted its deposit rate to 2.5% on 10 September. The Bank of England held at 3.75% on a 6-3 split on 17 September, and the Bank of Japan is expected to hike on 18 September.
Four decisions, four different directions of travel, four different equity responses. That is the environment retail investors and portfolio managers now have to allocate into.
2. Core Market Analysis
2.1 The comparison matrix
| Region / Index | Level | Move | Monetary regime | Primary source |
|---|---|---|---|---|
| S&P 500 (US) | 7,619.98 | -0.48% | Fed tightening; ≥1 more hike signalled | Yahoo Finance |
| Nasdaq Composite (US) | 26,186.41 | -0.56% | Duration-sensitive; held up on Fed day | Yahoo Finance |
| Dow Jones (US) | 52,421.20 | -0.29% | Fell 600+ pts on the hike itself | Yahoo Finance |
| FTSE 100 (UK) | 10,697.57 | +0.44% | BoE on hold at 3.75% | Yahoo Finance |
| DAX (Germany) | 25,440.81 | -0.50% | ECB at 2.5% deposit rate | Yahoo Finance |
| CAC 40 (France) | 8,117.78 | -0.76% | ECB at 2.5% deposit rate | Yahoo Finance |
| Euro Stoxx 50 | 6,260.38 | -1.02% | Weakest major European print | Yahoo Finance |
| Nikkei 225 (Japan) | 64,136 | +0.33% | BoJ normalising; weak yen tailwind | Trading Economics |
| Hang Seng (HK) | 24,713 | +0.2% | Pegged; HKMA hiked to 4.25% | Trading Economics |
| VIX | 17.10 | +7.95% | Volatility bid but not stressed | Yahoo Finance |
2.2 US: the index is not the market
The single most revealing datapoint of the week was the internal dispersion on Fed day. Stocks turned lower during Warsh’s press conference as markets read his remarks as hawkish, with the Dow leading losses down more than 700 points at one stage — over 1.6% — while the S&P 500 declined 0.4% and the Nasdaq slid just below flat, Yahoo Finance reported.
Conventional rate logic says long-duration growth should suffer most when yields rise. It did not. The cyclical, energy-exposed and rate-sensitive parts of the market took the damage instead: J.B. Hunt Transport fell 12.64% after warning on earnings and rising operating costs, Diamondback Energy dropped 8% amid concerns over inflation, rising Treasury yields and crude-market geopolitical risk, and APA Corp fell 5.2%, according to TheStreet’s market coverage. Optical and photonics names rebounded, with Coherent and Lumentum each up around 6%.
The forward view has been trimmed. Yardeni Research cut its year-end S&P 500 target to 7,900 from 8,400 — implying 4.1% upside from Tuesday’s close of 7,585.73 rather than the 11% its previous estimate implied — citing higher Treasury yields due to rising energy prices and increased downturn risk over the next three to six months, CNBC reported.
2.3 Europe: the dividend case
European equities are not outperforming on growth. Euro-area output is projected around 1.3% for 2026 by the IMF, with the region benefiting less than others from the technology-driven investment boost and lingering energy-price effects still dragging on manufacturing.
They are outperforming, where they are, on payout and valuation. With the ECB deposit rate at 2.5% — the loosest of the major blocs — the yield competition from cash and short-dated bonds is materially weaker in Europe than in the US, where the funds rate is now 3.75%–4.00% and the 10-year has topped 5%. That relative-yield arithmetic is the structural argument for European income equity in this cycle, and it holds regardless of European growth being mediocre.
The UK sits awkwardly between the two. The FTSE’s commodity and energy weighting makes it a partial beneficiary of the same oil shock hurting importers elsewhere, which explains its positive print against a broadly weaker European tape.
2.4 Asia: growth with a currency asterisk
Japan’s advance came from yen weakness after the Fed decision, which improved the earnings outlook for export-focused industries, Trading Economics noted. Hong Kong’s caution came from the HKMA following the Fed with a hike to 4.25%, pressuring property.
The regional growth case is real — East Asia and Pacific is projected at 4.2% for 2026 and South Asia at 6.3% by the World Bank — but a meaningful share of recent Japanese equity return has been a currency effect that BoJ normalisation will erode.
3. Structural Drivers and Competitor Gaps
The gap in most comparative coverage is treating this as a regional rotation call. It is better understood as three separate factor exposures that happen to have geographic labels:
- US large-cap technology is a duration and AI-capex exposure. It held up on Fed day because the AI investment cycle is currently a stronger driver than the discount rate. Both the IMF and World Bank cite broader AI adoption as the principal upside risk to global growth. If that capex cycle cools, the rate sensitivity reasserts itself immediately.
- European income equity is a relative-yield exposure. Its attractiveness is a function of the ECB-Fed policy gap, not of European fundamentals. Narrow the gap and the case weakens.
- Asian growth equity is partly a currency exposure. Particularly in Japan, where the return decomposition between earnings and FX is doing more work than most allocators acknowledge.
Correctly labelled, these are not substitutes for one another. The diversification benefit of holding all three is higher in 2026 than at any point in the past decade — which is the practical conclusion most aggregator coverage fails to reach.
4. Key Implications for Stakeholders
Retail investors. A global index fund currently buys you a heavy weighting to a single factor: US technology and its AI capital-expenditure cycle. If that is the intended exposure, fine. If not, deliberate regional allocation is required to get it.
Portfolio managers. Volatility is bid but not stressed, with the VIX at 17.10 — an unusually calm reading given four central bank decisions in eight days and crude above $100. That combination favours adding hedges while they remain inexpensive rather than after a repricing.
Income investors. The yield hurdle is regional now. In the US, equity income competes against a 10-year above 5%. In the euro area, it competes against a 2.5% deposit rate. The same dividend yield is a materially better proposition in one market than the other.
Risk teams. Cross-regional correlation assumptions built on the 2015–2021 regime are stale. Three distinct monetary cycles produce genuinely differentiated drawdown paths.
5. Frequently Asked Questions
Q1: Why did the Nasdaq hold up while the Dow fell after the Fed hike?
The damage concentrated in cyclical, transport and energy-exposed names rather than long-duration technology. Investors are currently treating the AI capital-expenditure cycle as a stronger earnings driver than the discount rate is a valuation headwind.
Q2: Are European dividend stocks more attractive than US equities now?
On relative yield, arguably. The ECB deposit rate is 2.5% against a US funds rate of 3.75%–4.00% and a 10-year Treasury above 5%, so European equity income faces far weaker competition from cash and bonds. European growth, however, remains around 1.3%.
Q3: What is the current S&P 500 level and forecast?
The S&P 500 was at 7,619.98. Yardeni Research cut its year-end target to 7,900 from 8,400, implying roughly 4% upside, citing higher Treasury yields driven by rising energy prices.
Q4: Which region offers the best equity growth in 2026?
Asia on headline growth — East Asia and Pacific at 4.2% and South Asia at 6.3% per World Bank forecasts. But a meaningful share of recent Japanese equity returns reflects yen weakness rather than earnings, and Bank of Japan normalisation erodes that tailwind.
Discover more from The Economy
Subscribe to get the latest posts sent to your email.

Silver Price Today: Why the Xi-Trump AI Standoff Is Fueling a Safe-Haven Rally

Citibank & Dólar Estadounidense: Forex Playbook After the Xi-Trump Truce

How the Trump-Xi White House Summit Is Reshaping Mortgage Rates Today for Real Estate Investors

Indonesia Navigates Mega-Project Risks as China and Russia Eye the 2,772km Trans-Kalimantan Railway

Trump-Xi 2026 Summit Takeaways: The Trade Truce, Taiwan, and the AI Divide

Solar Panel Installation Cost in 2026: Why the Math Changed Overnight

Business Insurance: What Coverage You Actually Need and What It Costs in 2026

Auto Insurance Quotes: How to Get the Lowest Rate Without Losing Coverage

Huntington Online Banking: Full Features, Fees, and How It Compares in 2026

Apply for a Bank Account Online: What You Need and How Long It Actually Takes

World’s Largest Economies: Ranking the Top Global Powers

Business Loan: A Complete 2026 Guide to Rates, Types, and Qualifying

Fast Invoice Factoring: How to Turn Unpaid Invoices Into Cash Within 24 Hours

Investment Banking Services: What They Cost and How to Choose the Right Firm in 2026

Top 30 Stocks for Investment in PSX for Massive ROI in 2026

SpaceX Starship Flight 14: First Orbital Attempt & Starlink V3 Launch Explained

Oil Prices Break $100 in 2026: Middle East Conflict & Energy Markets

BRICS+ Cross-Border Payments 2026: Interoperability Explained

AI Chip Stocks 2026: The Best Semiconductor Investments Beyond Marvell

Fidelity Investments Review 2026: SPAXX Yields & Zero-Fee Funds

Tween Back-to-School Trends 2026: What’s Driving the $85B Season

10-Year Treasury Yield Hits 4.80%: What It Means for Rates & Portfolios

Shein Clothes Quality & Safety in 2026: What Lab Tests Show

China’s US$10.8 Billion Trade Shortcut: Why the Pinglu Canal Matters

MRVL Earnings 2026: Why Marvell Sank Despite Beating Estimates

IMF & World Bank 2026 Global Economic Outlook: Growth, Inflation, Debt

High-CPM Finance Niches 2026: Publisher Monetization Blueprint

Middle East War Economics 2026: Oil Prices & Energy Markets
-

 Markets & Finance9 months ago
Top 15 Stocks for Investment in 2026 in PSX: Your Complete Guide to Pakistan’s Best Investment Opportunities
-

 Analysis7 months ago
Johor’s Investment Boom: The Hidden Costs Behind Malaysia’s Most Ambitious Economic Surge
-

 Analysis7 months ago
Top 10 Stocks for Investment in PSX for Quick Returns in 2026
-

 Banks8 months ago
Best Investments in Pakistan 2026: Top 10 Low-Price Shares and Long-Term Picks for the PSX
-

 Analysis8 months ago
Brazil’s Rare Earth Race: US, EU, and China Compete for Critical Minerals as Tensions Rise
-

 Investment9 months ago
Top 10 Mutual Fund Managers in Pakistan for Investment in 2026: A Comprehensive Guide for Optimal Returns
-

 Global Economy9 months ago
15 Most Lucrative Sectors for Investment in Pakistan: A 2025 Data-Driven Analysis
-

 Global Economy9 months ago
Pakistan’s Export Goldmine: 10 Game-Changing Markets Where Pakistani Businesses Are Winning Big in 2025