
Opinion
Google Doubles Down on AI with $185bn Spend After Hitting $400bn Revenue Milestone


Explore how Google’s parent Alphabet plans to double AI investments to $185bn in 2026 amid record $402bn 2025 revenue, analyzing implications for tech innovation and markets.
Google’s parent company Alphabet has announced plans to nearly double its capital expenditures to a staggering $175-185 billion in 2026—a figure that exceeds the GDP of many nations and underscores the ferocious intensity of the artificial intelligence race. This unprecedented AI investment doubling impact comes on the heels of a milestone achievement: Alphabet’s annual revenues exceeded $400 billion for the first time, reaching precisely $402.836 billion for 2025, a testament to the search giant’s enduring dominance across digital advertising, cloud computing, and emerging AI services.
The announcement, delivered during Alphabet’s fourth-quarter earnings report on Wednesday, sent ripples through financial markets as investors grappled with a paradox that defines this technological moment: spectacular results shadowed by even more spectacular spending plans. It’s a wager on the future, where compute capacity—the raw processing power that fuels AI breakthroughs—has become as strategic as oil reserves once were to industrial economies.
A Record-Breaking Year for Alphabet
The numbers tell a story of momentum. Alphabet’s Q4 2025 revenue reached $113.828 billion, up 18% year-over-year, with net income climbing almost 30% to $34.46 billion—performance that surpassed Wall Street’s expectations and reinforced the company’s position as a technology juggernaut. For context, this quarterly revenue alone exceeds the annual GDP of countries like Morocco or Ecuador, illustrating the sheer scale at which Alphabet operates.
What’s particularly striking about the Alphabet 400bn revenue milestone is not merely the figure itself, but the diversification behind it. While Google Search remains the crown jewel—Search revenues grew 17% even as critics proclaimed its obsolescence in the AI era—other divisions have matured into formidable revenue engines. YouTube’s annual revenues surpassed $60 billion across ads and subscriptions, transforming what began as a video-sharing platform into a media empire rivaling traditional broadcasters. The company now boasts over 325 million paid subscriptions across Google One, YouTube Premium, and other services, creating recurring revenue streams that cushion against advertising volatility.
Perhaps most impressive is the trajectory of Google Cloud, the division housing the company’s AI infrastructure and enterprise solutions. As reported by CNBC, Google Cloud beat Wall Street’s expectations, recording a nearly 48% increase in revenue from a year ago, reaching $17.664 billion in Q4 alone. This acceleration—outpacing Microsoft Azure’s growth for the first time in years, according to industry analysts—signals that Google’s decade-long cloud computing growth journey is finally paying dividends in the AI era.
The AI Investment Surge: Fueling Tomorrow’s Infrastructure
To understand the magnitude of Google’s 2026 Google capex forecast analysis, consider this: the company spent $91.4 billion on capital expenditures in 2025, already a substantial sum. The midpoint of the new forecast—$180 billion—represents a near-doubling that far exceeded analyst predictions. According to Bloomberg, Wall Street had anticipated approximately $119.5 billion in spending, making Alphabet’s actual projection roughly 50% higher than expected.
Where is this money going? CFO Anat Ashkenazi provided clarity: approximately 60% will flow into servers—the specialized chips and processors that train and run AI models—while 40% will build data centers and networking equipment. This AI infrastructure spending trends follows a pattern visible across Big Tech: Alphabet and its Big Tech rivals are expected to collectively shell out more than $500 billion on AI this year, with Meta planning $115-135 billion in 2026 capital investments and Microsoft continuing its own aggressive ramp-up.
But Google’s spending stands apart in scope and strategic rationale. During the earnings call, CEO Sundar Pichai was remarkably candid about what keeps him awake: compute capacity. “Be it power, land, supply chain constraints, how do you ramp up to meet this extraordinary demand for this moment?” he said, framing the challenge not merely as buying more hardware but as orchestrating a logistical feat involving energy grids, real estate, and global supply chains.
The urgency stems from concrete demand. Ashkenazi noted that Google Cloud’s backlog increased 55% sequentially and more than doubled year over year, reaching $240 billion at the end of the fourth quarter—future contracted orders that represent customers committing billions to Google’s AI and cloud services. This isn’t speculative investment; it’s infrastructure to fulfill orders already on the books.
Gemini’s Meteoric Rise and the Monetization Question
At the heart of Google’s Google earnings AI strategy sits Gemini, the company’s flagship artificial intelligence infrastructure model that competes directly with OpenAI’s GPT and Anthropic’s Claude. The progress has been striking: Pichai said on the call Wednesday that its Gemini AI app now has more than 750 million monthly active users, up from 650 million monthly active users last quarter. To put this in perspective, that’s roughly one-tenth of the global internet population engaging with Google’s AI assistant monthly, a user base accumulated in just over a year since Gemini’s public launch.
Even more impressive from a technical standpoint: Gemini now processes over 10 billion tokens per minute, handling everything from simple queries to complex multi-step reasoning tasks. Tokens—the fundamental units of text that AI models process—serve as a rough proxy for computational workload, and 10 billion per minute suggests processing demands equivalent to analyzing thousands of novels simultaneously, every second of every day.
Yet scale alone doesn’t guarantee profitability, which makes another metric particularly significant: “As we scale, we are getting dramatically more efficient,” Pichai said. “We were able to lower Gemini serving unit costs by 78% over 2025 through model optimizations, efficiency and utilization improvements.” This 78% cost reduction addresses a critical concern in the AI industry—whether these computationally intensive services can operate economically at scale. Google’s answer, backed by a decade of experience building custom Tensor Processing Units (TPUs), appears to be yes.
The enterprise market is responding. Pichai revealed that Google’s enterprise-grade Gemini model has sold 8 million paying seats across 2,800 companies, demonstrating that businesses are willing to pay for AI capabilities integrated into their workflows. And in perhaps the year’s most significant partnership, Google scored one of its biggest deals yet, a cloud partnership with Apple to power the iPhone maker’s AI offerings with its Gemini models—a relationship announced just weeks ago that positions Google’s AI as the backbone of Siri’s next-generation intelligence across billions of Apple devices.
Economic and Competitive Implications
The question hovering over these announcements—implicit in the stock’s initial after-hours volatility—is whether this level of spending represents visionary investment or reckless extravagance. Alphabet’s shares fluctuated wildly following the announcement, falling as much as 6% before recovering to close the after-hours session down approximately 2%, a pattern reflecting investor ambivalence.
On one hand, the numbers justify optimism. Alphabet’s advertising revenue came in at $82.28 billion, up 13.5% from a year ago, demonstrating that the core business remains robust even as AI reshapes search behavior. The company’s operating cash flow rose 34% to $52.4 billion in Q4, though free cash flow—what remains after capital expenditures—compressed to $24.6 billion as spending absorbed incremental gains.
This dynamic reveals the tension at the heart of Google’s strategy. As Fortune observed, Alphabet is effectively asking investors to underwrite a new phase of corporate identity, one where financial discipline is measured less by near-term margins and more by long-term platform positioning. The bet: that cloud computing growth, AI monetization, and infrastructure advantages will compound into durable competitive moats worth far more than the capital deployed today.
Competitors face similar calculations. Microsoft, through its partnership with OpenAI, has poured tens of billions into AI infrastructure. Meta has committed to comparable spending, reorienting around AI after its metaverse pivot stumbled. Amazon, reporting earnings shortly after Alphabet, is expected to announce substantial increases to its own already-massive data center buildout. What emerges is a kind of corporate MAD doctrine—Mutually Assured Development—where no major player can afford to fall behind in compute capacity lest they cede the next platform to rivals.
The Geopolitical and Environmental Dimensions
Yet spending at this scale extends beyond corporate strategy into geopolitical and environmental realms. Building data centers capable of training frontier AI models requires not just capital but also land, water for cooling, and—most critically—electrical power at scales that strain regional grids. Alphabet’s December acquisition of Intersect, a data center and energy infrastructure company, for $4.75 billion signals recognition that power availability, not just chip availability, will constrain AI development.
The environmental implications deserve scrutiny. Each data center powering Gemini or Cloud AI services draws megawatts continuously—power equivalent to small cities. While Alphabet has committed to operating on carbon-free energy, the physics of AI training and inference means energy consumption will rise alongside model sophistication. The 78% efficiency improvement Pichai cited helps, but the absolute energy footprint still expands as usage scales.
Economically, this spending creates ripples. Nvidia, the dominant supplier of AI training chips, stands to benefit enormously—Google announced it will be among the first to offer Nvidia’s latest Vera Rubin GPU platform. Construction firms building data centers, utilities expanding power infrastructure, even communities hosting these facilities all feel the effects. There’s an argument that Alphabet’s capital deployment, alongside peers’ spending, constitutes one of the largest peacetime infrastructure buildouts in history, comparable in scope if not purpose to the interstate highway system or rural electrification.
Looking Ahead: Risks and Opportunities
As 2026 unfolds, several questions will determine whether Google’s massive AI investment doubling impact delivers the returns shareholders hope for:
Can monetization scale with costs? Google Cloud’s 48% growth and expanding margins suggest AI products are finding paying customers, but the company must convert Gemini’s 750 million users into revenue beyond advertising displacement. Enterprise adoption offers higher margins than consumer services, making the 8 million paid enterprise seats a metric to watch quarterly.
Will compute constraints ease or worsen? Pichai’s comments about supply limitations—even after increasing capacity—suggest the industry may face bottlenecks in chip production, power availability, or skilled workforce. If constraints persist, Google’s early aggressive spending could prove advantageous, locking in capacity competitors struggle to access.
How will regulators respond? Antitrust scrutiny of Google continues globally, with particular focus on search dominance and competitive practices. Massive AI infrastructure spending, while ostensibly competitive, could draw questions about whether such capital intensity creates barriers to entry that stifle competition. Smaller AI companies lack the resources to compete at this scale, potentially concentrating power among a handful of tech giants.
What about returns to shareholders? Operating cash flow remains strong, but free cash flow compression raises questions about capital allocation. Alphabet maintains a healthy balance sheet with minimal debt, providing flexibility, yet some investors may prefer share buybacks or dividends over infrastructure bets with uncertain timelines. The company must balance immediate shareholder returns against investing for the next platform era.
Can efficiency gains continue? The 78% cost reduction in Gemini serving costs represents remarkable progress, but such improvements typically follow S-curves—rapid gains initially, then diminishing returns. Whether Google can sustain this pace of efficiency improvement will significantly impact the unit economics of AI services.
The Verdict: A Necessary Gamble?
Standing back from the earnings minutiae, Alphabet’s announcements reflect a broader reality about the artificial intelligence infrastructure transformation sweeping through technology: this revolution requires infrastructure at scales previously unimaginable. When Pichai describes being “supply-constrained” despite ramping capacity, when backlog more than doubles to $240 billion, when 750 million users adopt a product barely a year old—these aren’t signals of exuberance but of demand that risks outstripping supply.
The $175-185 billion question, then, isn’t whether Google should invest heavily in AI—that seems necessary just to maintain position—but whether the eventual returns justify the opportunity costs. Every dollar flowing into data centers and GPUs is a dollar not returned to shareholders, not spent on other innovations, not held as buffer against economic uncertainty. As The Wall Street Journal reported, Google’s expectations for capex increases exceed the forecasts of its hyperscaler peers, making this the most aggressive bet among already-aggressive competitors.
Yet perhaps that’s precisely the point. In a technological inflection as profound as AI’s emergence, the risk may lie less in spending too much than in spending too little—in optimizing for near-term cash flows while competitors build capabilities that define the next decade of computing. Google’s search dominance, once seemingly eternal, faces challenges from AI-native interfaces. Cloud computing, once dominated by Amazon, has become fiercely competitive. Advertising, the golden goose, must evolve as AI changes how people seek information.
From this vantage, the $185 billion isn’t profligacy but pragmatism—the cost of remaining relevant as the technological landscape shifts beneath every player’s feet. Whether it proves visionary or wasteful won’t be clear for years, but one conclusion seems certain: Google has committed, irrevocably, to the belief that the AI future requires infrastructure built today, at scales that once would have seemed absurd. For better or worse, the die is cast.
Key Takeaways
- Alphabet’s 2025 revenue: $402.836 billion, marking the first time exceeding $400 billion annually
- Q4 2025 performance: $113.828 billion revenue (up 18% YoY), $34.46 billion net income (up 30% YoY)
- 2026 capital expenditures forecast: $175-185 billion, nearly doubling from $91.4 billion in 2025
- Google Cloud growth: 48% YoY revenue increase to $17.664 billion in Q4, with $240 billion backlog
- Gemini AI adoption: 750 million monthly active users, with 78% reduction in serving costs over 2025
- YouTube milestone: Over $60 billion in annual revenue across advertising and subscriptions
- Enterprise momentum: 8 million paid Gemini enterprise seats across 2,800 companies
As the artificial intelligence infrastructure race intensifies, Google’s historic spending commitment positions the company at the forefront—but also exposes it to scrutiny about returns, sustainability, and the wisdom of betting so heavily on compute capacity as the path to AI dominance. The coming quarters will reveal whether this gamble reshapes technology’s future or becomes a cautionary tale about the perils of following competitors into ever-escalating capital commitments.
Discover more from The Economy
Subscribe to get the latest posts sent to your email.


Development Finance
Indonesia Navigates Mega-Project Risks as China and Russia Eye the 2,772km Trans-Kalimantan Railway
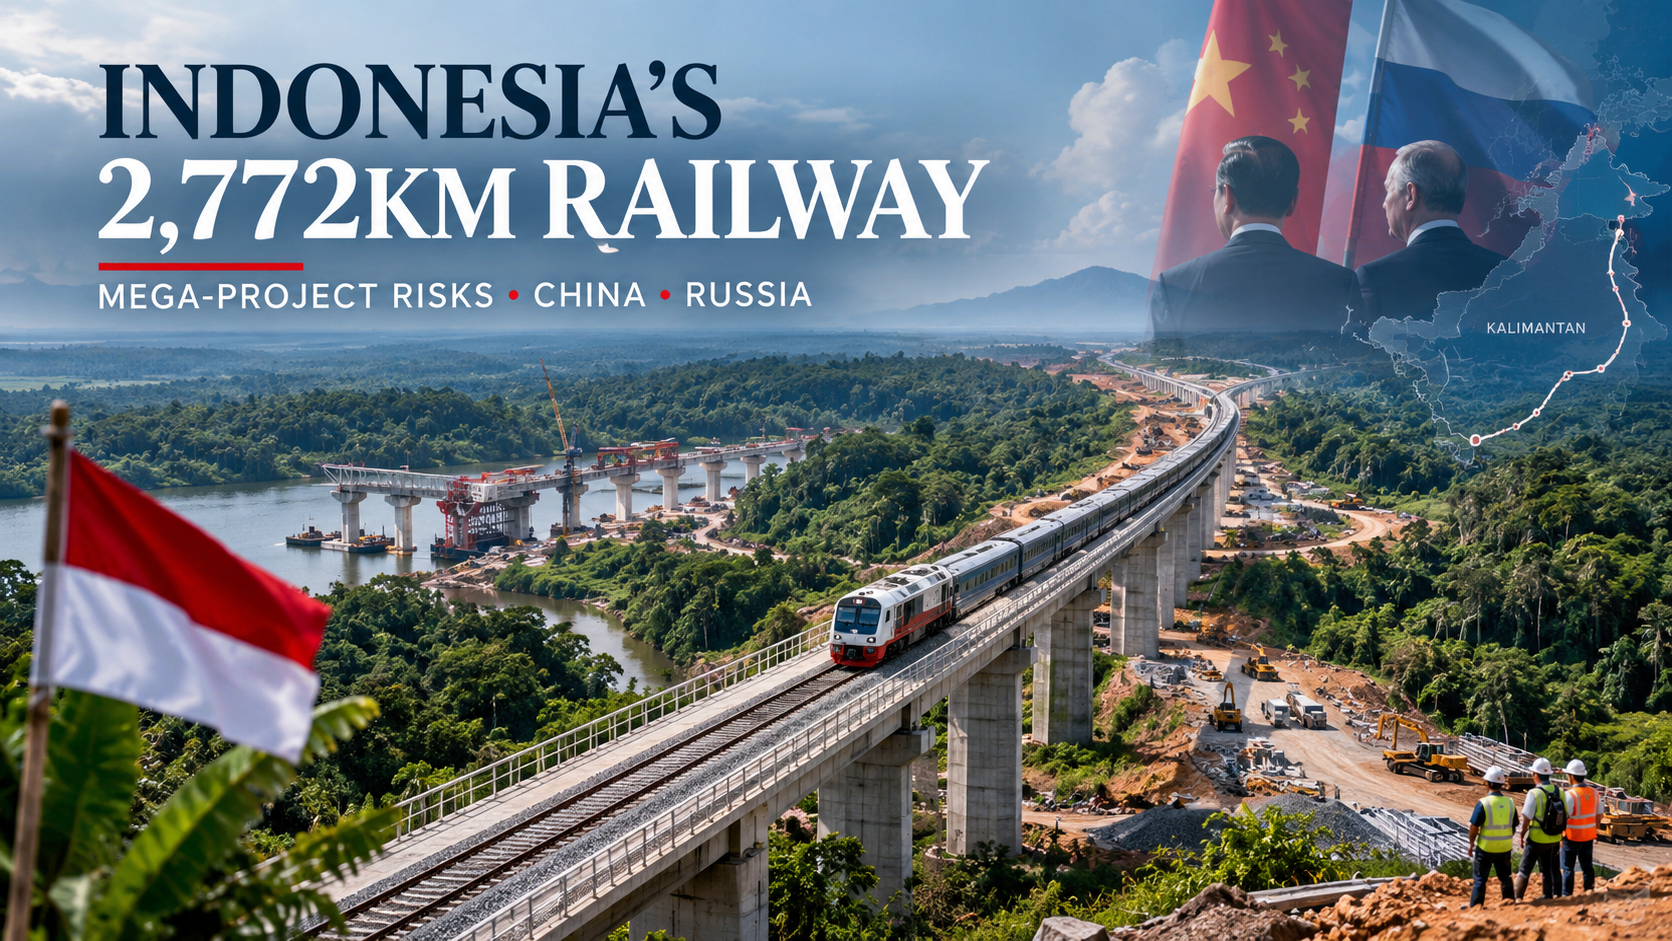
Indonesia is looking to foreign investors—primarily China and Russia—to help fund the ambitious 2,772-kilometer Trans-Kalimantan railway. The sprawling network aims to transform the resource-rich island of Borneo by vastly improving the transportation of minerals and passengers. However, as Jakarta maps out the future of its national rail infrastructure, financial hangovers from previous mega-projects are dictating a far more cautious approach to international commercial agreements.
While the completion of Southeast Asia’s first high-speed rail line between Jakarta and Bandung initially boosted confidence, its crippling cost overruns—alongside the recently stalled underground metro project in Bali—have analysts and government watchdogs warning against the unmitigated risks of foreign-backed debt traps.
The Trans-Kalimantan Vision: Minerals, Connectivity, and Foreign Capital
The Trans-Kalimantan railway is a central pillar of Indonesia’s broader National Railway Master Plan, which targets an expanded 12,100 km of operational railways by 2030. The initial phases aim to construct a 730-kilometer rail link connecting South, Central, and East Kalimantan. The railway will be crucial for the logistical transport of commodities and will eventually integrate with Indonesia’s new capital city, Nusantara.
According to statements by Indonesia’s Transportation Minister, Dudy Purwagandhi, the government is actively exploring foreign investment to shoulder the immense costs of the undertaking. Both Beijing and Moscow have expressed strong interest in the project, seeing it as a prime opportunity to deepen their economic footprint in Southeast Asia.
However, attracting the capital is only half the battle. Negotiating terms that protect Indonesia’s sovereign and economic interests is where the true challenge lies.
The “Whoosh” Warning: High-Speed Rail’s Lingering Debt
If Jakarta needs a blueprint on what to avoid, it only has to look at “Whoosh”—the Jakarta-Bandung high-speed rail. Originally championed as a symbol of Indonesian modernization and a flagship of China’s Belt and Road Initiative, the project broke ground in 2016 with an estimated price tag of $5.5 billion.
By the time it became operational in late 2023, complications ranging from delayed land acquisitions to the COVID-19 pandemic pushed the total project cost past $7.2 billion. The resulting cost overruns of between $1.2 billion and $1.9 billion forced Indonesian state-owned entities to take on heavy financial burdens.
Furthermore, lower-than-anticipated passenger revenues have generated operating losses reaching roughly $258 million in 2024, placing massive pressure on the state rail operator Kereta Api Indonesia (KAI). The high 3.4% interest rate on refinancing loans has triggered widespread domestic criticism and prompted the current administration to push for immediate debt renegotiations with Beijing. The “Whoosh” debacle demonstrates the acute fiscal vulnerability of heavy reliance on a single foreign creditor.
Bali’s Stalled Underground Metro
Concerns over foreign-funded infrastructure are not limited to Java. The highly publicized Bali Urban Subway (Bali Metro) provides another fresh cautionary tale regarding the viability of international megaproject investments.
Conceived as a solution to Bali’s crippling tourist traffic, the underground rail network held a high-profile groundbreaking ceremony in September 2024, backed by anticipated funding from Chinese and South Korean investors. However, as of late 2026, the project has suffered from zero visible progress. Facing an exorbitant estimated price tag of $20 billion and a stark lack of private investment commitment, the Bali provincial government was forced to abandon the underground design entirely in August 2026, pivoting to a much cheaper above-ground Light Rail Transit (LRT) alternative instead.
The abrupt stalling of the Bali Metro highlights the friction between grand infrastructure proposals and the harsh reality of foreign investor risk appetite—particularly when complex land acquisition and local topography are involved.
Strategic Caution Moving Forward
As Indonesia brings China and Russia to the negotiating table for the Trans-Kalimantan railway, it will likely prioritize rigorous feasibility studies, diversified funding models, and strict caps on state budget exposure.
Jakarta is learning that while international capital can expedite its transition into a modern economic powerhouse, the fine print of these multi-billion-dollar deals will determine whether these railways become engines of growth—or generations of debt. To successfully execute the Trans-Kalimantan railway, Indonesia must strike a delicate balance: leveraging foreign technological and financial muscle while fiercely protecting its domestic financial stability.
Discover more from The Economy
Subscribe to get the latest posts sent to your email.

A single slip-and-fall lawsuit against an uninsured small business can wipe out years of profit in one settlement — yet a large share of small business owners still operate without even basic general liability coverage, often simply because no one ever explained clearly what’s actually required versus optional.
Business insurance isn’t a single product — it’s a category spanning general liability, workers’ compensation, professional liability, commercial property, and more, each protecting against different risks. Figuring out which coverage your specific business actually needs, and what it should reasonably cost, is one of the most commonly delayed and misunderstood decisions small business owners face.
This guide breaks down the core types of business insurance, current 2026 cost benchmarks, and how to build the right coverage package without overpaying.
How Business Insurance Actually Works: The Core Coverage Types
Most small businesses don’t need every type of commercial insurance — the right combination depends heavily on industry, whether you have employees, and whether you interact with the public or handle client data.
Key takeaway: General liability insurance isn’t legally required in most states, but it’s often necessary to secure a client contract, obtain a business license, or sign a commercial lease — meaning many business owners end up needing it as a practical requirement of doing business, even without a legal mandate.
The Core Business Insurance Types
- General liability insurance — covers third-party bodily injury, property damage, and personal injury claims arising from your business operations.
- Workers’ compensation insurance — required in most states once you hire employees, covering medical costs and lost wages for work-related injuries.
- Professional liability insurance (errors & omissions) — protects service-based businesses against claims of negligence, mistakes, or failure to deliver promised services.
- Commercial property insurance — covers physical business assets (equipment, inventory, the building itself) against fire, theft, and other covered perils.
- Business Owner’s Policy (BOP) — bundles general liability and commercial property coverage into a single, typically discounted policy.
- Cyber liability insurance — increasingly essential for businesses handling customer payment data or sensitive personal information.
Step-by-Step: Building Your Business Insurance Package
- Assess your specific risk profile — client-facing businesses, those with employees, and those handling sensitive data each face different primary risks.
- Determine legal and contractual requirements — workers’ comp is state-mandated once you have employees, and many commercial leases and client contracts require proof of general liability coverage.
- Get quotes for a Business Owner’s Policy first, since bundling liability and property coverage is typically more cost-effective than purchasing separately.
- Add specialized coverage as needed — professional liability for advice-based businesses, cyber liability for data-handling businesses, commercial auto for businesses with vehicles.
- Review coverage limits against your actual risk exposure, not just the cheapest available policy, since underinsurance can be as costly as no insurance in a serious claim.
- Reassess annually as your business grows, since coverage needs — and available discounts — change as revenue, staff count, and operations evolve.
Financial and Strategic Implications: 2026 Business Insurance Cost Benchmarks
Costs vary substantially by industry, business size, and claims history, but understanding typical ranges helps set realistic budget expectations.
| Coverage Type | Typical Monthly Cost (2026) | Notes |
|---|---|---|
| General liability insurance | $40–$100/month for most small businesses | Median new-customer rate around $55/month per Progressive Commercial data |
| Workers’ compensation | $45–$70/month median, varies heavily by industry risk | Office-based businesses pay far less than construction or manual-labor industries |
| Business Owner’s Policy (BOP) | $57–$150/month | Bundled liability + property, typically cheaper than separate policies |
| Professional liability (E&O) | Varies by profession and revenue | Higher for advice-heavy professions (consulting, financial services, healthcare-adjacent) |
Expert insight: Most small businesses pay roughly $500 to $2,000 a year for general liability or a BOP, with total costs climbing meaningfully once workers’ compensation, commercial auto, or professional liability are added — meaning a realistic total insurance budget should account for the full coverage stack your business actually needs, not just a single policy.
Why Cost Varies So Much by Industry
A home-based bookkeeper and a residential construction crew face fundamentally different risk profiles, and insurers price accordingly. A small consulting firm with a clean claims history might pay $750 to $1,200 per year for general liability coverage, while a construction company with similar revenue could pay $3,000 to $5,000 or more for the same coverage type, reflecting the materially higher claims frequency and severity in higher-risk industries.
Bundling and Discount Strategies
Bundling multiple policies with a single insurer commonly produces automatic discounts of 10% to 15%, and choosing a higher deductible — when cash flow allows — can meaningfully lower monthly premiums for businesses confident in their ability to absorb a modest out-of-pocket cost in the event of a claim.
How to Choose the Right Business Insurance
- Start with a Business Owner’s Policy if you qualify — most small businesses without significant specialized risk exposure fit within a standard BOP more cost-effectively than piecing together separate policies.
- Don’t skip workers’ compensation once you hire employees — it’s legally required in nearly every state and the penalties for non-compliance can be severe.
- Get quotes from at least three insurers, since — as with other insurance categories — identical coverage can price very differently between carriers for the same business profile.
- Work with an independent broker for complex risk profiles, since brokers can shop multiple insurers and identify industry-specific coverage gaps a single-carrier quote might miss.
- Review your policy annually as your business changes — added employees, new locations, or expanded services can all create coverage gaps if the policy isn’t updated.
- Don’t assume a personal umbrella policy covers business activity — business risks generally require dedicated commercial coverage, and mixing personal and business insurance can leave real gaps.
Key takeaway: The businesses that get burned by inadequate insurance are rarely the ones that skipped coverage entirely — they’re far more often the ones that bought a policy years ago and never revisited it as the business grew, leaving real gaps between what’s covered and what the business now actually does.
Future Outlook: Business Insurance Trends Through 2027
- “Social inflation” continues to pressure premiums upward. Rising litigation costs and larger jury awards continue to put upward pressure on general liability premiums nationally, a trend insurers refer to as social inflation, meaning even businesses with clean claims histories may see gradual rate increases independent of their own risk profile.
- Cyber liability coverage is shifting from optional to expected. As data breach costs and regulatory penalties continue rising, more commercial leases, client contracts, and vendor agreements are beginning to require proof of cyber liability coverage alongside traditional general liability.
- Digital-first insurers continue to compress quote-to-bind timelines. More small business insurance providers now offer instant online quotes and same-day coverage, reducing a process that historically took days or weeks through a traditional broker.
- State-level regulatory divergence on liability rules continues. States with joint-and-several-liability frameworks and higher litigation rates continue to see meaningfully higher general liability premiums than lower-litigation states, reinforcing the value of location-aware comparison shopping.
Frequently Asked Questions
Is business insurance legally required?
It depends on the type. Workers’ compensation is legally required in nearly every state once you have employees, while general liability insurance is not legally mandated in most states but is frequently required by landlords, lenders, and client contracts.
What’s the difference between general liability and professional liability insurance? General liability covers third-party bodily injury and property damage claims, while professional liability (errors & omissions) covers claims of negligence, mistakes, or failure to deliver services as promised — the coverage most relevant to service and advice-based businesses.
How much does small business insurance typically cost?
Most small businesses pay roughly $500 to $2,000 a year for general liability or a bundled Business Owner’s Policy, with total costs increasing once workers’ compensation, professional liability, or commercial auto coverage is added.
What is a Business Owner’s Policy (BOP)?
It’s a bundled policy combining general liability and commercial property coverage into a single, typically discounted package, well-suited to most small businesses without highly specialized risk exposure.
Do I need cyber liability insurance for a small business?
Increasingly yes, particularly if your business handles customer payment information or sensitive personal data, as data breach costs and related legal exposure have grown substantially in recent years.
Discover more from The Economy
Subscribe to get the latest posts sent to your email.

Executive Summary & Key Takeaways
The global macroeconomic landscape is defined by monetary policy shifts, technological supply chain realignments, and shifting demographic dynamics. According to official economic monitoring by the International Monetary Fund (IMF World Economic Outlook) and the World Bank Group, global GDP exceeds $125 trillion in nominal terms.
- Top Position: The United States maintains its position as the largest nominal economy at $32.38 trillion, driven by tech innovation, resilient consumer demand, and deep capital markets, as highlighted by the U.S. Bureau of Economic Analysis.
- PPP Leader: China dominates Purchasing Power Parity (PPP) with an output of $44.30 trillion, reflecting its massive industrial capacity and domestic consumption scale.
- European Dynamics: Germany holds the 3rd spot nominally ($5.45 trillion), navigating energy transitions and industrial re-tooling ahead of Japan ($4.38 trillion).
- Emerging Growth Engines: India leads among major emerging markets with real GDP growth expanding above 6.4%, positioning it to challenge top-tier positions over the coming decade.
Global GDP Ranking Matrix: Top 10 Economies
Below is a comparative breakdown of the top 10 economies, combining Nominal GDP, PPP GDP, Nominal GDP Per Capita, and Real GDP Growth Rates aggregated from primary statistical repositories including Eurostat and the Federal Reserve Economic Data (FRED).
| Rank | Country | Nominal GDP (USD)∣PPPGDP(Int.) | Nominal GDP Per Capita | Real Growth Rate (%) | Key Dominant Sector |
| 1 | United States | $32.38 Trillion | $32.38 Trillion | $94,430 | 2.32% |
| 2 | China | $20.85 Trillion | $44.30 Trillion | $14,874 | 4.41% |
| 3 | Germany | $5.45 Trillion | $6.41 Trillion | $65,303 | 0.79% |
| 4 | Japan | $4.38 Trillion | $7.26 Trillion | $35,703 | 0.72% |
| 5 | United Kingdom | $4.26 Trillion | $4.72 Trillion | $61,056 | 0.80% |
| 6 | India | $4.15 Trillion | $18.90 Trillion | $2,813 | 6.48% |
| 7 | France | $3.60 Trillion | $4.73 Trillion | $52,083 | 0.86% |
| 8 | Italy | $2.74 Trillion | $3.87 Trillion | $46,505 | 0.52% |
| 9 | Russia | $2.66 Trillion | $7.53 Trillion | $18,525 | 1.09% |
| 10 | Brazil | $2.64 Trillion | $5.23 Trillion | $12,313 | 1.91% |
In-Depth Profile of the Top 10 Economies
1. United States
- Nominal GDP: $32.38 Trillion | PPP GDP: $32.38 Trillion | Per Capita: $94,430
- Growth Rate: 2.32%
- Economic Analysis: The U.S. economy remains the world’s chief financial powerhouse. Its growth is underpinned by flexible labor markets, dominant technology giants, and capital allocation mechanisms tracked by the Federal Reserve System. The nation’s strength in artificial intelligence, software infrastructure, biotechnology, and energy self-sufficiency shields it against foreign supply chokepoints.
- Macro Risk: High national debt levels and elevated interest rates aimed at controlling service-sector inflation.
2. China
- Nominal GDP: $20.85 Trillion | PPP GDP: $44.30 Trillion | Per Capita: $14,874
- Growth Rate: 4.41%
- Economic Analysis: China is the world’s industrial foundation and the largest economy measured by Purchasing Power Parity. According to global trade documentation from UNCTAD, China leads in global manufacturing export volumes, electric vehicle supply chains, solar tech, and rare earth processing.
- Macro Risk: Real estate market structural adjustments, local government debt debt-servicing burdens, and demographic headwinds from an aging workforce.
3. Germany
- Nominal GDP: $5.45 Trillion | PPP GDP: $6.41 Trillion | Per Capita: $65,303
- Growth Rate: 0.79%
- Economic Analysis: Germany serves as the industrial core of the European Union. Supported by a specialized network of medium-sized industrial leaders (Mittelstand), Germany excels in high-precision engineering, chemical processing, and industrial machinery.
- Macro Risk: Transitioning away from historically cheap pipeline gas toward green hydrogen/renewable infrastructure, combined with structural labor shortages.
4. Japan
- Nominal GDP: $4.38 Trillion | PPP GDP: $7.26 Trillion | Per Capita: $35,703
- Growth Rate: 0.72%
- Economic Analysis: Known for technological innovation and precision manufacturing, Japan benefits from high foreign assets, advanced robotics, and heavy domestic research investment. Trade flows published by the OECD iLibrary highlight Japan’s high value-add manufacturing integration across Asia and the Americas.
- Macro Risk: Persistent demographic contraction and high public debt-to-GDP ratios managed by the Bank of Japan.
5. United Kingdom
- Nominal GDP: $4.26 Trillion | PPP GDP: $4.72 Trillion | Per Capita: $61,056
- Growth Rate: 0.80%
- Economic Analysis: The UK relies heavily on services, which account for roughly 80% of total economic output. London remains one of the world’s premier financial centers, excelling in asset management, insurance, cross-border fintech, and legal services.
- Macro Risk: Supply-chain re-anchoring post-Brexit and sluggish domestic capital investment rates.
6. India
- Nominal GDP: $4.15 Trillion | PPP GDP: $18.90 Trillion | Per Capita: $2,813
- Growth Rate: 6.48%
- Economic Analysis: India is the world’s fastest-growing major economy. Driven by rapid digital public infrastructure expansion, nationwide transport investments, and expanding manufacturing under global supply chain diversification strategies (“China + 1”), India is rapidly scaling up both domestic consumption and industrial exports.
- Macro Risk: Job creation for a massive young workforce and infrastructure expansion bottlenecks.
7. France
- Nominal GDP: $3.60 Trillion | PPP GDP: $4.73 Trillion | Per Capita: $52,083
- Growth Rate: 0.86%
- Economic Analysis: France operates a diversified economy featuring strong tourism, aerospace (Airbus), luxury consumer conglomerates (LVMH, Kering), and nuclear energy generation. Its low-carbon electricity grid provides cost-stability advantages over neighboring industrial markets.
- Macro Risk: Public deficit management and rigid labor market structural adjustments.
8. Italy
- Nominal GDP: $2.74 Trillion | PPP GDP: $3.87 Trillion | Per Capita: $46,505
- Growth Rate: 0.52%
- Economic Analysis: Italy’s economy relies on an export-oriented manufacturing base in its northern regions, specializing in luxury automobiles, industrial automation, pharmaceutical production, and high-end textiles.
- Macro Risk: Public sector debt servicing and structural regional economic disparities between North and South.
9. Russia
- Nominal GDP: $2.66 Trillion | PPP GDP: $7.53 Trillion | Per Capita: $18,525
- Growth Rate: 1.09%
- Economic Analysis: Russia’s economy is anchored by natural resources, defense-industrial state expenditures, and energy commodity exports to non-Western trading partners across Eurasia and Africa.
- Macro Risk: International financial restrictions, currency volatility, and sanctions-driven technology supply constraints.
10. Brazil
- Nominal GDP: $2.64 Trillion | PPP GDP: $5.23 Trillion | Per Capita: $12,313
- Growth Rate: 1.91%
- Economic Analysis: Brazil dominates Latin America’s economic landscape, propelled by agricultural exports (soybeans, beef, sugar), iron ore extraction via Vale, deepwater oil exploration, and a sophisticated fintech banking sector.
- Macro Risk: Fiscal deficit volatility and vulnerability to global commodity price cycles.
Methodology: How Economic Output is Measured
Evaluating economic scale requires understanding three primary economic indicators:
                  ┌────────────────────────────────────────────────┐
                  │          Gross Domestic Product (GDP)          │
                  └───────────────────────┬────────────────────────┘
                                          │
            ┌─────────────────────────────┼─────────────────────────────┐
            ▼                             ▼                             ▼
┌───────────────────────┐     ┌───────────────────────┐     ┌───────────────────────┐
│     Nominal GDP       │     │        PPP GDP        │     │    GDP Per Capita     │
├───────────────────────┤     ├───────────────────────┤     ├───────────────────────┤
│ Expressed in current  │     │ Adjusted for local    │     │ Total output divided  │
│ USD exchange rates.   │     │ purchasing power.     │     │ by population.        │
│ Identifies global     │     │ Reflects internal     │     │ Measures average      │
│ capital power.        │     │ economic scale.       │     │ living standard.      │
└───────────────────────┘     └───────────────────────┘     └───────────────────────┘
- Nominal GDP (Current Prices in USD): Measures the market value of all final goods and services produced within a country in a given year. Nominal values convert domestic output using prevailing market exchange rates. While ideal for assessing international purchasing power, it fluctuates with currency market swings.
- Purchasing Power Parity (PPP): Adjusts for relative price levels and local living costs using an international basket of goods. According to data methodology guides from the Bank for International Settlements (BIS), PPP offers a realistic view of domestic production capability and domestic consumer capacity.
- GDP Per Capita: Divides total economic output by total population. This distinguishes between sheer economic scale (e.g., India or China) and individual living standards (e.g., Switzerland, Luxembourg, or the United States).
Key Takeaways for Global Economic Trends
- The Shift Toward Multipolar Growth: Asia’s expanding market share—led by China, India, Indonesia, and Vietnam—continues to outpace global growth averages, shifting the center of gravity of manufacturing and consumption.
- Energy Transition Dynamics: Nations with sovereign clean tech supply chains (China) or independent nuclear grids (France) gain structural cost advantages over those dependent on imported fossil fuels.
- Demographics vs. Productivity: Aging populations across Europe and East Asia mean future expansion depends heavily on capital deployment into automation, AI infrastructure, and high-margin service exports.
Discover more from The Economy
Subscribe to get the latest posts sent to your email.

Silver Price Today: Why the Xi-Trump AI Standoff Is Fueling a Safe-Haven Rally

Citibank & Dólar Estadounidense: Forex Playbook After the Xi-Trump Truce

How the Trump-Xi White House Summit Is Reshaping Mortgage Rates Today for Real Estate Investors

Indonesia Navigates Mega-Project Risks as China and Russia Eye the 2,772km Trans-Kalimantan Railway

Trump-Xi 2026 Summit Takeaways: The Trade Truce, Taiwan, and the AI Divide

Solar Panel Installation Cost in 2026: Why the Math Changed Overnight

Business Insurance: What Coverage You Actually Need and What It Costs in 2026

Auto Insurance Quotes: How to Get the Lowest Rate Without Losing Coverage

Huntington Online Banking: Full Features, Fees, and How It Compares in 2026

Apply for a Bank Account Online: What You Need and How Long It Actually Takes

World’s Largest Economies: Ranking the Top Global Powers

Business Loan: A Complete 2026 Guide to Rates, Types, and Qualifying

Fast Invoice Factoring: How to Turn Unpaid Invoices Into Cash Within 24 Hours

Investment Banking Services: What They Cost and How to Choose the Right Firm in 2026

Top 30 Stocks for Investment in PSX for Massive ROI in 2026

SpaceX Starship Flight 14: First Orbital Attempt & Starlink V3 Launch Explained

Oil Prices Break $100 in 2026: Middle East Conflict & Energy Markets

BRICS+ Cross-Border Payments 2026: Interoperability Explained

AI Chip Stocks 2026: The Best Semiconductor Investments Beyond Marvell

Fidelity Investments Review 2026: SPAXX Yields & Zero-Fee Funds

Tween Back-to-School Trends 2026: What’s Driving the $85B Season

10-Year Treasury Yield Hits 4.80%: What It Means for Rates & Portfolios

Shein Clothes Quality & Safety in 2026: What Lab Tests Show

China’s US$10.8 Billion Trade Shortcut: Why the Pinglu Canal Matters

MRVL Earnings 2026: Why Marvell Sank Despite Beating Estimates

IMF & World Bank 2026 Global Economic Outlook: Growth, Inflation, Debt

High-CPM Finance Niches 2026: Publisher Monetization Blueprint

Middle East War Economics 2026: Oil Prices & Energy Markets
-

 Markets & Finance9 months ago
Top 15 Stocks for Investment in 2026 in PSX: Your Complete Guide to Pakistan’s Best Investment Opportunities
-

 Analysis7 months ago
Johor’s Investment Boom: The Hidden Costs Behind Malaysia’s Most Ambitious Economic Surge
-

 Analysis7 months ago
Top 10 Stocks for Investment in PSX for Quick Returns in 2026
-

 Banks8 months ago
Best Investments in Pakistan 2026: Top 10 Low-Price Shares and Long-Term Picks for the PSX
-

 Analysis8 months ago
Brazil’s Rare Earth Race: US, EU, and China Compete for Critical Minerals as Tensions Rise
-

 Investment9 months ago
Top 10 Mutual Fund Managers in Pakistan for Investment in 2026: A Comprehensive Guide for Optimal Returns
-

 Global Economy9 months ago
15 Most Lucrative Sectors for Investment in Pakistan: A 2025 Data-Driven Analysis
-

 Global Economy9 months ago
Pakistan’s Export Goldmine: 10 Game-Changing Markets Where Pakistani Businesses Are Winning Big in 2025