
Global Finance
Federal Constitutional Court upholds Super tax


ISLAMABAD — Pakistan’s Federal Constitutional Court’s, three-judge bench this week delivered a quiet revolution. By upholding the controversial ‘Super Tax’ on the country’s wealthiest entities, the court did more than green-light a potential Rs300 billion (approximately $1.08bn) revenue haul. It etched into constitutional jurisprudence a stark boundary: fiscal policy is the exclusive domain of the legislature, not the judiciary. The ruling, led by Chief Justice Amin-ud-Din Khan, is a landmark reassertion of parliamentary sovereignty in economic governance, setting aside what it termed “judicial overreach” by lower courts. In a nation perennially navigating a crisis of public finance, this is a decisive shift of power back to the tax-writing desks of Parliament and away from the benches of the High Courts.
Why This Ruling Reshapes Pakistan’s Economic Constitution
The core of the dispute was seductively simple: could Parliament, through Sections 4b and 4c of the Income Tax Ordinance, levy a one-off surcharge on companies and individuals with incomes exceeding Rs500 million? High Courts in Karachi and Lahore had struck down or ‘read down’ the provisions, arguing on grounds of equity and policy merit. The Federal Constitutional Court’s reversal is foundational. It hinges on a strict interpretation of the separation of powers, a doctrine as venerable in Western polities as it is often contested in developing democracies. The bench declared that determining “tax slabs, rates, thresholds, or fiscal policy” is not a judicial function. This judicial restraint aligns Pakistan with a global constitutional consensus, echoing principles long established in jurisdictions like the United Kingdom, where parliamentary supremacy over taxation is absolute, and reaffirmed in landmark rulings by constitutional courts worldwide.
The immediate ‘what next’ is fiscal. The Federal Board of Revenue (FBR) can now confidently collect a tax it estimates will bring Rs300 billion into a chronically anaemic public exchequer. For context, that sum nearly equals the entire annual development budget for Pakistan’s infrastructure and social projects. In a country where the tax-to-GDP ratio languishes at around 10.6%—among the world’s lowest—this injection is not merely significant; it is transformative for a government negotiating yet another International Monetary Fund (IMF) programme predicated on enhancing revenue mobilization. The IMF has explicitly called for Pakistan to raise its tax-to-GDP ratio by 3 percentage points to 13% over the 37-month Extended Fund Facility program, making this ruling critically important for fiscal consolidation.
The Doctrine of Judicial Restraint in a Hot Economy
Why did the court rule so emphatically? Beyond the black-letter law, the decision is a strategic retreat from judicial entanglement in macroeconomic management. Pakistan’s courts have historically been activist, even in complex economic matters. This ruling signals a pivot toward a philosophy of judicial restraint, recognizing that judges lack the electoral mandate and technocratic apparatus to micromanage the nation’s balance sheet. As recognized in constitutional scholarship on the limits of judicial review, courts venturing into fiscal policy often create market uncertainty and implementation chaos—precisely what the FCC seeks to avoid.
The ruling also clarifies the temporal application of the tax: Section 4b applies from 2015 and 4c from 2022, ending years of legal limbo for businesses. This provides the certainty that investors and the World Bank consistently argue is critical for economic growth. For the business elite in Karachi’s financial district or Lahore’s industrial hubs, the message is clear: future battles over tax policy must be fought in the parliamentary arena, not the courthouse.
What Next: The Real Test of Governance Begins
The court has handed Parliament and the FBR a powerful tool and, with it, a profound responsibility. The ‘what next’ question now shifts from constitutionality to capacity and fairness. Can the FBR, an institution often criticized for its opacity and broad discretionary powers, administer this super tax efficiently and without political favouritism? Will the revenue truly be deployed for its stated purposes—from rehabilitating displaced persons (the original 2015 rationale) to bridging the general budget deficit? Court observations during hearings revealed that of Rs144 billion collected between 2015 and 2020, only Rs37 billion was spent on rehabilitation of internally displaced persons, raising legitimate questions about fiscal accountability.
Furthermore, Parliament’s exclusive authority is now doubly underscored. This invites, indeed demands, more rigorous legislative scrutiny of future finance bills. The ruling empowers backbenchers and opposition members to engage deeply in tax design, knowing the courts will not provide a backstop for poorly crafted law. Sustainable revenue growth requires not just legal authority but broad-based political legitimacy—a challenge that remains for Pakistan’s democratic institutions.
A Global Signal in an Age of Inequality
Finally, this ruling resonates beyond Pakistan’s borders. In an era of rising wealth inequality and global debates on taxing the ultra-rich, the judgment affirms the state’s constitutional right to enact progressive fiscal measures. The OECD and World Bank have increasingly emphasized the importance of progressive taxation in addressing inequality, with research showing that countries sustainably increasing their tax-to-GDP ratio to 15% experience significantly higher GDP per capita growth compared to countries whose tax ratio stalls around 10%—exactly Pakistan’s predicament.
The court has not endorsed the Super Tax’s wisdom; it has endorsed Parliament’s right to decide. It places Pakistan within a contemporary movement toward progressive wealth taxation, yet grounds it in the ancient principle that only the representatives of the people hold the power to tax—a foundational tenet of parliamentary sovereignty recognized across democratic systems.
The Constitutional Architecture Emerges
The ruling carries particular significance given Pakistan’s recent constitutional evolution. The creation of the Federal Constitutional Court through the 27th Constitutional Amendment, as Arab News analysis suggests, represents an institutional opportunity to resolve longstanding ambiguities in economic governance. When constitutional rules governing taxation, resource allocation, and federal-provincial fiscal relations remain unclear, governments litigate instead of coordinate, and businesses defend rather than invest. The FCC’s decisive stance on parliamentary authority in taxation may signal the court’s broader approach to economic constitutionalism—one that prizes institutional clarity and democratic accountability over judicial management of complex policy questions.
The marble halls of the FCC have thus returned a weighty question to the carpeted chambers of Parliament: having won the constitutional right to tax, can they now craft a fiscal contract with the nation that is both solvent and just? The Rs300 billion figure is a start, but the real accounting of this ruling’s success will be measured in the credibility of the state it helps to build—and whether Pakistan can finally escape the cycle of perpetually low tax collection that has constrained its development aspirations for decades.
This landmark decision arrives at a critical juncture as Pakistan navigates its Extended Fund Facility program with the IMF, with fiscal reforms remaining central to the country’s economic stabilization. The court’s affirmation of parliamentary supremacy in taxation provides the constitutional foundation necessary for sustainable revenue mobilization—but parliamentary action must now match judicial clarity.
Discover more from The Economy
Subscribe to get the latest posts sent to your email.



On a humid afternoon in late May 2026, the US Treasury auctioned $44 billion in seven-year notes. The bid-to-cover ratio—the ultimate barometer of market appetite—flashed a healthy 2.6. Investors barely blinked. Yet, this routine transaction masked a staggering reality: global public debt had just breached the $100 trillion threshold. By all traditional economic orthodoxies, fixed-income investors should be staging a riot. They should be aggressively dumping sovereign paper, punishing finance ministries, and demanding crippling risk premiums. They aren’t. Instead, fixed-income desks from London to Tokyo are learning to live with—and perhaps even profit from—a permanently elevated era of sovereign borrowing. The old rules of fiscal gravity have been suspended, replaced by a new, unapologetic pragmatism.
The macroeconomic math is unforgiving. Advanced economies are currently carrying debt loads averaging roughly 112 percent of their gross domestic product, a figure not seen since the immediate, rationing-heavy aftermath of the Second World War. The International Monetary Fund’s latest projections suggest this trajectory will only steepen. It is driven by the inescapable triad of aging demographics, urgent defense modernization, and the trillion-dollar global energy transition. For a decade, central banks masked this accumulation by hoovering up bonds through the blunt instrument of quantitative easing. That era is definitively dead.
Today, governments must sell debt to private buyers in an environment where interest rates have normalized and central bank balance sheets are shrinking. Conventional wisdom dictates that this violent collision of massive supply and price-sensitive demand must trigger a spiral of rising yields and fiscal crises. Yet, the anticipated sovereign debt meltdown has failed to materialize. Markets have calmly digested the deluge. To understand why, one must abandon the outdated morality play that views all state borrowing as a terminal disease. We must look closer at the changing mechanics of global liquidity.
The new mechanics of public debt bond markets
For decades, the relationship between finance ministries and public debt bond markets was governed by a strict, unwritten code. Cross a certain threshold—say, 90 percent debt-to-GDP—and the so-called bond vigilantes would exact their revenge, driving up borrowing costs until harsh austerity was enforced.
That relationship has fundamentally mutated. The core development reshaping fixed-income trading today is a structural re-evaluation of what constitutes ‘safe’ debt. It turns out that absolute debt levels matter significantly less to institutional buyers than the velocity of nominal economic growth and the perceived utility of the deficit spending. When sovereign borrowing is explicitly directed toward productivity-enhancing infrastructure, artificial intelligence incubation, or strategic tech sovereignty, markets exhibit a surprisingly elastic tolerance.
Consider the European Union’s joint borrowing initiatives. Despite fierce initial skepticism, the issuance of NextGenerationEU bonds created a massive new pool of highly rated, liquid assets that pension funds and life insurers desperately needed to match their long-term liabilities. The market didn’t punish the debt; it absorbed it as a vital financial utility. According to the Bank for International Settlements, the sheer depth and daily liquidity of major sovereign bond markets often override purely fundamental concerns about debt-to-GDP ratios. Institutional investors simply need places to park billions of dollars safely. Government paper remains the only vessel large enough to hold it.
In the United States, primary dealers—the massive financial institutions legally obligated to bid at Treasury auctions—have adapted their balance sheets to intermediate this unprecedented flow. They know the domestic banking system, sitting on vast reserves, requires Treasury collateral to function on a daily basis. Thus, the mechanics of modern finance create a captive, structural audience for government debt.
The system is hardwired to consume what the state produces.
Still, this tolerance is heavily conditional. The market demands a coherent narrative. The UK’s disastrous ‘mini-budget’ in September 2022 proved that bond markets will still brutally punish unfunded tax cuts that promise no credible growth dividend. Former Chancellor Kwasi Kwarteng learned this the hard way when the 30-year gilt yield spiked over 120 basis points in a matter of days. The lesson wasn’t that high debt is forbidden. The lesson was that unpredictable, chaotic fiscal policy is forbidden. As long as finance ministries communicate transparently and tie debt issuance to plausible economic expansion, the buyers will reliably show up.
How sovereign debt yields absorb fiscal expansion
If the sheer volume of issuance isn’t triggering a sovereign crisis, we have to look under the hood at how prices actually clear. The analytical puzzle centers heavily on the term premium—the extra compensation investors demand for the risk of holding long-term bonds instead of simply rolling over short-term debt month after month.
For a brief, terrifying window in late 2023, the term premium on US 10-year notes surged, threatening to drag global equity markets down with it. Panicked pundits declared the return of fiscal dominance, a nightmare scenario where central banks are effectively forced to keep interest rates artificially low simply to prevent the government from going bankrupt. Yet, the panic subsided quickly. Why? Because the underlying inflation data cooled, proving to traders that monetary policy still had sharp teeth.
How does government debt affect bond yields?
Government debt affects bond yields primarily through the dynamics of supply, demand, and inflation expectations. When a state issues more bonds to fund deficits, the increased supply typically pushes prices down and yields up. However, if the market believes the central bank will keep inflation anchored, the yield increase remains highly contained.
That containment is the absolute secret to the current market equilibrium. Investors are not blindly trusting political governments; they are trusting the institutional separation of powers between the Treasury and the central bank. As long as the Federal Reserve, the European Central Bank, and the Bank of England maintain their fierce independence, the bond market treats public debt as a cold pricing exercise rather than an existential threat to capital.
Furthermore, global demographic forces are providing a massive structural tailwind for sovereign debt. The rapidly aging populations of the Western world and East Asia are aggressively shifting their portfolios away from volatile equities and toward stable fixed income. A 65-year-old retiree in Munich or Osaka doesn’t care about the ideological debate over national deficits; they care about securing a guaranteed four percent return to fund their pension. This relentless, demographic-driven demand acts as an invisible shock absorber, suppressing yields even as governments print trillions in new paper. The global savings glut, a concept famously championed by Ben Bernanke two decades ago, never really vanished. It simply evolved, pooling into massive institutional accounts that have a voracious, structural mandate to buy and hold sovereign debt until maturity.
The bifurcation of the sovereign risk premium
The downstream consequences of this new debt tolerance are undeniably profound, but they are not evenly distributed. We are currently witnessing a brutal bifurcation in how global capital treats different sovereign borrowers.
For countries that issue debt in their own currency and control the global reserve infrastructure—primarily the United States—the financial leash is incredibly long. Washington can run a six percent fiscal deficit during an economic expansion, a historically anomalous posture, and still find ready buyers globally. The US dollar’s exorbitant privilege ensures that Treasury bonds remain the ultimate safe harbor asset, regardless of the persistent political dysfunction on Capitol Hill. Investors have priced in the noise and focus strictly on the liquidity.
That said, emerging markets face an entirely different, far harsher reality. For nations borrowing heavily in foreign currencies, the old rules of economic gravity still apply with terrifying force. Recent analysis by the World Bank highlights that while advanced economies have effectively insulated themselves from the worst effects of their soaring debt loads, developing nations are spending record proportions of their fiscal revenues simply servicing interest payments. For them, the bond market has not learned to love debt; it has learned to extract a punishing, extractive premium for it.
In the corporate sphere, this massive sovereign debt expansion is quietly crowding out private investment. When a central government issues $2 trillion in a single year, that capital is siphoned directly away from venture capital, corporate expansion, and private equities. Corporate treasurers are finding that they must offer significantly higher yields just to compete with the risk-free rate established by the state.
Ultimately, policymakers must recognize that the market’s current patience is a finite asset, not a permanent right. It buys governments crucial time to invest in the industries of tomorrow—clean energy, semiconductor manufacturing, and advanced infrastructure. If the borrowed trillions are squandered on unsustainable entitlement spending or bureaucratic bloat, the economic growth required to service the debt will inevitably stall. This is why the precise composition of national budgets is suddenly a premier obsession for global hedge funds. A deficit driven by capital expenditure is a bullish signal. A deficit driven by public sector wage hikes is a glaring red flag. The bond market is becoming an active, ruthless auditor of state industrial policy.
The illusion of permanent liquidity
Not everyone is convinced that the financial system has engineered a permanent escape from fiscal gravity. A highly vocal contingent of economic heavyweights warns that the current market complacency is a dangerous hallucination. They argue it is built entirely on the shifting sands of temporary macroeconomic alignment.
The dissenting view argues that the bond market hasn’t learned to love debt at all; it has merely been anesthetized by a decade of financial repression and a recent, lucky streak of resilient consumer growth. Economists at the National Bureau of Economic Research have repeatedly cautioned that structural deficits will eventually crowd out private investment to such an extreme degree that real interest rates must violently reprice upward.
Their underlying logic is painfully straightforward. Demographics may currently support aggressive bond buying, but as populations age even further, they will stop saving and start drawing down their pensions. The structural bid for bonds will evaporate exactly when governments need it most to fund spiraling healthcare costs. When that demographic tipping point arrives, the term premium won’t just rise—it will aggressively explode.
Furthermore, critics point out that the current equilibrium assumes consumer inflation is permanently conquered. If geopolitical supply chain shocks or trade deglobalization trigger a second wave of structural inflation, central banks will be forced to hike rates aggressively into the teeth of record national debt levels. In that chaotic scenario, the market’s supposed elastic tolerance will snap instantly. The sheer arithmetic of interest expense will rapidly consume national budgets, forcing governments into a death spiral of printing money or outright defaulting. To these seasoned critics, the legendary bond vigilantes aren’t dead. They are just hibernating, patiently waiting for central banks to finally lose control of the macro narrative.
The arithmetic of trust
The central tension of modern finance is that both optimists and cynics are partially right. Governments have successfully rewritten the rules of sovereign borrowing, expanding the boundaries of the fiscal state far beyond what twentieth-century economists thought possible. The core plumbing of the global financial system has adapted to treat state debt not as a toxic liability, but as the foundational collateral of modern capitalism.
Yet, this towering architecture rests entirely on the fragile foundation of trust. Bond markets will finance the state’s grandest ambitions—whether fighting climate change, rebuilding militaries, or subsidizing domestic manufacturing—only as long as they believe the state remains capable of generating real economic wealth. The math only works if the promised growth actually materializes.
If policymakers treat market tolerance as a blank check for fiscal nihilism, the reckoning will be swift and merciless. But if they use this borrowed time wisely to build genuinely resilient economies, the current era may be remembered not as a reckless debt crisis, but as a masterclass in strategic statecraft. Public debt is no longer a guaranteed path to ruin, but neither is it a free lunch. It remains a high-stakes wager on the future productivity of the nation.
Discover more from The Economy
Subscribe to get the latest posts sent to your email.
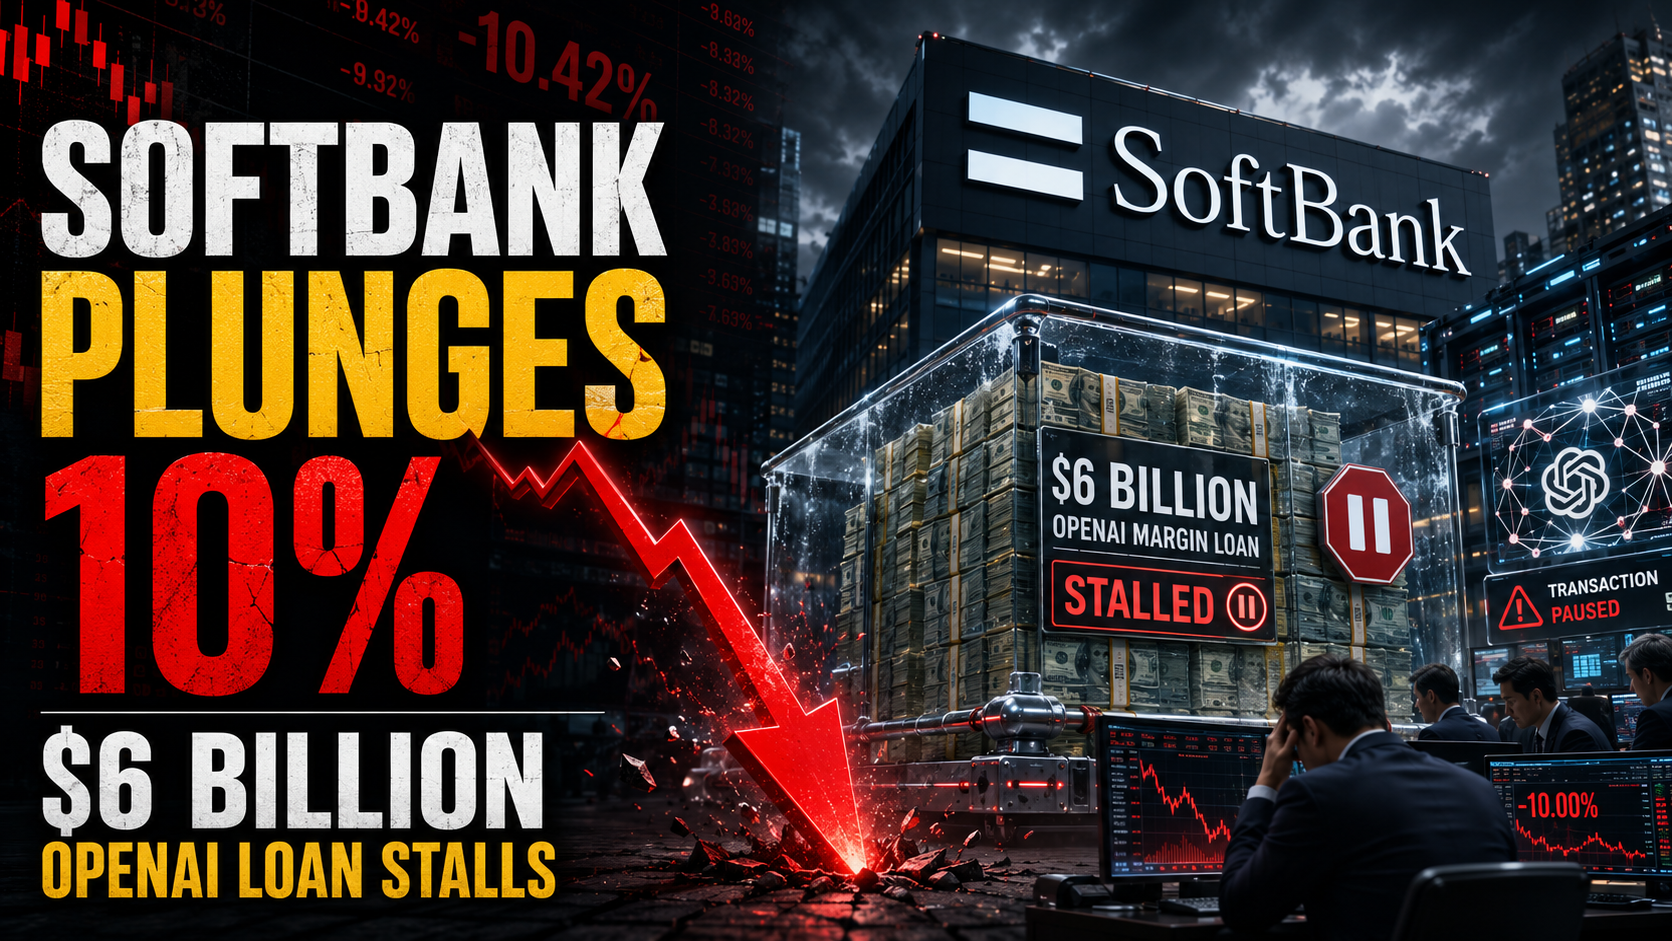
SoftBank Group dropped as much as 11% in Tokyo on Tuesday before closing down 8.3%, wiping roughly $8 billion off its market value in a single session. The trigger wasn’t earnings or guidance. It was a Bloomberg report, carried by Reuters, that the company’s talks to raise a SoftBank margin loan backed by its OpenAI stake have stalled.
What began as a $10 billion pitch to creditors has shrunk to $6 billion, and even that looks uncertain. For a firm that has bet its balance sheet on artificial intelligence, the market’s reaction was swift and unsentimental.
The fall lands in the middle of a broader technology sell-off, but SoftBank’s pain is specific. Since September 2024, founder Masayoshi Son has committed up to $30 billion to OpenAI, turning the Japanese conglomerate into the ChatGPT maker’s largest financial backer. To fund it, SoftBank secured a $40 billion loan through a bridge facility in March, arranged by JPMorgan Chase, Goldman Sachs, Mizuho, SMBC and MUFG, due in March 2027.
That bridge was always meant to be refinanced. The plan: borrow against the paper gains in OpenAI. With OpenAI’s March funding round valuing it at $852 billion, SoftBank’s 13% stake was marked near $110 billion on paper. Yet private-company collateral is a hard sell when lenders are already nervous about AI valuations and SoftBank’s history of concentrated bets.
1 — The Core Development: From $10 Billion to Stalled Talks
The SoftBank margin loan was pitched as a two-year facility, with an option to extend by one year, using OpenAI shares as collateral. Initial discussions in April targeted $10 billion. By early May, bankers were already telling Bloomberg that creditors balked at valuing an unlisted AI company, and the target was cut to $6 billion.
On June 10, the story broke that those talks have now stalled. SoftBank Group’s talks with potential creditors to raise at least $6 billion from a margin loan backed by its OpenAI stake have stalled, Bloomberg reported, citing people familiar with the matter. Reuters could not independently verify the report, and SoftBank declined to comment.
The market didn’t wait for confirmation. SoftBank shares, ticker 9984 in Tokyo, plummeted more than 11% at one stage in Tokyo, before recovering slightly to close down 8.3%. Seeking Alpha pegged the U.S.-listed ADR drop at 9.7% the same day. Over five trading sessions, the stock has fallen by more than a fifth, stripping SoftBank of its crown as Japan’s most valuable company.
Why the sensitivity? Because the loan isn’t optional. SoftBank is racing to close a $22.5 billion funding commitment to OpenAI by year-end. It has already sold its entire $5.8 billion Nvidia stake and offloaded $4.8 billion of T-Mobile US shares to raise cash. It has slowed Vision Fund dealmaking to a crawl — any deal above $50 million now requires Son’s explicit approval.
The margin loan was the cleanest way to bridge the gap without selling more crown jewels. Without it, SoftBank must choose between more asset sales, a dilutive equity raise, or leaning harder on its Arm Holdings collateral, where it already has $11.5 billion in undrawn capacity.
2 — Why SoftBank’s Margin Loan Concerns Spooked Markets
What is SoftBank’s margin loan for OpenAI?
A margin loan lets an investor borrow against securities it already owns. SoftBank wanted to pledge its private OpenAI shares to banks, receive cash, and use that cash to meet its remaining OpenAI funding promises. Lenders get interest and a claim on the shares if SoftBank defaults. The problem is pricing something that doesn’t trade.
Creditors worry about three things. First, valuation volatility. OpenAI was marked at $300 billion in April when SoftBank struck its deal. By late 2025, Reuters sources said Amazon was in talks to invest at close to $900 billion. That’s a threefold swing in months, not years.
Second, liquidity. If SoftBank couldn’t repay, banks would own a slice of a private company with no public market. Selling it quickly would mean a steep discount.
Third, concentration. SoftBank already has $40 billion in bridge debt maturing in March 2027. Adding another $6-10 billion secured by the same underlying asset — AI optimism — looks like doubling down.
Why did SoftBank shares fall 10%? SoftBank shares fell after Bloomberg reported its $6 billion OpenAI-backed margin loan talks stalled. Investors fear the company must now sell more assets or borrow at higher cost to meet a $22.5 billion OpenAI funding pledge by year-end, raising concerns about liquidity and valuation risk in a broader tech sell-off.
That 58-word answer captures the featured snippet target directly. The picture is more complicated than a single loan, however.
Lenders are also watching SoftBank’s other promises. Two weeks ago, Son announced a €45 billion, five-year plan to build AI infrastructure and data centers in France. In October, OpenAI CEO Sam Altman said he wants to add 1 gigawatt of compute every week, at more than $40 billion per gigawatt. Those numbers require constant funding, not one-off loans.
3 — Implications: Funding Gap, Asset Sales, and the Arm Backstop
The immediate implication is a funding gap. SoftBank has parent-level cash of 4.2 trillion yen ($27.16 billion) as of September 30, according to Reuters. That’s substantial, but not enough to cover both the $22.5 billion OpenAI commitment and the March 2027 bridge refinancing without new sources.
What follows, however, is a forced pivot to asset sales. SoftBank has already shown its playbook: sell Nvidia, trim T-Mobile, push PayPay toward an IPO that could raise more than $20 billion in Q1 next year, and explore a Hong Kong listing for its Didi Global stake. Each sale crystallizes gains but also reduces future optionality.
The second-order effect is on Arm. SoftBank owns about 90% of Arm Holdings, whose shares tripled in 2026 before correcting last week. That appreciation gave SoftBank an extra $6.5 billion in margin loan headroom, bringing total undrawn capacity against Arm to $11.5 billion. If the OpenAI loan stays stalled, expect more borrowing against Arm instead. It’s listed, liquid, and easier for banks to underwrite.
Still, that swaps one risk for another. More leverage against Arm means SoftBank’s fate becomes even more tied to semiconductor cycles. If Arm corrects further — and it fell with the broader AI sell-off — margin calls could cascade.
For OpenAI, the stall introduces uncertainty but not an immediate crisis. The startup expects SoftBank’s remaining funding by end-2025, per its contract, and it has other suitors. Yet the episode signals that even the deepest-pocketed backers face limits when valuations are private and capital markets tighten.
Policymakers in Tokyo are watching too. SoftBank’s $40 billion bridge was arranged with three Japanese megabanks. A failed refinancing would land back on their balance sheets just as the Bank of Japan debates rate normalization. The Financial Services Agency has previously warned about concentration risk in private credit.
4 — The Counterargument: Is This a Liquidity Hiccup or a Structural Warning?
Not everyone sees a crisis. SoftBank bulls point to the math: even after the 20% weekly drop, the stock is up 46% in 2026 and 219% over twelve months. The driver isn’t OpenAI, it’s Arm. SoftBank’s Arm stake was worth more than $400 billion at the peak, dwarfing the $6 billion loan in question.
From this view, the margin loan stall is a negotiating tactic, not a rejection. Creditors want better terms — higher spreads, tighter covenants, a lower loan-to-value — because they can. SoftBank can walk away, wait for OpenAI’s rumored IPO in September, and then borrow against listed shares at far better rates. MarketWatch noted OpenAI has confidentially filed and hired Morgan Stanley and Goldman Sachs to advise.
That said, the counterargument underestimates timing. SoftBank needs cash before an IPO, not after. Its $30 billion OpenAI commitment was split: $10 billion paid in April, the rest contingent on OpenAI’s conversion to a for-profit, which it completed in October. The remaining $20 billion-plus is due by year-end. Waiting for a September IPO that may slip is a gamble.
CreditSights, cited by Reuters in a bond-sale report, estimates SoftBank faces a $35.7 billion funding shortfall but notes “strong underlying asset value.” The tension between those two phrases — shortfall versus value — is exactly what the market is pricing.
CLOSING
SoftBank’s 10% plunge isn’t about a single loan. It’s about a business model built on borrowing against tomorrow’s winners to fund today’s bets. For a decade, that model worked when rates were zero and private valuations only rose. In 2026, with rates higher, AI competition fiercer — Google’s Gemini gaining, Anthropic heading for its own listing — and lenders demanding real collateral, the model creaks.
Masayoshi Son has navigated these moments before, from the dot-com crash to the WeWork implosion. He still has levers: Arm, PayPay, T-Mobile, and a $27 billion cash pile. Yet each lever pulled reduces his margin for error.
The market’s message on Tuesday was blunt. It will no longer take OpenAI’s paper valuation at face value when pricing SoftBank’s debt. Until creditors do, or until SoftBank finds cash elsewhere, the stock will trade not on AI dreams, but on funding risk.
Discover more from The Economy
Subscribe to get the latest posts sent to your email.

Super Micro Computer filed to raise up to $7 billion in mixed securities to fund its AI infrastructure build-out, spooking investors who sent the stock down 12% on Tuesday. The sell-off erased more than $4 billion in market value, the sharpest one-day decline since accounting irregularities first surfaced in August 2024. The registration statement, lodged with the Securities and Exchange Commission on 9 June, gives the company the flexibility to issue common stock, preferred shares, debt, or warrants. It is the largest capital-raising ambition in Super Micro’s three-decade history, and it lands at a moment when the server maker can ill afford a misstep in investor confidence.
The artificial intelligence infrastructure boom has turned once-sleepy server assemblers into strategic gatekeepers. Global spending on data-centre hardware and software will exceed $400 billion in 2026, according to [Gartner’s latest IT spending forecast](https://www.gartner.com/en/newsroom/press-releases/2026-01-15-gartner-forecasts-worldwide-it-spending-to-grow-9-percent-in-2026), with server and storage systems growing at a double-digit clip. Super Micro, a favourite of hyperscalers building NVIDIA-accelerated clusters, has ridden this wave to breakneck revenue growth: from $7.1 billion in fiscal 2023 to an estimated $25 billion in the fiscal year ending this month. Yet that expansion has stretched the balance sheet. Free cash flow turned negative in three of the past five quarters, and the company ended the March quarter with just $1.4 billion in cash against $2.8 billion in short-term debt. Wall Street had been expecting a capital raise; the sticker shock came from the sheer size of the ask.
The core development
Super Micro’s shelf registration, detailed in an SEC filing published after Monday’s close, authorises the sale of up to $7 billion in securities “for general corporate purposes, including working capital, capital expenditures, and potential acquisitions.” Chief executive Charles Liang told investors in a brief statement that the financing would “accelerate our capacity to deliver the most advanced AI platforms to customers who are scaling at an unprecedented pace.” The company gave no breakdown of how much would be raised via equity versus debt, nor a timetable. That opacity fed the worst-case assumptions embedded in Tuesday’s trading.
Shares of Super Micro, which had closed at $38.50 on Monday, dropped as low as $33.42 in the first hour of New York trading before settling at $33.90. The 12.2% decline sliced roughly $4.2 billion from the company’s market capitalisation. It was the stock’s worst single-day performance since 28 August 2024, when the company disclosed it would delay its annual report. The subsequent months brought an auditor resignation, a damning short-seller report from Hindenburg Research, and a near-death experience with Nasdaq delisting — a sequence that cost the stock more than 70% from its all-time high.
Analysts at Bloomberg Intelligence estimated that if Super Micro funded the entire $7 billion with new common equity, the share count would expand by roughly 20%, diluting earnings per share by a similar proportion. “Management is asking investors to take a leap of faith that the return on this capital will outweigh the mechanical hit to per-share metrics,” wrote senior analyst Woo Jin Ho in a note to clients on Tuesday. “In a sector where gross margins hover around 15%, that is a tall order.”
Dilution maths and the AI arms race
Why did Super Micro stock drop today? The immediate trigger is the arithmetic of dilution: a $7 billion equity raise at current market prices would swell Super Micro’s outstanding share count from roughly 580 million to approximately 700 million. All else equal, that shrinks each shareholder’s claim on future earnings by a fifth. For a stock that only regained Nasdaq compliance in February after restating two years of financials, the timing reawakens questions about whether the house is fully in order before the company knocks on the door for fresh capital.
The structural story is more uncomfortable. The AI server market is a capital-intensive, low-margin business where scale determines survival. Super Micro competes against Dell Technologies and Hewlett Packard Enterprise, both of which carry investment-grade credit ratings and have the luxury of funding customer orders through vendor-financing programmes that Super Micro cannot easily replicate. As NVIDIA accelerates its product cadence — moving from a two-year to a one-year rhythm between GPU generations — server builders must constantly retool assembly lines and hold ever-larger inventories of high-cost components. A single Blackwell Ultra rack can carry a bill-of-materials exceeding $3 million. For Super Micro, which builds to order and prides itself on rapid delivery, the working-capital demands have become voracious.
“This isn’t a company raising money because it’s in distress; it’s a company raising money because the TAM is sprinting away from it,” said Stacy Rasgon, senior analyst at Bernstein, in a research note that nonetheless trimmed his price target to $42 from $48. “The question is whether management can execute at a level that justifies the incremental capital. The track record there is mixed.”
Indeed, Super Micro’s liquid-cooling technology — a genuine competitive advantage that allows data centres to pack more GPUs into a single rack without overheating — has won it coveted slots at leading AI labs. But those design wins require upfront investment in manufacturing capacity, testing facilities, and service teams. The company has already committed $800 million to a new campus in San Jose, California, and is scouting sites in Malaysia and Mexico. A $7 billion war chest would transform its industrial footprint. It would also, if history is any guide, invite the scrutiny of short-sellers who have long argued that Super Micro’s reported margins are too good to be true.
Implications and second-order effects
The financing plan will ripple well beyond Super Micro’s shareholder register. First, it signals that the AI infrastructure build-out is entering a phase where even well-capitalised equipment suppliers need external funding to keep pace. That has implications for the broader supply chain: component suppliers such as Vicor, Monolithic Power Systems, and Amphenol may face intensified pressure to extend payment terms, while competitors may be forced to follow suit with their own dilutive raises.
Second, the debt market’s reception will be a crucial test. Super Micro currently carries a BB- rating from S&P, three notches below investment grade. Loading an additional $3 billion or $4 billion in leverage onto the balance sheet — assuming a roughly 50-50 equity-debt split — could push leverage ratios above 4x EBITDA, a level that would make credit committees nervous. A downgrade to B+ territory would lift borrowing costs at precisely the moment the company needs the cheapest possible capital to finance razor-thin-margin hardware sales. The OECD’s latest capital-market monitor notes that credit spreads for tech hardware issuers have widened by 85 basis points since January, reflecting growing anxiety about overcapacity in AI-adjacent industries.
Third, for the wider AI ecosystem, the scale of Super Micro’s ask is a data point in the debate over whether AI infrastructure is overbuilding. Venture-capital firm Sequoia Capital recently estimated that the gap between AI infrastructure revenue expectations and actual end-user demand now exceeds $500 billion. If Super Micro needs $7 billion to meet its order book, the implied capex cycle is still accelerating — a bullish signal for NVIDIA, TSMC, and Arista Networks, but a warning for anyone betting on a near-term plateau.
Competing perspectives
Not everyone reads the filing as a bearish signal. Rosenblatt Securities analyst Hans Mosesmann, a long-time Super Micro bull, reiterated his buy rating on Tuesday and described the shelf registration as “a necessary prerequisite for capturing a $100 billion AI server TAM by 2028.” In a note titled “Blink and You’ll Miss the Opportunity,” Mosesmann argued that the company’s direct-liquid-cooling expertise and its close design collaboration with NVIDIA give it a “structural moat that is undervalued by a market fixated on near-term dilution.” He points to the fact that Super Micro’s server revenue grew 110% year-on-year in the March quarter even as gross margins ticked up to 15.6%, evidence that pricing power is not yet eroding.
The counterargument, articulated most forcefully by short-seller Jim Chanos in a television appearance on Tuesday, is that Super Micro’s history of accounting irregularities makes any large-scale capital raise inherently risky. “You’re handing a blank cheque to a management team that couldn’t file its financials on time for two consecutive years,” Chanos told Bloomberg Television. “The $7 billion number is so large relative to the company’s tangible book value that it looks less like a growth plan and more like a bailout we don’t yet understand.” Super Micro settled an SEC investigation in late 2025 with a $40 million penalty and a restatement that wiped $340 million from retained earnings, but the episode left scars that the latest filing has reopened.
Between these poles sits a more pragmatic view: the company has little choice. Demand for AI compute is voracious, lead times on NVIDIA’s highest-end GPUs remain long, and the cost of being a sub-scale player in merchant silicon integration is obsolescence. If Super Micro does not raise capital now, it cedes ground to Dell, which has already announced a $2.5 billion AI server financing facility of its own, and to the hyperscalers’ in-house server designs
Super Micro’s $7 billion shelf filing is a Rorschach test for how an investor views the AI infrastructure cycle. To the optimist, it is the prelude to a revenue breakout that will make the dilution arithmetic look quaint. To the sceptic, it is the latest chapter in a corporate saga that has repeatedly tested the limits of credulity. Both narratives can’t be true, but the market’s job is to price the probability of each.
Charles Liang built Super Micro from a San Jose garage in 1993 into an essential cog in the world’s most important technology trend. That history buys him a measure of patience from long-term shareholders, but it does not insulate the stock from the cold mechanics of supply and demand. On Tuesday, the supply of new paper overwhelmed the demand for the story. Super Micro just placed the largest bet of its life on the table. The roulette wheel is still spinning.
Discover more from The Economy
Subscribe to get the latest posts sent to your email.

The Pragmatic Pivot: Etihad European Expansion Signals New Strategy

Can You Be Fired Verbally in the UAE? The Legal Reality

Pakistan’s FY27 Budget Bets on 4% Growth While Defence Spending Crosses Rs3 Trillion

Isme Tells Government to Redirect FDI Funding Towards Irish Entrepreneurs

Asia Energy Crisis Hits ‘Worst-Case Scenario’ as ADB Warns of Structural Collapse

The Automated Authority: Inside the KPMG AI Report Hallucination Scandal

Hong Kong Bank Accounts for Mainland Residents: Capital Flight Surge

Pakistan’s AI moment: Rs9bn prescription for a structural problem

SpaceX IPO: Musk Raises $75bn in History’s Largest Listing

Tightrope Walk: Pakistan Unveils Crucial FY2026-27 Federal Budget Today

Public Debt Bond Markets: Why Investors Learned to Love Debt

Xponential Fitness Franchise Lawsuit: The $3.97M Judgment

UK Labour Productivity: Are We Finally Seeing a Rebound?

UK Stablecoin Regulation: Can Britain Catch Up?

China Overhauls the World’s Biggest Surveillance Network with Advanced AI

Kevin Warsh Takes the Fed’s Helm — and Walks Straight Into a Rate-Hike Storm

S&P 500 Slips Back to 7,408 as Oil Storms Past $109, Bond Yields Clock 19-Year Highs

McKinsey’s Post-AI Pay Reckoning: Why Partners Face Cash Cuts in a Radical Compensation Overhaul

SpaceX, OpenAI & Anthropic IPOs: Wall Street’s $200B AI Test

SpaceX IPO: Inside the $2 Trillion Market Debut

How AI Is Forcing McKinsey and Its Peers to Rethink Pricing

SpaceX IPO Set to Lock In Musk’s Control With Mars-Linked Pay Deal

KPMG Australia CEO Resigns After Whistleblower Claims Exposed Investigation Failures

Why Selling Persists at the PSX as the US-China Stalemate on Iran Deepens Market Jitters

The Guardrails Are Down: How Meta and Google’s AI Models Fold Under Pressure

Cerebras IPO: The Wafer-Scale AI Challenger That Just Priced at $185 — and Why the Market Is Betting It Can Crack Nvidia’s Fortress

Broadcom Market Value Loss: Revenue Forecast Disappoints

Is AI Already Putting Graduates Out of Work? The Grim Reality Facing the Class of 2026
-

 Markets & Finance5 months ago
Top 15 Stocks for Investment in 2026 in PSX: Your Complete Guide to Pakistan’s Best Investment Opportunities
-

 Analysis4 months ago
Top 10 Stocks for Investment in PSX for Quick Returns in 2026
-

 Analysis4 months ago
Brazil’s Rare Earth Race: US, EU, and China Compete for Critical Minerals as Tensions Rise
-

 Banks5 months ago
Best Investments in Pakistan 2026: Top 10 Low-Price Shares and Long-Term Picks for the PSX
-

 Investment5 months ago
Top 10 Mutual Fund Managers in Pakistan for Investment in 2026: A Comprehensive Guide for Optimal Returns
-

 Analysis4 months ago
Johor’s Investment Boom: The Hidden Costs Behind Malaysia’s Most Ambitious Economic Surge
-

 Global Economy6 months ago
15 Most Lucrative Sectors for Investment in Pakistan: A 2025 Data-Driven Analysis
-

 Global Economy6 months ago
Pakistan’s Export Goldmine: 10 Game-Changing Markets Where Pakistani Businesses Are Winning Big in 2025