
Asia
DP World Chief Sultan bin Sulayem Resigns Amid Jeffrey Epstein Email Revelations


Dubai logistics giant removes chairman and CEO following pressure over decade-long correspondence with convicted sex offender
Sultan Ahmed bin Sulayem, the influential executive who transformed DP World into one of the world’s largest port operators, resigned from his dual role as chairman and CEO on Friday following revelations of extensive communications with convicted sex offender Jeffrey Epstein.
The Dubai-based logistics giant announced bin Sulayem’s immediate departure and the appointment of Essa Kazim as chairman and Yuvraj Narayan as group CEO, ending his nearly two-decade tenure at the helm of the company.
The resignation comes just days after U.S. lawmakers revealed bin Sulayem’s identity in recently declassified Department of Justice files related to Epstein, and follows mounting pressure from major institutional investors who had paused partnerships with DP World pending action.
Pressure from Investors and Lawmakers
The controversy intensified earlier this week when Representatives Thomas Massie (R-Ky.) and Ro Khanna (D-Calif.) identified bin Sulayem among individuals whose names had been redacted in Epstein files released under the Epstein Files Transparency Act. The lawmakers had been granted access to unredacted documents as part of a bipartisan effort to increase transparency in the files.
On Monday, Massie drew specific attention to a 2019 email exchange that included a message from Epstein stating, “I loved the torture video.” The Kentucky Republican wrote on social media platform X: “A Sultan seems to have sent this. DOJ should make this public.”
While Deputy Attorney General Todd Blanche accused Massie of “grandstanding,” noting that bin Sulayem’s name appeared unredacted elsewhere in the files, the public identification triggered swift consequences for the DP World executive.
Investor Backlash
Two major institutional investors announced suspensions of new business with DP World this week, citing concerns over the Epstein connection.
Canada’s second-largest pension fund, La Caisse de dépôt et placement du Québec, which has invested more than $5 billion alongside DP World over the past decade, including a $2.5 billion investment in Jebel Ali Port in 2022, said it would pause “additional capital deployment alongside the company” until the situation was addressed.
British International Investment (BII), the UK government’s £9.9 billion ($13.6 billion) development finance institution, halted all new investments with DP World. Both organizations emphasized the need to distinguish between the company and the individual at the center of the controversy.
Following Friday’s leadership change, both investors indicated they would resume partnerships. La Caisse spokesman Jean-Benoît Houde confirmed the pension fund was satisfied with the company’s response: “The company took appropriate measures. It has always been important to distinguish the company, DP World, from the individual, Sultan Ahmed bin Sulayem.”
BII similarly welcomed the decision, stating it looked forward to “continuing our partnership to advance the development of key African trading ports to unlock the continent’s global trading potential.”
The Epstein Connection
The DOJ files reveal a relationship between Epstein and bin Sulayem spanning more than a decade, including years after Epstein’s 2008 conviction for soliciting a minor for prostitution. According to the documents, Epstein referred to bin Sulayem as a “close personal friend” and one of his most trusted friends.
The correspondence between the two men covered a range of topics, including business discussions, dinner and travel plans, and references to visiting Epstein’s private Caribbean island. The emails also included sexually explicit content, discussions about escort services, and lewd comments about women.
Critically, bin Sulayem has not been accused of any criminal wrongdoing, and the files do not implicate him in Epstein’s crimes. However, the nature and duration of the friendship—particularly its continuation after Epstein’s conviction—proved untenable for the publicly-traded bonds issuer and its institutional partners.
A Transformative Tenure
Bin Sulayem’s departure marks the end of an era for DP World. He served as chairman since 2007 and CEO since 2016, presiding over the company’s transformation from a regional UAE port operator into a global supply chain powerhouse.
Under his leadership, DP World expanded to operations in more than 75 countries across six continents, with a network of over 90 terminals. The company now handles approximately 10 percent of global container traffic—roughly 82 million twenty-foot equivalent units (TEUs) annually across its portfolio.
The company’s 2024 revenue exceeded $20 billion, a 9.7 percent increase from the previous year, with adjusted EBITDA of $5.5 billion. First-half 2025 results showed continued momentum, with revenue growing 20.4 percent year-on-year to $11.2 billion.
Beyond traditional port operations, bin Sulayem drove DP World’s evolution into an integrated logistics provider, acquiring companies throughout the supply chain. Notable moves included the 2021 acquisition of Syncreon for $1.2 billion and Imperial Logistics in 2022, building out freight forwarding capabilities across 300 locations covering 90 percent of global trade lanes.
Bin Sulayem was also instrumental in establishing Dubai’s position as a global trading hub. Prior to DP World, he founded Nakheel, the real estate developer behind Dubai’s iconic palm-shaped islands, and contributed to the creation of the Dubai Multi Commodities Centre (DMCC). A regular at the World Economic Forum and other global business gatherings, he was one of the most prominent business figures in the Middle East.
New Leadership
Essa Kazim, the incoming chairman, currently serves as governor of the Dubai International Financial Centre and brings extensive experience in finance and governance.
Yuvraj Narayan, the new CEO, has been with DP World since 2004 and most recently served as group deputy CEO and chief financial officer. He played a key role in the company’s recent strategic acquisitions and financial performance, overseeing the expansion of logistics capabilities and maintaining strong cash generation despite global trade disruptions.
In a statement released through the UAE government’s Dubai Media Office, DP World said the new appointments “support its strategy for sustainable growth and reinforce its role in strengthening global supply chains and supporting Dubai’s position as a leading hub for trade and logistics.” The statement made no mention of bin Sulayem.
Broader Implications
Bin Sulayem’s resignation is one of the most high-profile departures linked to the Epstein files. Goldman Sachs general counsel Kathy Ruemmler announced her planned summer resignation after revelations of her ties to Epstein, while several members of British Prime Minister Keir Starmer’s administration stepped down following controversy over the appointment of Peter Mandelson—another figure connected to Epstein—as ambassador to the United States.
For DP World, the swift leadership transition appears designed to contain reputational damage and maintain relationships with key institutional partners. The company continues to operate major ports and logistics facilities in strategic locations worldwide, including significant operations in Canada, the United Kingdom, India, and across Africa.
The logistics industry will be watching closely to see whether the leadership change affects DP World’s ambitious expansion plans, which include $2.5 billion in capital expenditure planned for 2025 across projects in the UAE, UK, India, Senegal, and Saudi Arabia.
The Path Forward
DP World’s ability to weather this crisis will depend on maintaining the confidence of cargo owners, shipping lines, and institutional investors who rely on its global network. The company’s operational performance remains strong—container volumes grew 5.6 percent on a like-for-like basis in the first half of 2025, reaching 45.4 million TEUs.
The new leadership team inherits a company with significant assets, including the flagship Jebel Ali Port in Dubai, London Gateway, and major developments across emerging markets. However, they also face the challenge of restoring trust and demonstrating that the company’s governance structures can prevent similar controversies.
For Dubai and the broader UAE, bin Sulayem’s fall from grace represents a rare public setback for one of its most successful business leaders. His role in shaping Dubai’s economic transformation over the past two decades made him virtually synonymous with the emirate’s logistics and trade ambitions.
As DP World moves forward under new leadership, the company’s statement emphasized continuity and commitment to its strategic vision. Whether institutional investors and customers fully separate the individual from the institution remains to be seen, but Friday’s swift action appears aimed at turning the page on a damaging chapter while preserving the company’s position in global trade.
The Epstein files continue to reverberate through business and political circles worldwide, with more revelations potentially forthcoming as lawmakers press for additional transparency. For now, one of the logistics industry’s most prominent figures has been removed from the board, a stark reminder that associations with Epstein—even absent criminal allegations—have become professionally untenable in the current climate.
DP World operates in more than 75 countries with over 90 marine and inland terminals. The company employs approximately 103,000 people worldwide and is majority-owned by Dubai World, a government-controlled investment company.
Discover more from The Economy
Subscribe to get the latest posts sent to your email.


Are Asian stock markets rising in 2026?
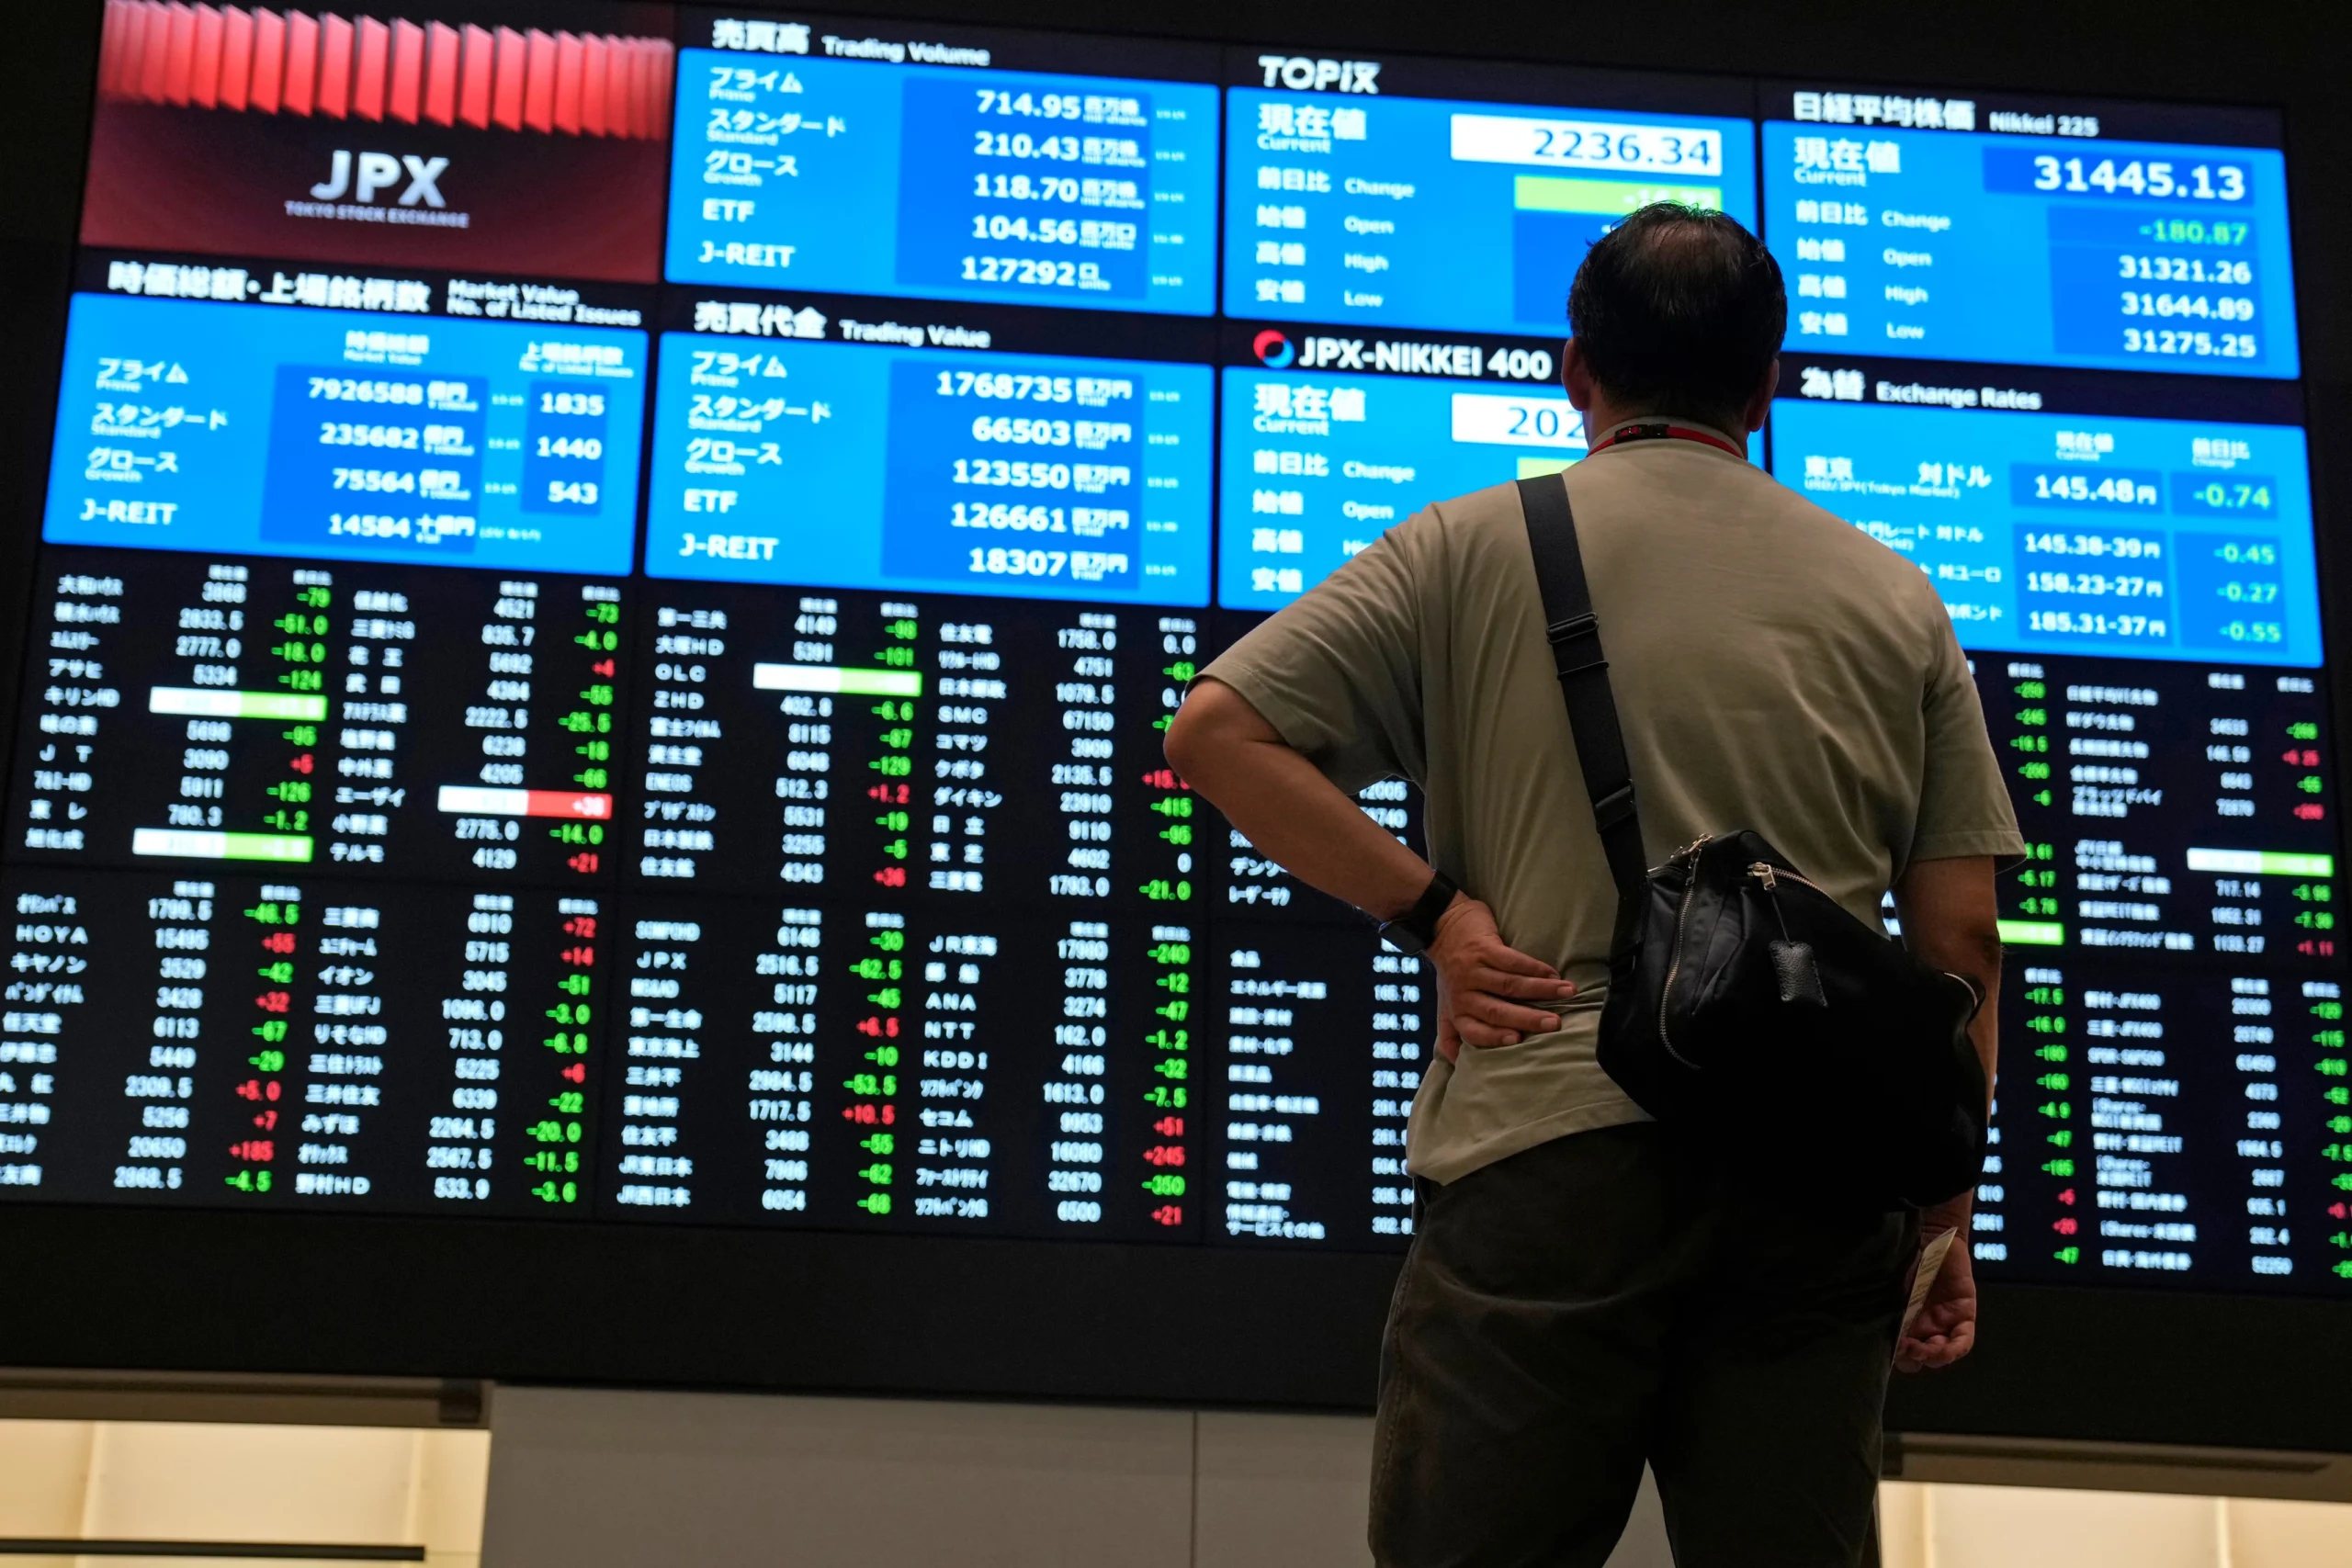
Most of them are, but for very different reasons. Japan’s Nikkei 225 is trading at levels roughly 44% higher than a year ago on continued AI-linked technology strength; China’s benchmark indices climbed to multi-year highs at the start of the year on AI optimism and signs of economic recovery; and Pakistan’s KSE-100 has been one of the most volatile large gainers globally, crossing record highs early in the year before enduring sharp single-session pullbacks in September. Understanding each market separately matters more than treating “Asia” as one trade.
Japan: A 15-Year-Plus Bull Run Meets a Hawkish Central Bank
The Nikkei 225 closed at 65,018.95 on September 18, 2026, gaining 1.38% on the session and sitting 44.34% above where it stood a year earlier, according to data compiled by Trading Economics. That move came even as the Bank of Japan raised its policy rate by 25 basis points to 1.25% — a widely expected but still consequential tightening step, as policymakers balance elevated inflation and wage growth against pressure from U.S. Treasury Secretary Scott Bessent for currency and trade cooperation. Japan’s annual inflation rate held at 1.9% in August, with core inflation at 1.7% — below the Bank of Japan’s 2% target for a seventh straight month, suggesting the central bank still has room to normalize policy gradually rather than aggressively.
Technology and AI-related names have led Japan’s rally, with chip-equipment and materials names such as Advantest and Lasertec posting some of the sharpest single-day gains, echoing similar advances on Wall Street. That correlation is a theme across the region: Asian equity performance in 2026 has tracked the U.S. AI-capex story almost as closely as it has tracked domestic fundamentals.
China: AI Optimism Meets an Overheating Warning
China’s equity markets opened 2026 on a tear. The benchmark CSI 300 Index advanced 1.6% to close at its highest level in four years on January 6, while the Shanghai Composite rose 1.5% to its strongest level since July 2015, fueled by sustained optimism over the country’s AI advances and early signs of broader economic recovery, according to Bloomberg. Materials and technology shares led the advance, and the rally coincided with a robust pipeline of onshore AI-related IPOs.
That said, the rally showed early signs of overheating even in January: the 14-day relative strength index on the Shanghai Composite climbed above 75 — firmly into technical overbought territory — a level it had not touched since the previous September. Momentum has been uneven since; by late July, the Shanghai Composite had pulled back to a 16-week low on the CSI 300 gauge even as the broader index posted modest daily gains, reflecting a market still working through the tension between AI-driven optimism and valuation discipline. On the macro side, the IMF’s own China growth revisions this year have tracked a similar push-pull, with earlier 2025 forecasts putting Chinese growth near 4.8% before moderating toward roughly 4.2% as trade and property-sector headwinds persist.
Malaysia and Singapore: Steady Gains, Regional Correlation
Malaysia’s FTSE Bursa Malaysia KLCI has spent much of 2026 grinding toward multi-year highs rather than posting dramatic single-day swings. The index touched a more-than-six-year high near 1,686 points in early January, according to New Straits Times, and by early September had climbed further to around 1,714–1,715 points, per Bursa Malaysia futures data reported by Bernama, Malaysia’s state news agency. Analysts at Rakuten Trade have described the index as being in a healthy uptrend across both short- and long-term timeframes, with pullbacks read as consolidation rather than a change in trend.
Singapore’s Straits Times Index has moved in tandem with regional sentiment through the year, trading in the high-3,900-point range during mid-2026 sessions alongside comparable moves in Hong Kong’s Hang Seng and South Korea’s Kospi — a reminder that Southeast Asian and Northeast Asian benchmarks remain tightly correlated on any given trading day, even when their underlying economic drivers differ.
Pakistan: The Region’s Most Volatile Outperformer
Featured Snippet Target: Pakistan’s KSE-100 Index began 2026 at a record high above 176,000 points, climbed further past 186,000 and 188,000 in the following days on institutional buying and expectations of a policy rate cut, but has since seen sharp single-session pullbacks — including a 3,078-point, 1.79% drop on September 10 — underscoring how the world’s best-performing frontier market in early 2026 has also been among its most volatile.
The Pakistan Stock Exchange’s rally traces back to a shift in domestic asset allocation: brokerage house Topline Securities described the move from fixed-income instruments into equities — driven by falling returns on traditional savings vehicles — as the primary fuel behind sustained liquidity and elevated valuations, according to coverage from Aaj News. Banking names including United Bank Limited, Habib Bank, and MCB, alongside energy majors like Oil and Gas Development Company, have repeatedly featured among the index’s top contributors on both up and down days.
By early September, the picture had turned choppier. The KSE-100 gained 399 points on September 4 to close at 175,328, per ARY News, before dropping over 3,000 points just days later on September 10 — a reminder that Pakistan’s rally, while historic in percentage terms, remains far more sensitive to single-session sentiment shifts than its larger regional peers.
The Cross-Market Pattern
Three threads tie these otherwise disconnected markets together in 2026. First, AI-linked capital spending is now a genuine cross-border driver — Japanese and Chinese tech names have both rallied on echoes of the same U.S. hyperscaler capex story. Second, central bank policy divergence is widening: Japan is tightening from historically ultra-loose settings, while Pakistan has been cutting rates to support a still-fragile broader economy. Third, frontier and emerging markets — Pakistan chief among them — are delivering far larger percentage swings, in both directions, than developed Asian benchmarks, rewarding investors who can tolerate volatility but punishing those who chase momentum without hedging for pullbacks.
The Bottom Line
Asia’s 2026 story is not one market but five distinct ones moving on different clocks — Japan’s AI-and-rate-hike rally, China’s optimism-versus-overheating tension, Malaysia and Singapore’s steadier regional drift, and Pakistan’s high-beta swings around a genuine structural re-rating. Anyone allocating across the region needs a market-by-market view rather than a single “Asia” thesis.
Next step: Track Bank of Japan policy meetings, China’s Politburo economic guidance sessions, and Pakistan’s State Bank Monetary Policy Committee decisions together — the three events, spaced through the remainder of 2026, are the clearest near-term catalysts for each market’s next move.
Discover more from The Economy
Subscribe to get the latest posts sent to your email.

The World Bank’s June 2026 assessment carries a phrase that should stop any investor mid-scroll: a “lost decade” of development for many emerging markets.
Global growth is projected to slow from 2.9% in 2025 to 2.5% in 2026 — the lowest rate since the COVID-19 pandemic — amid weaker prospects for energy-importing economies and those directly affected by hostilities.
Within that aggregate, Asia is splitting into two distinct groups. Understanding which side an economy falls on is now the primary emerging-market allocation decision.
Key Takeaways
- Global growth: 2.5% in 2026, firming in 2027–28 as energy supplies recover and trade strengthens.
- The revision was brutal. January 2026 projected 2.6% with an upward revision; June cut it.
- India remains the outlier. FY2026-27 growth of 6.6%, rebounding to 7.2% in FY2027-28.
- China decelerates. Growth slowing to 4.4% in 2026 from 4.9%.
- The 2020s are on track to be the weakest decade for global growth since the 1960s.
The Two Reports That Define 2026
The World Bank publishes Global Economic Prospects twice a year, and the gap between the January and June 2026 editions is the story.
January: Cautious Optimism
The January report described a global economy proving more resilient than anticipated despite persistent trade tensions and policy uncertainty, with growth easing to 2.6% in 2026 before rising to 2.7% in 2027 — an upward revision from the previous June forecast.
About two-thirds of that upgrade came from the United States alone.
June: The Energy Shock
By June, the Middle East conflict had driven sharp energy price increases and the projection fell to 2.5%, with emerging market and developing economies facing the weakest per capita income growth since the pandemic.
The Bank explicitly notes that the conflict’s impact on global trade has been partly offset by robust AI-related investment, while consensus inflation expectations picked up notably following the energy price surge. Local-currency bond yields and external bond spreads remained higher in commodity importers.
That last sentence is the whole emerging-market thesis in one line: commodity importers are paying more to borrow at exactly the moment they need to borrow more.
Asia’s Two Tiers
| Economy | Projection | Position |
|---|---|---|
| India | 6.6% FY26-27, 7.2% FY27-28 | Domestic-demand-led, upgraded |
| China | 4.4% in 2026 (from 4.9%) | Export-supported, stimulus-dependent |
| EMDEs (all) | 4.0% in 2026 (from 4.2%) | Slowing |
| EMDEs excl. China | 3.7% in 2026 | Flat versus 2025 |
| United States | 2.2% in 2026 | Tax-incentive supported |
The EMDE-excluding-China figure of 3.7%, unchanged from 2025, is the number that matters most and gets quoted least. Strip out China, and the developing world is not slowing — it simply is not accelerating. Stagnation at a level too low to close income gaps.
The India Case
India stands apart in the June projections. Growth is projected to moderate to 6.6% in FY2026-27 — a 0.1 percentage point upgrade relative to January — before rebounding to 7.2% in FY2027-28, a 0.6 point upgrade.
The moderation reflects private demand cooling under input cost pressures. The rebound reflects structural factors:
- Trade agreements. Implementation of major FTAs with the EU, UK and Australia is described as crucial to offsetting cooling merchandise demand from traditional Western markets.
- FDI sustainability. Trade agreements and structural business reforms are expected to sustainably support inflows across the forecast horizon.
- Fiscal trade-offs. Lower fuel taxes and GST reforms temporarily erode the revenue base, requiring a shift toward slower public capex growth and current spending cuts to avoid deficit spikes.
That last point is the underappreciated risk. India’s growth upgrade is partly financed by revenue concessions that must eventually be reversed or absorbed.
The China Case
China’s projected slowdown to 4.4% in 2026 came with an upward revision of four-tenths of a percentage point from the previous June forecast, attributed to fiscal stimulus and increased exports to non-US markets.
That revision has since been validated by trade data. The question for 2027 is whether export strength can persist if global demand slows to the 2.5% pace the Bank projects.
China’s position is structurally different from India’s: externally driven where India is domestically driven, stimulus-dependent where India is reform-dependent.
What the “Lost Decade” Framing Actually Means
The World Bank’s language is deliberately stark. If current forecasts hold, the 2020s are on track to be the weakest decade for global growth since the 1960s and too low to avert stagnation and joblessness in emerging market and developing countries.
The distributional evidence is concrete: at the end of 2025, nearly all advanced economies enjoyed per capita incomes exceeding their 2019 levels, but about one in four developing economies had lower per capita incomes than before the pandemic.
Chief Economist Indermit Gill framed the underlying tension precisely: the global economy has become less capable of generating growth while appearing more resilient to policy uncertainty — a divergence he warned cannot persist without fracturing public finance and credit markets.
Investment Implications by Tier
Tier 1 — Energy importers in the technology value chain. India, Vietnam, Malaysia, Taiwan, Korea. AI-related export revenues offset higher energy costs. Currency and equity performance has held up.
Tier 2 — Energy exporters outside the conflict zone. Gulf states excluding those directly affected, parts of Africa and Latin America. Favourable terms of trade, fiscal space expanding.
Tier 3 — Energy importers outside the technology chain. Pakistan, Bangladesh, Sri Lanka, Kenya, much of Sub-Saharan Africa. Higher import bills, higher borrowing costs, no offsetting export windfall.
Tier 3 is where sovereign stress concentrates. Higher local-currency bond yields and wider external spreads in commodity importers mean refinancing costs rise as fiscal positions deteriorate.
What This Means for the Global Market in 2027
The 2027 recovery is conditional on two assumptions. Activity is expected to firm in 2027–28 as energy supplies recover and trade strengthens. Both require the conflict to de-escalate. Neither is guaranteed.
AI adoption is the identified upside. The Bank names artificial intelligence adoption, clean energy investment and regional trade agreements as potential long-term recovery catalysts. Only the first is currently delivering at scale.
Sovereign debt is the accumulating risk. Elevated yields in commodity importers compound every year they persist. A 2027 refinancing wave at current spreads would strain multiple frontier sovereigns simultaneously.
Regional trade agreements are the underrated policy lever. India’s FTA implementation is the clearest test case. If it delivers the projected FDI and export offset, it becomes a template for the rest of emerging Asia.
Compare the IMF and World Bank carefully. The Fund projects 3.0% for 2026; the Bank projects 2.5%. The difference is methodological — PPP versus market exchange rate weighting — not a disagreement about the world.
Frequently Asked Questions
What is the World Bank’s global growth forecast for 2026?
The June 2026 Global Economic Prospects projects global growth slowing to 2.5% in 2026, down from 2.9% in 2025 — the lowest rate since the pandemic.
What is India’s projected GDP growth?
India is projected to grow 6.6% in FY2026-27 before rebounding to 7.2% in FY2027-28, both upgrades relative to January 2026 projections.
Why are World Bank and IMF forecasts different?
The World Bank weights using market exchange rates while the IMF uses purchasing-power-parity weights, which gives more weight to faster-growing emerging economies.
What does “lost decade” mean for emerging markets?
The Bank warns the 2020s could be the weakest decade for global growth since the 1960s, with roughly one in four developing economies having lower per capita incomes at end-2025 than in 2019.
Discover more from The Economy
Subscribe to get the latest posts sent to your email.
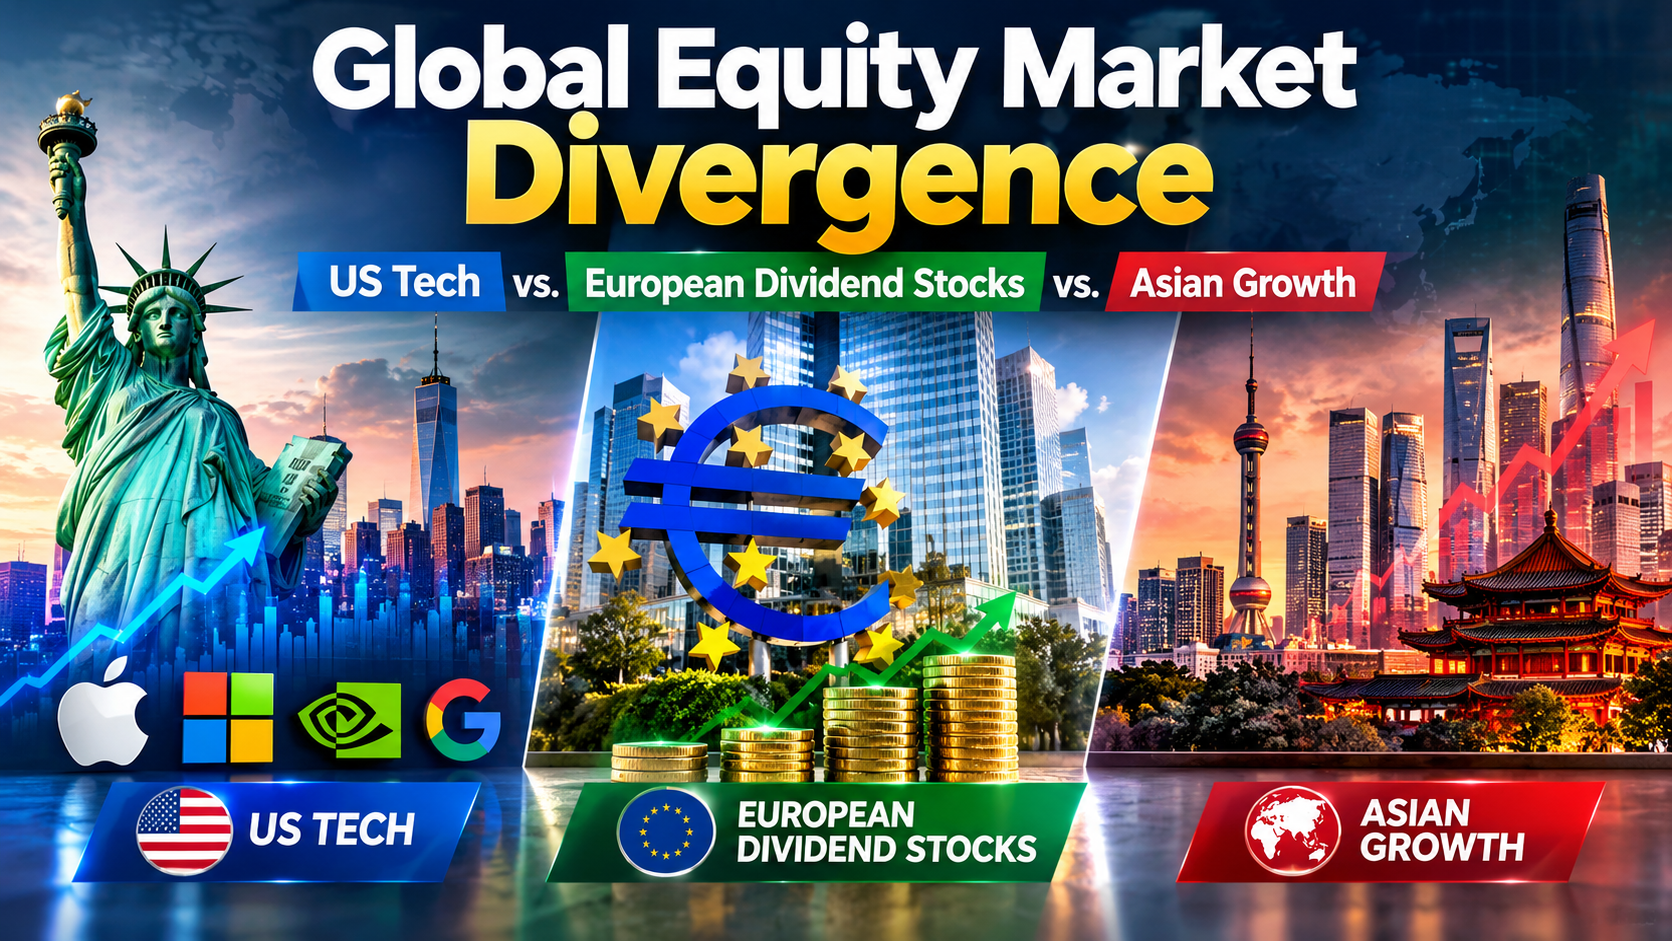
S&P 500 at 7,620, FTSE at 10,698, Nikkei at 64,136. Compare US tech, European dividends and Asian growth as three central banks split on rates.
Executive Summary / Key Takeaways
- The three major regions are now priced off three different monetary regimes: the Fed hiking into strength, the ECB hiking into weakness, and the Bank of Japan normalising from near zero.
- On the day of the Fed’s hike, the Dow fell more than 600 points while the Nasdaq finished close to flat — a clean demonstration that “US equities” is no longer a single exposure.
- European indices held up: the FTSE 100 sat at 10,697.57 (+0.44%) while the DAX at 25,440.81 and Euro Stoxx 50 at 6,260.38 slipped.
- Japan outperformed on currency mechanics, with the Nikkei at 64,136 and the Topix at 4,094.
- Yardeni Research cut its year-end S&P 500 target to 7,900 from 8,400, citing yield pressure from rising energy prices.
Regional equity allocation has spent a decade being a low-conviction decision. Global indices moved together, US technology led, and everything else was a funding source. September 2026 broke that pattern within a single trading week.
The trigger was monetary divergence. The Federal Reserve raised rates to 3.75%–4.00% on 16 September. The ECB had already lifted its deposit rate to 2.5% on 10 September. The Bank of England held at 3.75% on a 6-3 split on 17 September, and the Bank of Japan is expected to hike on 18 September.
Four decisions, four different directions of travel, four different equity responses. That is the environment retail investors and portfolio managers now have to allocate into.
2. Core Market Analysis
2.1 The comparison matrix
| Region / Index | Level | Move | Monetary regime | Primary source |
|---|---|---|---|---|
| S&P 500 (US) | 7,619.98 | -0.48% | Fed tightening; ≥1 more hike signalled | Yahoo Finance |
| Nasdaq Composite (US) | 26,186.41 | -0.56% | Duration-sensitive; held up on Fed day | Yahoo Finance |
| Dow Jones (US) | 52,421.20 | -0.29% | Fell 600+ pts on the hike itself | Yahoo Finance |
| FTSE 100 (UK) | 10,697.57 | +0.44% | BoE on hold at 3.75% | Yahoo Finance |
| DAX (Germany) | 25,440.81 | -0.50% | ECB at 2.5% deposit rate | Yahoo Finance |
| CAC 40 (France) | 8,117.78 | -0.76% | ECB at 2.5% deposit rate | Yahoo Finance |
| Euro Stoxx 50 | 6,260.38 | -1.02% | Weakest major European print | Yahoo Finance |
| Nikkei 225 (Japan) | 64,136 | +0.33% | BoJ normalising; weak yen tailwind | Trading Economics |
| Hang Seng (HK) | 24,713 | +0.2% | Pegged; HKMA hiked to 4.25% | Trading Economics |
| VIX | 17.10 | +7.95% | Volatility bid but not stressed | Yahoo Finance |
2.2 US: the index is not the market
The single most revealing datapoint of the week was the internal dispersion on Fed day. Stocks turned lower during Warsh’s press conference as markets read his remarks as hawkish, with the Dow leading losses down more than 700 points at one stage — over 1.6% — while the S&P 500 declined 0.4% and the Nasdaq slid just below flat, Yahoo Finance reported.
Conventional rate logic says long-duration growth should suffer most when yields rise. It did not. The cyclical, energy-exposed and rate-sensitive parts of the market took the damage instead: J.B. Hunt Transport fell 12.64% after warning on earnings and rising operating costs, Diamondback Energy dropped 8% amid concerns over inflation, rising Treasury yields and crude-market geopolitical risk, and APA Corp fell 5.2%, according to TheStreet’s market coverage. Optical and photonics names rebounded, with Coherent and Lumentum each up around 6%.
The forward view has been trimmed. Yardeni Research cut its year-end S&P 500 target to 7,900 from 8,400 — implying 4.1% upside from Tuesday’s close of 7,585.73 rather than the 11% its previous estimate implied — citing higher Treasury yields due to rising energy prices and increased downturn risk over the next three to six months, CNBC reported.
2.3 Europe: the dividend case
European equities are not outperforming on growth. Euro-area output is projected around 1.3% for 2026 by the IMF, with the region benefiting less than others from the technology-driven investment boost and lingering energy-price effects still dragging on manufacturing.
They are outperforming, where they are, on payout and valuation. With the ECB deposit rate at 2.5% — the loosest of the major blocs — the yield competition from cash and short-dated bonds is materially weaker in Europe than in the US, where the funds rate is now 3.75%–4.00% and the 10-year has topped 5%. That relative-yield arithmetic is the structural argument for European income equity in this cycle, and it holds regardless of European growth being mediocre.
The UK sits awkwardly between the two. The FTSE’s commodity and energy weighting makes it a partial beneficiary of the same oil shock hurting importers elsewhere, which explains its positive print against a broadly weaker European tape.
2.4 Asia: growth with a currency asterisk
Japan’s advance came from yen weakness after the Fed decision, which improved the earnings outlook for export-focused industries, Trading Economics noted. Hong Kong’s caution came from the HKMA following the Fed with a hike to 4.25%, pressuring property.
The regional growth case is real — East Asia and Pacific is projected at 4.2% for 2026 and South Asia at 6.3% by the World Bank — but a meaningful share of recent Japanese equity return has been a currency effect that BoJ normalisation will erode.
3. Structural Drivers and Competitor Gaps
The gap in most comparative coverage is treating this as a regional rotation call. It is better understood as three separate factor exposures that happen to have geographic labels:
- US large-cap technology is a duration and AI-capex exposure. It held up on Fed day because the AI investment cycle is currently a stronger driver than the discount rate. Both the IMF and World Bank cite broader AI adoption as the principal upside risk to global growth. If that capex cycle cools, the rate sensitivity reasserts itself immediately.
- European income equity is a relative-yield exposure. Its attractiveness is a function of the ECB-Fed policy gap, not of European fundamentals. Narrow the gap and the case weakens.
- Asian growth equity is partly a currency exposure. Particularly in Japan, where the return decomposition between earnings and FX is doing more work than most allocators acknowledge.
Correctly labelled, these are not substitutes for one another. The diversification benefit of holding all three is higher in 2026 than at any point in the past decade — which is the practical conclusion most aggregator coverage fails to reach.
4. Key Implications for Stakeholders
Retail investors. A global index fund currently buys you a heavy weighting to a single factor: US technology and its AI capital-expenditure cycle. If that is the intended exposure, fine. If not, deliberate regional allocation is required to get it.
Portfolio managers. Volatility is bid but not stressed, with the VIX at 17.10 — an unusually calm reading given four central bank decisions in eight days and crude above $100. That combination favours adding hedges while they remain inexpensive rather than after a repricing.
Income investors. The yield hurdle is regional now. In the US, equity income competes against a 10-year above 5%. In the euro area, it competes against a 2.5% deposit rate. The same dividend yield is a materially better proposition in one market than the other.
Risk teams. Cross-regional correlation assumptions built on the 2015–2021 regime are stale. Three distinct monetary cycles produce genuinely differentiated drawdown paths.
5. Frequently Asked Questions
Q1: Why did the Nasdaq hold up while the Dow fell after the Fed hike?
The damage concentrated in cyclical, transport and energy-exposed names rather than long-duration technology. Investors are currently treating the AI capital-expenditure cycle as a stronger earnings driver than the discount rate is a valuation headwind.
Q2: Are European dividend stocks more attractive than US equities now?
On relative yield, arguably. The ECB deposit rate is 2.5% against a US funds rate of 3.75%–4.00% and a 10-year Treasury above 5%, so European equity income faces far weaker competition from cash and bonds. European growth, however, remains around 1.3%.
Q3: What is the current S&P 500 level and forecast?
The S&P 500 was at 7,619.98. Yardeni Research cut its year-end target to 7,900 from 8,400, implying roughly 4% upside, citing higher Treasury yields driven by rising energy prices.
Q4: Which region offers the best equity growth in 2026?
Asia on headline growth — East Asia and Pacific at 4.2% and South Asia at 6.3% per World Bank forecasts. But a meaningful share of recent Japanese equity returns reflects yen weakness rather than earnings, and Bank of Japan normalisation erodes that tailwind.
Discover more from The Economy
Subscribe to get the latest posts sent to your email.

Silver Price Today: Why the Xi-Trump AI Standoff Is Fueling a Safe-Haven Rally

Citibank & Dólar Estadounidense: Forex Playbook After the Xi-Trump Truce

How the Trump-Xi White House Summit Is Reshaping Mortgage Rates Today for Real Estate Investors

Indonesia Navigates Mega-Project Risks as China and Russia Eye the 2,772km Trans-Kalimantan Railway

Trump-Xi 2026 Summit Takeaways: The Trade Truce, Taiwan, and the AI Divide

Solar Panel Installation Cost in 2026: Why the Math Changed Overnight

Business Insurance: What Coverage You Actually Need and What It Costs in 2026

Auto Insurance Quotes: How to Get the Lowest Rate Without Losing Coverage

Huntington Online Banking: Full Features, Fees, and How It Compares in 2026

Apply for a Bank Account Online: What You Need and How Long It Actually Takes

World’s Largest Economies: Ranking the Top Global Powers

Business Loan: A Complete 2026 Guide to Rates, Types, and Qualifying

Fast Invoice Factoring: How to Turn Unpaid Invoices Into Cash Within 24 Hours

Investment Banking Services: What They Cost and How to Choose the Right Firm in 2026

Top 30 Stocks for Investment in PSX for Massive ROI in 2026

SpaceX Starship Flight 14: First Orbital Attempt & Starlink V3 Launch Explained

Oil Prices Break $100 in 2026: Middle East Conflict & Energy Markets

BRICS+ Cross-Border Payments 2026: Interoperability Explained

AI Chip Stocks 2026: The Best Semiconductor Investments Beyond Marvell

Fidelity Investments Review 2026: SPAXX Yields & Zero-Fee Funds

Tween Back-to-School Trends 2026: What’s Driving the $85B Season

10-Year Treasury Yield Hits 4.80%: What It Means for Rates & Portfolios

Shein Clothes Quality & Safety in 2026: What Lab Tests Show

China’s US$10.8 Billion Trade Shortcut: Why the Pinglu Canal Matters

MRVL Earnings 2026: Why Marvell Sank Despite Beating Estimates

IMF & World Bank 2026 Global Economic Outlook: Growth, Inflation, Debt

Middle East War Economics 2026: Oil Prices & Energy Markets

High-CPM Finance Niches 2026: Publisher Monetization Blueprint
-

 Markets & Finance9 months ago
Top 15 Stocks for Investment in 2026 in PSX: Your Complete Guide to Pakistan’s Best Investment Opportunities
-

 Analysis7 months ago
Johor’s Investment Boom: The Hidden Costs Behind Malaysia’s Most Ambitious Economic Surge
-

 Analysis7 months ago
Top 10 Stocks for Investment in PSX for Quick Returns in 2026
-

 Banks8 months ago
Best Investments in Pakistan 2026: Top 10 Low-Price Shares and Long-Term Picks for the PSX
-

 Analysis8 months ago
Brazil’s Rare Earth Race: US, EU, and China Compete for Critical Minerals as Tensions Rise
-

 Investment9 months ago
Top 10 Mutual Fund Managers in Pakistan for Investment in 2026: A Comprehensive Guide for Optimal Returns
-

 Global Economy9 months ago
15 Most Lucrative Sectors for Investment in Pakistan: A 2025 Data-Driven Analysis
-

 Global Economy9 months ago
Pakistan’s Export Goldmine: 10 Game-Changing Markets Where Pakistani Businesses Are Winning Big in 2025