
Manufacturing
China Tape Maker Stock Debut: Crown New Materials Soared 787%

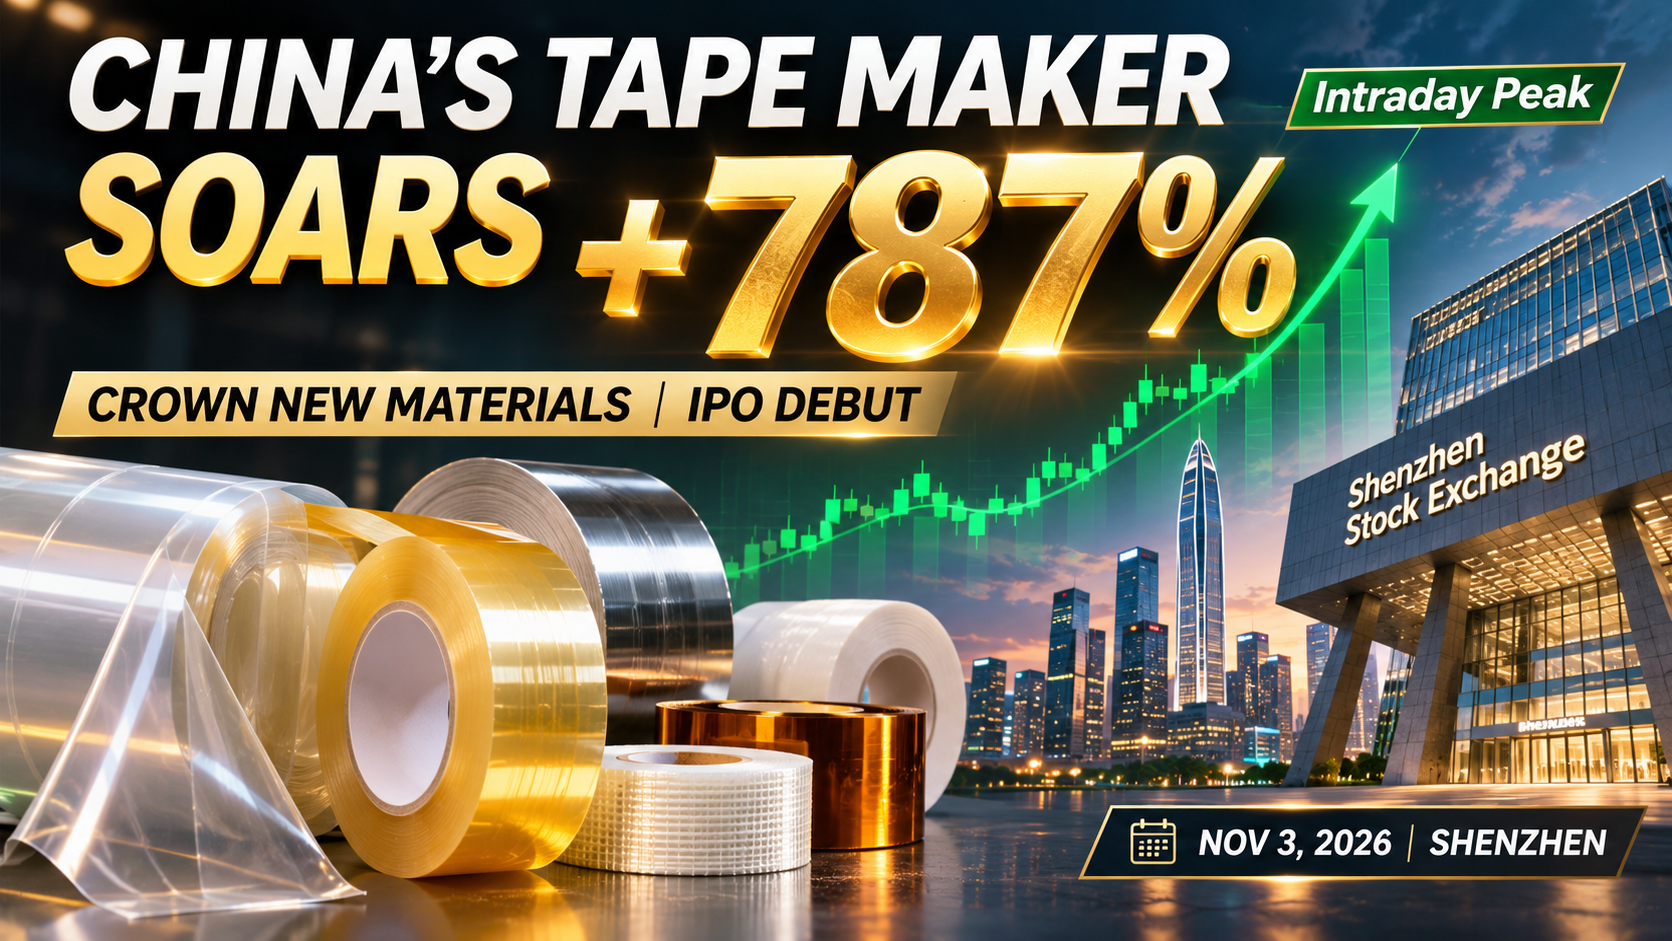
Quick answer: The Chinese tape maker attracting global attention is Crown New Materials Technology Co., Ltd., which began trading on the Shenzhen Stock Exchange on November 3, 2026, under stock code 001381. Its offering price was 16.98 yuan a share. The stock touched 150.58 yuan, approximately 787% above that price, but closed at 84.55 yuan, a gain of approximately 398% from the IPO price. The difference between the day’s high and its close is essential to understanding the story, according to the company’s official exchange listing document and November 3 trading record.
A manufacturer of industrial adhesive tape has become one of the most remarkable stock-market stories of the week. It is tempting to frame Crown’s debut entirely around the fortune created for its founders or the astonishing percentage gain. Both are newsworthy. Neither tells investors why a business built around adhesive materials can attract such intense demand—or whether a first-day valuation can survive contact with its earnings.
The more revealing story is about the difference between a company’s economic value, the limited number of shares available to trade, and the very public excitement surrounding a newly listed stock. Crown’s filings provide enough information to begin disentangling those forces, although they cannot establish exactly why individual buyers paid particular prices.
Crown New Materials IPO: The essential numbers
| Measure | Verified figure | Why it matters |
|---|---|---|
| Exchange and ticker | Shenzhen main board, 001381 | Identifies the actual listed company |
| Listing date | November 3, 2026 | The first session of trading |
| IPO offer price | 16.98 yuan | The baseline for quoted first-day returns |
| Intraday high | 150.58 yuan | Approximately 786.8% above offer price |
| First-day closing price | 84.55 yuan | Approximately 397.9% above offer price |
| Shares outstanding after issue | 468,980,000 | Basis for indicative equity valuation |
| Shares issued in IPO | 56,304,768 | New shares sold to investors |
| Shares freely tradable at listing | 44,097,241 | Just 9.40% of post-IPO share capital |
| Approximate gross IPO proceeds | 956.1 million yuan | Money raised by the new-share offering |
The share counts, listing details and pricing come from Crown’s Shenzhen Stock Exchange listing announcement. The trading high and close are corroborated by the November 3 quote record and contemporary Forbes reporting carried by Yahoo Finance.
These are first-session historical figures, not a live quote. Any article describing the stock as trading ‘today’ must retrieve a fresh, timestamped market price.
What happened on November 3?
Crown completed its public offering at 16.98 yuan and entered the Shenzhen main board with an ordinary industrial business that suddenly looked extraordinary on trading screens. At its session peak, a share cost nearly nine times the issue price. Two trading interruptions were reported amid the volatility, according to a contemporary market report.
Yet the closing price tells a second story. At 84.55 yuan, shares ended the day 66.03 yuan below the intraday peak. Someone who bought at that peak and hypothetically valued the position at the close would have faced an approximately 43.9% decline from their purchase price. That is not the same calculation as the IPO gain, and it does not describe any individual investor’s realized loss. It illustrates how one stock can simultaneously produce a spectacular headline gain and substantial short-term downside for late buyers.
Using the official post-issue total of 468.98 million shares, the closing price implies an equity market value of roughly 39.65 billion yuan. Applying the session high to all outstanding shares produces an illustrative peak valuation near 70.62 billion yuan, although very few shares may have changed hands at the highest price. Neither figure represents proceeds received by the company: Crown raised roughly 956 million yuan from the offering itself.
What kind of company is Crown?
Calling Crown a ‘tape maker’ is accurate but incomplete. Its prospectus describes a manufacturer of functional composite materials, including industrial-grade adhesive products, electronics-grade adhesives and specialized functional films. These materials are engineered to stick, shield, protect, insulate, release or otherwise perform specific roles in industrial applications.
A roll of ordinary stationery tape offers little insight into materials used to assemble delicate consumer electronics, protect optical surfaces or accommodate heat and vibration in vehicles. The value proposition in those markets depends on formulations, coating precision, manufacturing consistency and customer qualification—not simply the number of meters of tape sold.
The Guangdong-based company has described its products as reaching end-use supply chains associated with brands such as Apple, Google, Tesla and BYD. That wording needs careful treatment. A material used in the supply chain of a major brand does not automatically mean that the brand buys directly from Crown, contributes a disclosed share of Crown’s revenue, or has endorsed its investment prospects. The company discusses those end-use applications in its IPO prospectus; any stronger claim about a direct contract needs separate documentation.
From a schoolteacher to a paper billionaire
The human-interest angle has helped propel the story internationally. Forbes’ account identifies chairman and chief executive Mai Michael, also identified in the company’s Chinese filing as Mai Huiquan, as a former elementary-school teacher. It estimated his holdings at about $2.5 billion during the IPO excitement and those of his sister, vice-chairwoman Mai Huixia, at approximately $2 billion.
Those estimates describe paper wealth, calculated from shareholdings and quoted market prices. They do not mean the founders received those sums in cash. Large founder positions are typically subject to lockups, and selling a large position into a thin market could affect its price. The official listing announcement describes multiple lockup periods and a relatively small initial public float.
It is a compelling entrepreneurial story. But the investment case should not depend on its protagonist’s change of profession.
The overlooked number: Only 9.4% was freely tradable
Crown’s filing says 44,097,241 shares, or 9.40% of total post-IPO shares, were free of sale restrictions at listing. This matters because the market price is established at the margin—where the available sellers meet eager buyers—not by simultaneous trading in all 468.98 million shares.
When newly available supply is scarce, even relatively modest incremental demand can produce outsized price movements. The result can be an equity valuation that looks spectacular when multiplied across every share, despite much less money changing hands in the market. This is a plausible mechanism for IPO volatility, not definitive proof of Crown’s specific order-book dynamics.
The company explicitly warned in its listing risk disclosures about irrational speculation, concentrated tradable supply and the risks of widened price bands during the early sessions. It also said there is no guarantee its shares will remain above the issue price.
An investor comparing Crown with an established listed manufacturer therefore needs to account for both fundamental valuation and float-related volatility. A first-day close is a price discovery event, not a long-term estimate of intrinsic value.
The business was growing—but profit momentum was weaker
Here lies the most useful contrast with the headline gain. Crown reported 2025 revenue of approximately 3.408 billion yuan, compared with 3.159 billion yuan in 2024 and 2.895 billion yuan in 2023. Its attributable net profit was approximately 309.18 million yuan in 2025, compared with 302.29 million yuan and 277.54 million yuan in the preceding two years, according to its prospectus financial statements.
The more recent picture was less straightforward. For January–September 2026, revenue increased 11.75% year over year, to roughly 2.779 billion yuan, while attributable net profit fell 7.89%, to approximately 225.04 million yuan, according to the company’s pre-listing financial update. Crown attributed the margin pressure partly to higher raw-material costs and a production base that had not yet reached its intended operating scale.
The same disclosure projected 2026 full-year attributable net profit of 263.64 million–278.26 million yuan, a decline of approximately 10%–14.73% against 2025. Management cautioned that this was a preliminary estimate, not a binding earnings forecast.
A stock whose price approaches five times its issue price while projected earnings are falling is not necessarily overvalued: investors may expect future expansion, stronger product mix or recovering margins. But it certainly requires more explanation than the phrase ‘strong growth’.
What the first-day valuation implies
At the 84.55-yuan close, Crown’s approximately 39.65-billion-yuan market capitalization divided by its 2025 attributable profit of 309.18 million yuan produces a rough trailing price-to-earnings multiple of 128 times. This simple calculation is not a substitute for fully adjusted financial analysis, but it establishes the magnitude of expectations embedded in the price.
At 16.98 yuan, the same method suggests roughly 25.8 times 2025 profit—close to the 25.87-times issue multiple disclosed in the listing documentation, which uses a specified adjusted earnings basis. The differences in definitions and rounding explain why calculated figures need not match exactly.
The point is not that a high multiple guarantees a crash. It is that long-term returns at that valuation depend heavily on whether Crown can convert new capacity, customer qualifications and research spending into significantly higher sustainable earnings.
Why the adhesive-materials opportunity is real
Functional adhesives occupy an easily overlooked position in technology and industrial supply chains. Electronics need materials for assembly, protection, sealing and thermal management; advanced batteries and electric vehicles impose demanding requirements around durability, heat, vibration and safety. Specialized films can carry different margins, know-how requirements and qualification processes from commodity tape.
Crown plans to invest IPO funds in functional-material capacity, semiconductor-related materials, optical films and a research center. Its IPO project plan lists approximately 918.68 million yuan of intended funding uses across the projects and working capital.
But opportunity and revenue are different categories. New facilities can take time to ramp up, and advanced-materials products must meet demanding technical specifications before customer orders scale. Investors need to assess qualification delays, production yields, competitive pricing and capital spending—not just the relevance of a product to artificial intelligence, electric vehicles or smartphones.
Three risks that deserve more attention
Raw materials. Crown disclosed that direct materials represented roughly 80% of its main operating costs across the reporting periods. Resins, solvents and other petrochemical inputs expose it to energy-market volatility. The company estimated that a 5%–10% raw-material cost increase, under the modeled conditions, could materially reduce gross margin. The assumptions and risk language appear in the listing document.
Competition. Industrial adhesives are not a monopoly. Crown itself identifies major international players including 3M, Nitto and tesa, alongside Chinese manufacturers, in its prospectus. Winning a customer program does not guarantee pricing power indefinitely.
Market structure. A small free float, lockups and early-session volatility can exaggerate price swings. A high share price may also make future disappointing earnings more painful because investors have already priced in exceptional success.
What to watch after the debut
The next useful data will be operating results and disclosures, not another viral percentage. Investors should monitor the company’s official disclosure page for updated earnings, shareholding notices, capacity milestones, customer concentration details and risks. They should compare gross margins across reporting periods, verify actual product-mix changes and distinguish scheduled lockup expirations from real share sales.
For coverage of Chinese IPOs generally, it is also important to separate exchange-regulator decisions, media reports about listing-policy changes and company-specific performance. A report about the wider IPO pipeline does not establish that Crown’s listing was exceptional because of a particular new policy.
Frequently asked questions
Which Chinese tape maker surged in its stock debut? Crown New Materials Technology, listed on Shenzhen’s main board under code 001381 on November 3, 2026.
Did its shares finish up 787%? No. The approximately 787% figure refers to the intraday peak relative to the IPO price. Shares ended their first session approximately 398% above the offering price.
How much did Crown raise? Roughly 956 million yuan gross through the sale of 56.3 million newly issued shares priced at 16.98 yuan each, before offering expenses.
Does Crown sell directly to Apple and Tesla? Its prospectus identifies end-use applications associated with major brands. That statement alone does not establish direct purchasing relationships or revenue concentration.
Is Crown a good investment after its IPO? The first-day performance cannot answer that question. Price, earnings quality, future margins, customer concentration, trading liquidity and individual risk tolerance all matter.
Why did its founders become billionaires? Media wealth estimates used their equity stakes and the newly quoted stock price. Such gains are unrealized and subject to market movements and share-sale restrictions.
Crown’s debut reveals two different phenomena: an industrial-materials company with a genuine technology-supply-chain business, and an IPO market capable of valuing a relatively small free float at startling prices. The 787% intraday gain made the headline. The 398% closing gain, 9.4% free float and weakening near-term profit outlook provide the better starting point for investors trying to understand it.
Discover more from The Economy
Subscribe to get the latest posts sent to your email.



China’s maritime manufacturing ecosystem has reached a historic apex. According to official industry metrics compiled by the Ministry of Industry and Information Technology (MIIT), Chinese shipbuilders secured 81.8% of all global new shipbuilding orders measured by deadweight tonnage (DWT) during the January–September period.
This milestone reflects an unprecedented consolidation of global commercial sea power. Concurrently, China’s yards completed 58.05 million DWT in ship construction—a 50.7% year-on-year surge—capturing 63.6% of global vessel deliveries. The nation’s cumulative order backlog expanded to 399.13 million DWT (+64.8% YoY), representing 72.4% of all global backlogged tonnage.
                     GLOBAL SHIPBUILDING MARKET SHARE
                   ┌───────────────────────────────────┐
  New Ship Orders  │ [China: 81.8%]           [Rest: 18.2%] │
                   ├───────────────────────────────────┤
  Completed Tonnage│ [China: 63.6%]         [Rest: 36.4%]   │
                   ├───────────────────────────────────┤
  Order Backlog    │ [China: 72.4%]       [Rest: 27.6%]     │
                   └───────────────────────────────────┘
1. Structural Catalysts Behind China’s Market Monopoly
China’s dominance is built on structural advantages that competitors in East Asia and the West struggle to replicate.
┌─────────────────────────────────────────────────────────────────────────┐
│                      CHINA'S SHIPBUILDING FLYWHEEL                      │
│                                                                         │
│  [ Upstream Raw Materials ]  ──►  [ Integrated Shipyard Infrastructure ] │
│  (Domestic Steel & Components)   (State-backed Mega-docks & Digitalization) │
│               ▲                                        │                │
│               │                                        ▼                │
│  [ Scale & Backlog Expansion ] ◄──  [ Global Fleet Order Dominance ]    │
│    (399M DWT Reserve Capacity)    (Container, LNG & Dual-Fuel Vessels) │
└─────────────────────────────────────────────────────────────────────────┘
Integrated Domestic Supply Chains & Raw Material Synergies
Unlike European or American yards that rely on fragmented international supply chains, Chinese shipbuilders benefit from a fully domestic industrial ecosystem. China’s domestic steel industry produces marine-grade steel plate at scale, minimizing lead times and protecting yards from global freight rate swings.
Mega-Yard Scale and Modular Fabrication
State-backed groups like China State Shipbuilding Corporation (CSSC) operate mega-shipyards equipped with gantry cranes capable of lifting thousands of tons. Advanced modular block construction techniques allow yards in Jiangsu, Shanghai, and Shandong to build multiple ultra-large vessels simultaneously.
2. Moving Up the Value Chain: Beyond Bulk Carriers
Historically, Chinese yards dominated low-margin dry bulk carriers and basic oil tankers. Today, the industry has shifted toward high-technology, eco-friendly ships.
| Vessel Category | Primary Yards / Locations | Strategic Market Focus | Key Structural Drivers |
| LNG & Dual-Fuel Carriers | Jiangnan Shipyard, Hudong-Zhonghua | Clean energy transit, green corridors | High-tech membrane containment tanks |
| Ultra-Large Container Ships (ULCS) | Yangzijiang Shipbuilding, Waigaoqiao | Global liner network efficiency | Scale efficiencies, dual-fuel propulsion engines |
| Pure Car and Truck Carriers (PCTC) | Merchants Heavy Industry, Jinling | Automotive export expansion | Surge in Chinese electric vehicle (EV) exports |
Analysis published by maritime market intelligence groups at BIMCO demonstrates that green dual-fuel vessel contracting now accounts for a record percentage of global orderbooks. Chinese yards have secured key contracts in LNG, methanol, and ammonia-ready ship classes, breaking the historic Korean monopoly on complex gas carriers.
3. Global Geopolitical Implications and Trade Friction
China’s rapid consolidation of commercial shipbuilding capacity has created geopolitical friction across the Western hemisphere.
  ┌─────────────────────────────────────────────────────────────────┐
  │                    GLOBAL TRADE & POLICY TENSIONS               │
  ├─────────────────────────────────┬───────────────────────────────┤
  │ US Trade & Regulatory Policy    │ European Maritime Response    │
  ├─────────────────────────────────┼───────────────────────────────┤
  │ • Section 301 Maritime Enquiries│ • Net-Zero Industry Act Targets│
  │ • Proposed Chinese Port Fees    │ • Subsidized Green Retrofits  │
  │ • Naval Fleet Capacity Audits   │ • Supply-Chain Security Mandates│
  └─────────────────────────────────┴───────────────────────────────┘
U.S. Regulatory Countermeasures and Section 301 Actions
The U.S. Trade Representative (USTR) and maritime regulatory bodies have scrutinized Chinese state support in the shipbuilding sector. Proposed measures—including port fees on Chinese-built vessels calling at American ports—aim to offset perceived cost advantages. However, industry analysts note these fees could raise consumer import costs given the lack of domestic US commercial alternatives.
Divergence in Allied Shipbuilding Capabilities
While China maintains a commercial backlog of nearly 400 million DWT, Western shipyards handle less than 2% of international commercial tonnage. Regional players in Japan and South Korea continue to specialize in niche high-value designs, but face capacity constraints, aging labor forces, and higher structural overhead compared to Chinese shipbuilders.
Strategic Outlook (2026–2030)
China’s dominance in commercial shipbuilding provides a foundation for long-term maritime industrial capacity. Backlog deliveries extending into 2028 and 2029 ensure high yard utilization rates even if global order velocity cools. As international decarbonization standards tighten under IMO mandates, China’s capacity to construct next-generation green vessels position it to maintain control of the world’s commercial fleet production.
Discover more from The Economy
Subscribe to get the latest posts sent to your email.
China Economy
China’s Economy Has a Structural Problem: Factories Are Winning, Households Are Losing
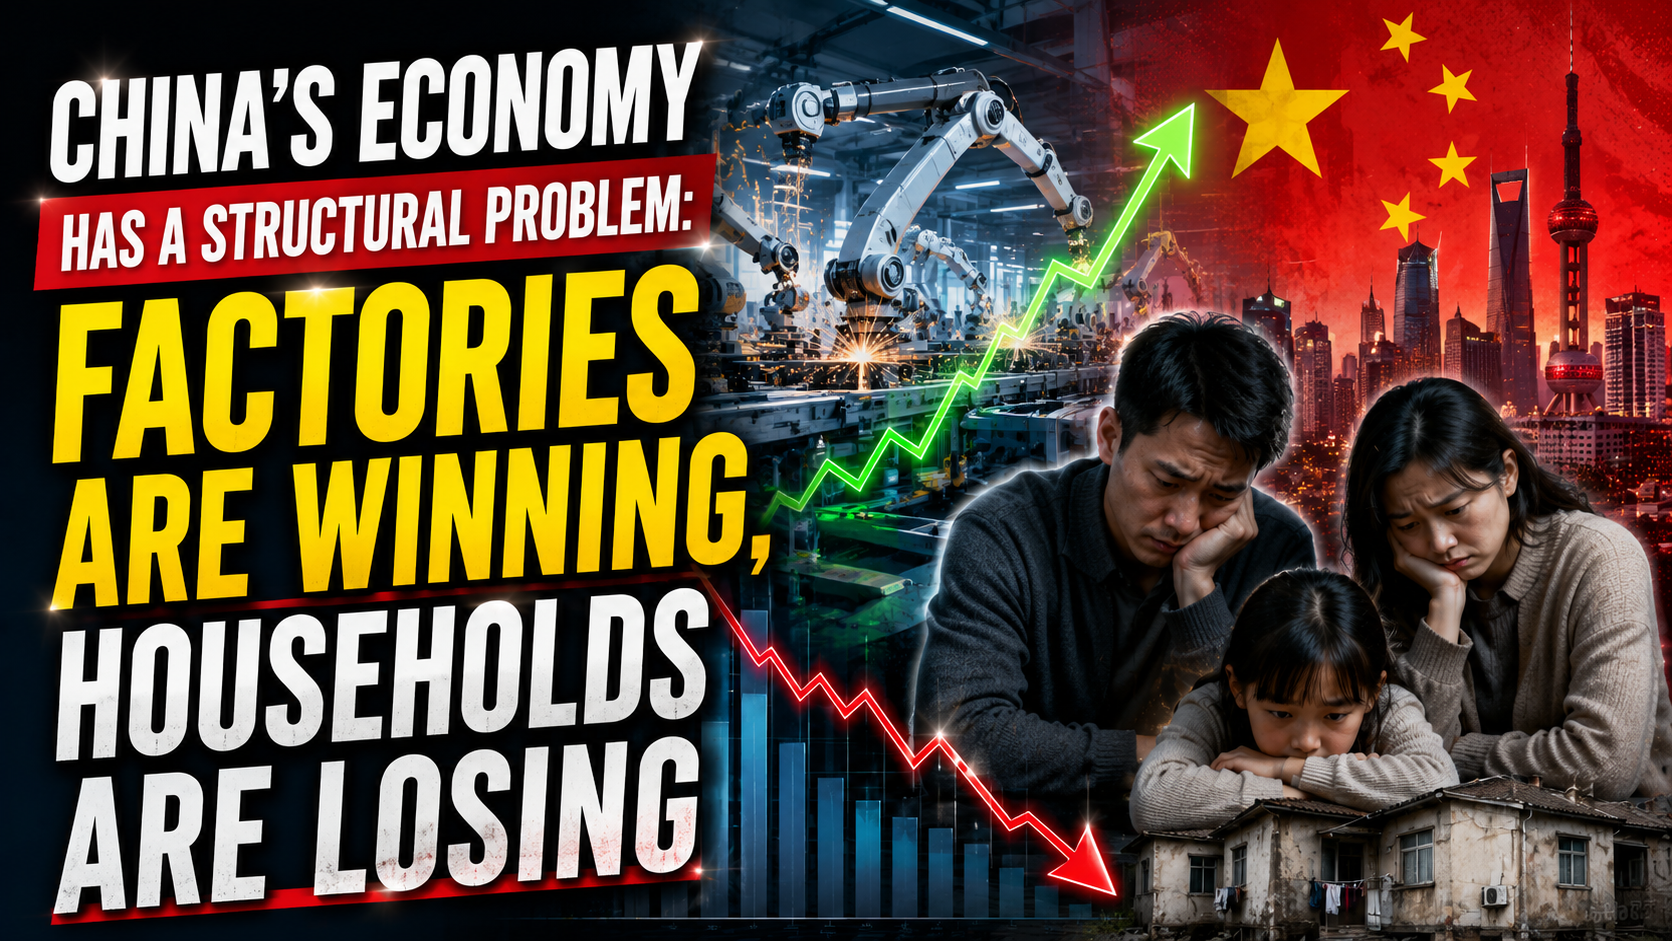
China’s headline growth numbers still look respectable at first glance. GDP expanded 4.3% year-on-year in the June quarter, down from 5.0% in the first quarter, bringing first-half growth to 4.7% (GoMarkets). But the composition beneath that headline is where the real story sits — and it points to a widening structural imbalance rather than a routine slowdown.
The production-consumption gap, in numbers
Industrial output rose 5.4% across the first half of 2026, anchored by a 5.3% annual gain in June concentrated in manufacturing and high-tech sectors (GoMarkets). Consumer activity, by contrast, remained deeply subdued: retail sales grew just 1.0% year-on-year in June and only 1.3% over the full six-month period (GoMarkets). That is roughly a four-to-one gap between how fast China is producing and how fast its own citizens are spending — a divergence with few precedents in the country’s post-2000 growth history.
Property remains the drag beneath the drag
Capital allocation data confirms the imbalance runs deeper than a temporary consumer pullback. Fixed-asset investment fell 5.7% across the first half of 2026, real estate development investment dropped a sharp 18.0%, and housing starts contracted alongside falling property sales (GoMarkets). For an economy in which real estate has historically been a primary household wealth store, an 18% investment contraction in the sector helps explain why consumer confidence — and therefore retail spending — has not recovered in line with industrial output.
Why manufacturing strength isn’t translating to household income
The pattern suggests China’s growth model is increasingly supply-driven rather than demand-driven: factories and high-tech manufacturing continue to expand production, largely for export markets, while the domestic income and confidence channels that would normally translate industrial strength into consumer spending remain broken. This is precisely the imbalance Beijing’s policymakers have spent years pledging to correct through “dual circulation” and consumption-boosting initiatives, with limited visible success by mid-2026.
The regional and global read-through
China’s uneven recovery profile is now one of three defining Asia-Pacific storylines for August 2026, alongside the Bank of Japan’s monetary normalisation and the Reserve Bank of Australia’s rate decision — and these narratives are increasingly intersecting rather than running independently, given how China’s demand weakness affects commodity exporters and regional supply chains alike (GoMarkets). China’s continued dominance within BRICS, and its willingness to use the platform to advance national economic interests, adds a geopolitical dimension to what is fundamentally a domestic demand problem (Inquirer).
What would actually close the gap
Closing a four-to-one production-to-consumption gap requires more than incremental stimulus — it requires either a sustained property-sector stabilisation that restores household wealth confidence, or a direct transfer-based approach to boosting disposable income that bypasses the property channel altogether. Absent one of those two shifts, China’s 2026 growth figures will likely keep looking healthier in aggregate than they feel to the households generating the underlying production.
Discover more from The Economy
Subscribe to get the latest posts sent to your email.

China Tape Maker Stock Debut: Crown New Materials Soared 787%

Apple’s Earnings Beat Had a Catch: Look Past the Tariff Refund

Social Security Payments in November 2026: The Full Calendar and Two Important Changes

Johor–Singapore SEZ’s $21.8 Billion Bet: The Hard Part Starts Now

China’s 175 Trillion AI Tokens Reveal a Bigger Shift: The AI Boom

The Philippines’ Stagflation Trap: Higher Interest Rates

Alphabet’s $500 Billion Reckoning: Wall Street Is Losing Patience With the AI Boom

4 Reasons Why China’s Trade Concessions to Europe Will Not Solve the Crisis

The AI Revolution Needs Atomic Power. Southeast Asia Is Ready to Build It.

Zhuhai Airshow 2026: How China’s Stealth Jets, Drones and Missiles Are Redrawing Global Air Power

The $8 Billion Runway: China’s Strategic Bet on Guangzhou and the Future of Aviation

The Sandbox Imperium: Why Beijing’s Digital Yuan Needs Hong Kong

Gold at the $4,000 Line: Possible December Fed Hike

Oil at $100+: Hormuz, a Qatari Peace Draft and the Iran Deadline

Crude Oil & Petroleum Market Analysis: OPEC+ Decisions and Price Forecasts

Top US Convenience Store Chains: Store Counts, EV Charging, and Sales Trends

Social Security Extra $90 Deposit: Who Qualifies for the October 2026 Medicare Rebate?

Gold Price Outlook 2026: The Forces Behind the Forecasts—and What Could Reverse Them

Algorithmic Dogfights: Why the U.S. and China Must Establish Rules of Engagement for Autonomous Air Power

Corporate America Faces a New Debt Test as US Borrowing Costs Surge

Global Economic Outlook 2026: 7 Forces Reshaping Markets, Trade and Business

Stock Market Crash in 2026? Warning Signs, Scenarios and a Calm Investor Checklist

US–Iran Conflict in October 2026: Hormuz, Oil Prices and Diplomacy

Stock Market Today: Dow, S&P 500, and Nasdaq Retreat as Treasury Yields

Anthropic Bans Sustained Abuse of Claude AI Under New Usage Policy Effective November 12, 2026

Geopolitics and Your Portfolio: How International Affairs Move Global Markets

Why Did I Get $90 From Social Security? 8 Reasons Behind an Unexpected SSA Payment

US–China Critical Minerals Competition: Why a Trade Deal Cannot Fix Every Supply Risk
-

 Markets & Finance10 months ago
Top 15 Stocks for Investment in 2026 in PSX: Your Complete Guide to Pakistan’s Best Investment Opportunities
-

 Analysis8 months ago
Johor’s Investment Boom: The Hidden Costs Behind Malaysia’s Most Ambitious Economic Surge
-

 Analysis9 months ago
Top 10 Stocks for Investment in PSX for Quick Returns in 2026
-

 Banks10 months ago
Best Investments in Pakistan 2026: Top 10 Low-Price Shares and Long-Term Picks for the PSX
-

 Analysis9 months ago
Brazil’s Rare Earth Race: US, EU, and China Compete for Critical Minerals as Tensions Rise
-

 Investment10 months ago
Top 10 Mutual Fund Managers in Pakistan for Investment in 2026: A Comprehensive Guide for Optimal Returns
-

 Global Economy10 months ago
15 Most Lucrative Sectors for Investment in Pakistan: A 2025 Data-Driven Analysis
-

 Global Economy10 months ago
Pakistan’s Export Goldmine: 10 Game-Changing Markets Where Pakistani Businesses Are Winning Big in 2025