
Asia
Asian Economic Order: Who Will Lead in 2026?


Introduction: The $50 Trillion Question
In early 2025, Apple shifted 14% of its iPhone production from China to India. Samsung announced a $20 billion semiconductor facility in Vietnam. Japanese automakers accelerated partnerships with Indonesian battery manufacturers. These aren’t isolated decisions—they’re symptoms of a tectonic shift reshaping the world’s most dynamic economic region.
Asia’s collective GDP now exceeds $50 trillion, representing over 60% of global growth. But as we approach 2026, a critical question looms: who will lead this economic powerhouse? Will China retain its crown despite structural headwinds? Can India’s demographic and digital revolution propel it to the forefront? Might ASEAN’s collective strength eclipse individual giants? Or will Japan and South Korea’s technological dominance redefine what leadership means?
The answer matters far beyond Asia. Supply chains, climate policy, technological standards, and geopolitical alliances all hinge on how this economic order evolves. Unlike previous decades defined by China’s singular rise, 2026 presents something more complex: a multipolar Asia where power is distributed, contested, and constantly negotiated.
Historical Context: From China’s Century to Multipolar Competition
To understand where Asia is heading, we must grasp how it arrived here. China’s transformation since the 1990s was unprecedented—300 million lifted from poverty, a manufacturing ecosystem unmatched globally, and GDP growth averaging 10% for three decades. Its 2001 WTO accession wasn’t just economic integration; it was a reshaping of global capitalism itself.
But China’s dominance obscured other transformations. India’s 1991 liberalization planted seeds that sprouted slowly, then explosively after 2014 when the Modi government launched initiatives like Digital India, Make in India, and GST tax reform. These weren’t just policy programs—they represented India’s bet on a services-and-digital-first economy fundamentally different from China’s manufacturing model.
Meanwhile, ASEAN pursued a quieter but equally significant path. From Thailand’s automotive hub to Vietnam’s electronics boom to Indonesia’s resource wealth, the ten-nation bloc integrated into a $3.6 trillion economy with 650 million consumers. The 2020 Regional Comprehensive Economic Partnership (RCEP) formalized what was already occurring: ASEAN had become the strategic center of Asian trade, partnering with everyone while dominated by none.
Japan and South Korea, facing demographic decline, made a different wager—betting on technological intensity over scale. Japan’s robotics, green technology, and advanced materials; South Korea’s semiconductors, batteries, and consumer electronics. Both proved that innovation could sustain relevance even as populations aged and domestic markets stagnated.
By 2026, these divergent strategies are colliding, creating a genuinely multipolar Asia for the first time in modern history.
Current Landscape: The Data Behind the Divergence
The numbers tell a striking story. According to Asian Development Bank projections, developing Asia will grow at 4.7% in 2026—three times the projected global average. But this aggregate masks radical divergence.
India leads with forecasted growth around 7%, driven by a $500 billion digital economy (doubled from 2023), 25 million annual additions to the workforce, and manufacturing output growing at 10% annually. The IMF projects India will contribute 18% of global growth in 2026, second only to China despite having one-fifth its GDP.
China’s story is more complicated. Growth projections hover around 4.6%—historically low but still representing $800 billion in absolute terms, more than most countries’ entire economies. Yet beneath aggregate figures lie structural concerns: property sector losses exceeding $1 trillion, local government debt at 120% of GDP, and a shrinking working-age population. China’s pivot toward electric vehicles, AI, and advanced semiconductors shows ambition, but geopolitical headwinds—US tariffs, supply chain diversification, technology restrictions—threaten this transition.
ASEAN’s six largest economies (Indonesia, Thailand, Singapore, Malaysia, Vietnam, Philippines) project collective growth around 5%. Vietnam’s manufacturing exports are growing at 15% annually, having captured production Apple, Samsung, and Nike shifted from China. Indonesia, with its nickel dominance, sits at the center of the global battery supply chain. The Philippines’ business process outsourcing sector rivals India’s in scale.
Japan’s 1-1.5% growth reflects demographic reality—a shrinking population means growth comes only from productivity gains. Yet Japan’s $60 billion green technology exports and dominance in industrial robotics show how quality compensates for quantity. South Korea’s 2.5-3% projection depends heavily on semiconductor demand, particularly from AI applications where its chip manufacturers hold 70% global market share.
These aren’t just numbers—they represent fundamentally different economic models competing for regional leadership.
The Manufacturing Race: Vietnam’s Rise and China’s Retention
Walk through Hanoi’s industrial parks and the transformation is visceral. Where rice paddies stood a decade ago, Samsung now produces 50% of its smartphones. Intel, Apple, and LG have followed. Vietnam’s manufacturing exports grew from $100 billion in 2015 to over $350 billion in 2024, with projections hitting $450 billion by 2026.
But China isn’t ceding manufacturing dominance easily. While labor-intensive assembly moves to Southeast Asia, China is climbing the value chain. It now produces 60% of the world’s electric vehicles, dominates battery production, and leads in industrial robots. The difference? Vietnam assembles iPhones; China increasingly designs and builds the machines that make them.
India presents a third model—selective manufacturing depth in pharmaceuticals (60% of global generic drugs), automotive components, and increasingly, electronics. Foxconn’s $1.6 billion investment in Indian iPhone production and Tesla’s planned Gigafactory signal India’s manufacturing ambitions. Yet infrastructure gaps remain stark. While China moves containers port-to-factory in 24 hours, India averages 3-5 days. Vietnam’s logistics efficiency sits between them.
The question isn’t whether manufacturing leaves China entirely—it won’t. It’s whether China can transition fast enough to higher-value production while Vietnam, India, and others capture what it leaves behind.
The Digital Economy Battle: India’s Unexpected Lead
If manufacturing defines China’s past, digital services may define India’s future. India’s Unified Payments Interface processed 13 billion transactions monthly in 2024—ten times more than any other real-time payment system globally. This infrastructure spawned a fintech ecosystem valued at over $150 billion, with companies like PhonePe, Paytm, and Razorpay processing more digital transactions than the entire European Union.
But it’s not just payments. India’s software services exports exceed $200 billion annually, while China’s lag at $30 billion despite five times India’s GDP. Why? India’s English proficiency, time zone advantage with Western markets, and democratic legal framework make it the natural hub for global digital services.
China’s digital strength lies elsewhere—in consumer platforms like WeChat and Douyin (TikTok), in AI applications deployed at massive scale, and in manufacturing digitization. China’s industrial internet market is projected at $240 billion by 2026, as factories integrate AI, IoT, and automation. These are fundamentally different digital economies: India services the world’s code; China digitizes production itself.
ASEAN countries are carving niches—Singapore as Asia’s fintech hub, Indonesia with its super-apps like Gojek and Grab, and the Philippines in business process outsourcing. By 2026, Southeast Asia’s digital economy is projected at $330 billion, smaller than India’s or China’s individually but growing faster than both.
Demographic Destinies: The Age Divide
Demographics may be destiny, and here the divergence is starkest. India adds 25 million working-age adults annually through 2030. China loses 5 million. By 2026, India’s median age will be 28; China’s 39; Japan’s 49; South Korea’s 45. ASEAN sits at 31—younger than China, older than India.
These aren’t just statistics—they’re economic trajectories. India’s demographic dividend means rising consumption, growing labor supply, and expanding tax bases. The Economist projects India will add 140 million middle-class consumers by 2030, creating a consumer market rivaling Europe’s.
China faces the opposite: a shrinking workforce, rising pension costs, and declining domestic consumption growth. Its response? Automation, AI, and productivity gains to offset labor decline. China installed 290,000 industrial robots in 2023—more than the rest of the world combined. Japan and South Korea follow similar paths, using technology to compensate for demographic decline.
ASEAN’s demographic advantage is more nuanced. Vietnam, the Philippines, and Indonesia have youthful populations; Thailand and Singapore face aging similar to Northeast Asia. This heterogeneity means ASEAN’s demographic dividend is real but unevenly distributed.
The question: can China’s technological intensity overcome demographic decline? Can India translate demographic advantage into productivity before its window closes? History suggests demographic dividends aren’t automatic—they require employment, education, and infrastructure that India must still prove it can deliver at scale.
Geopolitical Positioning: The New Great Game
Economics and geopolitics are inseparable in 2026’s Asia. The US-China rivalry isn’t just tariffs—it’s technology decoupling, military positioning, and alliance building. Each Asian economy must navigate this carefully.
India’s choice is increasingly clear. Quad membership with the US, Japan, and Australia; defense cooperation deepening; and positioning as a democratic alternative to China. The US-India Initiative on Critical and Emerging Technology (iCET) channels semiconductor investment and defense tech collaboration. India isn’t just diversifying from China—it’s explicitly positioning against it.
ASEAN takes the opposite approach: strategic ambiguity. Vietnam maintains security ties with Russia while deepening economic links with the US. Singapore hosts US naval facilities while serving as a financial gateway to China. This flexibility is ASEAN’s strength—playing major powers against each other while maintaining autonomy.
Japan and South Korea face unique pressures. Japan’s alliance with the US is bedrock, yet China remains its largest trading partner. South Korea’s semiconductor exports to China exceed $100 billion annually, even as it hosts US troops and participates in regional security frameworks. Both navigate between economic pragmatism and security alliances.
China counters with the Belt and Road Initiative, now investing over $1 trillion across 150 countries, and RCEP, which integrates Asian trade without US participation. Its Asian Infrastructure Investment Bank offers development finance rivaling Western institutions.
By 2026, these geopolitical positions will increasingly determine economic outcomes. Will US technology restrictions on China accelerate innovation—or stifle it? Will India’s democratic alignment attract investment—or its policy unpredictability deter it? Can ASEAN maintain neutrality—or will pressure force alignment?
Future Scenarios: Four Paths to 2026
Scenario 1: India’s Decade Begins India sustains 7%+ growth, infrastructure bottlenecks ease, and manufacturing competitiveness improves. Western firms accelerate China diversification, making India the primary beneficiary. Digital services expand globally, and demographic dividends translate into mass consumption. By 2026, India is unambiguously Asia’s growth leader, though still smaller than China in absolute terms.
Probability: 40%. Requires sustained reform momentum and geopolitical alignment.
Scenario 2: China’s Successful Pivot China manages its property crisis, technology investments in EVs and AI pay off, and it successfully moves up the value chain. Domestically, automation offsets demographic decline. Internationally, Belt and Road deepens influence while RCEP integrates Asian trade under Chinese leadership. Growth stabilizes at 4-5%, but quality improves and geopolitical influence grows.
Probability: 30%. Requires navigating debt, demographics, and US containment simultaneously.
Scenario 3: ASEAN’s Collective Rise ASEAN integration accelerates, infrastructure improves, and the bloc captures manufacturing leaving China while expanding its consumer market. Vietnam, Indonesia, and the Philippines become individually significant economies. RCEP deepens, making ASEAN the strategic center of Asian trade. No single ASEAN nation dominates, but collectively they rival China and India’s influence.
Probability: 20%. Requires political cohesion that has historically eluded ASEAN.
Scenario 4: Fragmented Multipolarism No single actor dominates. India grows fast but infrastructure constrains potential. China manages decline but doesn’t thrive. ASEAN remains fragmented. US-China rivalry deepens, fragmenting supply chains and slowing regional integration. Technology decoupling creates parallel ecosystems. Asia grows but below potential, and leadership remains contested.
Probability: 10%. The pessimistic scenario, but not implausible if geopolitics intensifies.
Most likely? A combination—India leading growth rates, China retaining scale and technology strength, ASEAN rising collectively, and Japan-South Korea sustaining through innovation. Truly multipolar, with leadership context-dependent.
Critical Uncertainties: What to Watch
Several variables will determine which scenario unfolds:
Capital Flows: Will foreign direct investment continue shifting to India and Southeast Asia, or will China’s technology and scale retain capital? Watch quarterly FDI figures and corporate investment announcements.
Technology Decoupling: How far will US-China technology separation go? Complete decoupling fragments Asian supply chains; partial separation might strengthen regional integration.
Infrastructure Delivery: Can India and ASEAN deliver roads, ports, and power grid improvements? Infrastructure investment-to-GDP ratios are leading indicators—India at 5%, China historically at 8%, ASEAN averaging 4%.
Domestic Consumption: Will China’s consumers return, or has the property crisis permanently damaged confidence? Watch retail sales growth and consumer sentiment indices.
Climate Shocks: ASEAN’s coastal economies face existential climate risks. Severe weather events could derail growth trajectories faster than any economic policy.
Geopolitical Flashpoints: Taiwan, South China Sea, and North Korea remain potential crisis points that could instantly reorder economic priorities.
These aren’t theoretical—each represents actionable intelligence for investors, policymakers, and businesses positioning for 2026.
Implications: What This Means for Business and Policy
For multinational corporations, the message is diversification without simplification. The “China Plus One” strategy is table stakes; the question is whether it’s “China Plus India,” “China Plus ASEAN,” or “China Plus Several.” Companies must maintain China presence for scale and technology while building alternatives for resilience.
For investors, a multipolar Asia means sector-specific strategies. Technology? Focus on South Korea and Taiwan. Digital services? India leads. Manufacturing? Vietnam and Indonesia are rising. Consumer growth? India and ASEAN offer the largest opportunities. One-size-fits-all Asia strategies no longer work.
For policymakers, particularly in the West, the question is whether to support multipolarity or attempt to create a single alternative to China. The former is more realistic; the latter risks overextending commitments and underestimating China’s resilience.
For Asian nations themselves, multipolarity creates opportunity. Smaller economies can leverage great power competition for investment, technology transfer, and market access. But it also creates risk—misjudging geopolitical alignment could mean economic isolation.
Conclusion: Preparing for Multipolar Asia
The Asian economic order of 2026 defies simple narratives. It’s not “the rise of China” or “the rise of India”—it’s the simultaneous rise, recalibration, and repositioning of multiple powers, each leveraging different strengths in an interconnected but increasingly fragmented global system.
India emerges as the growth leader, powered by demographics, digital infrastructure, and geopolitical alignment with the West. China recalibrates, slowing but climbing the value chain, retaining scale and technological depth that ensure continued influence. ASEAN rises as a collective bloc, capturing manufacturing shifts and expanding consumer markets without individual dominance. Japan and South Korea sustain relevance through technological intensity, compensating for demographic decline with innovation.
This multipolarity is both opportunity and challenge. It creates redundancy in supply chains, competition in innovation, and choice in partnerships. But it also creates complexity in navigation, risk in fragmentation, and potential for conflict if geopolitical tensions escalate.
The world must prepare not for one Asian leader, but for an Asia of distributed power—dynamic, diverse, and decisive. Those who understand this complexity will thrive; those expecting simplicity will be consistently surprised.
The question isn’t who will lead Asia in 2026. It’s how multipolarity will reshape what leadership means—and whether the world is ready for an Asia that defies singular narratives.
Key Takeaway: Watch India’s infrastructure delivery, China’s technology pivot, ASEAN’s integration progress, and geopolitical positioning closely. These will determine not just who leads, but what kind of Asian order emerges. The multipolar Asia of 2026 is already taking shape—the question is whether global institutions, businesses, and policies can adapt quickly enough to navigate it.
Discover more from The Economy
Subscribe to get the latest posts sent to your email.


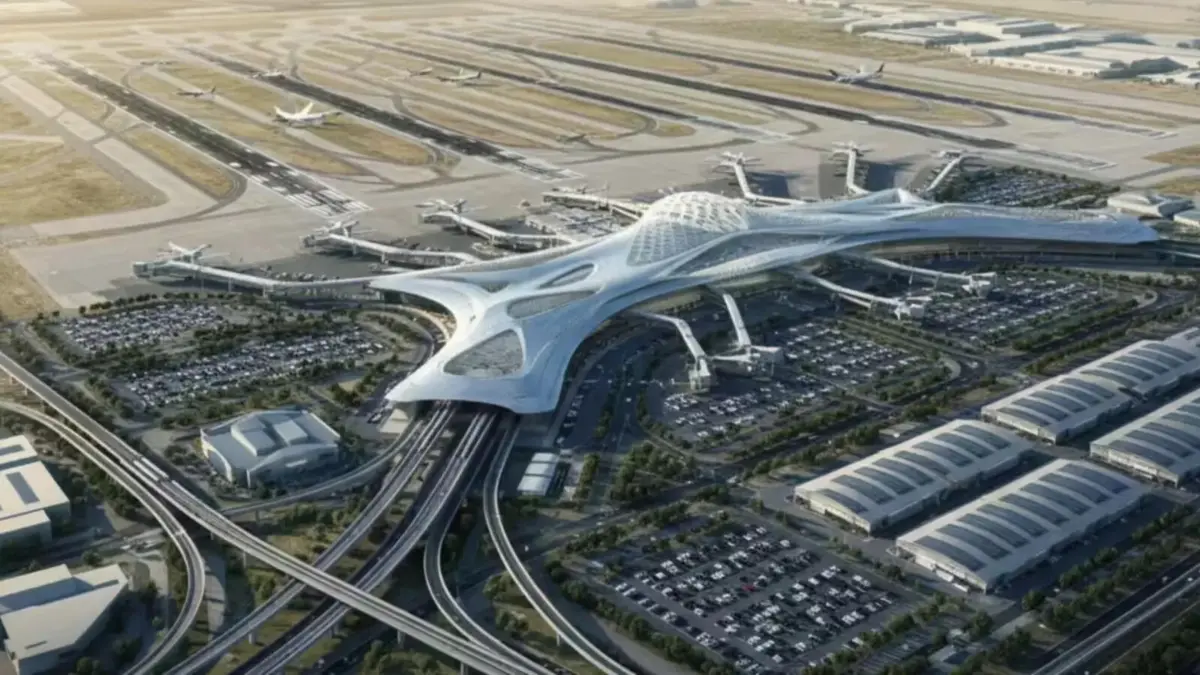
Dubai is in the middle of building what is intended to become the world’s largest airport by capacity — a Dh128 billion ($34.8 billion) expansion of Al Maktoum International Airport at Dubai World Central (DWC), according to Gulf News. When complete, the facility will feature five parallel runways, roughly 400 gates, and the capacity to handle up to 260 million passengers a year — nearly three times the current capacity of Dubai International Airport (DXB), already the world’s second-busiest airport for international traffic, per analysis from K Estates.
Where the project actually stands in 2026
Construction crews have already excavated more than 45 million cubic metres of earth and completed the airport’s second runway, according to MyBayut’s DWC guide. The first phase — a central passenger terminal and four concourses designed to handle 150 million passengers annually — is targeted for completion around 2032, per Khaleej Times. Dubai is set to allocate AED 55 billion worth of expansion contracts by the end of 2026 alone, underscoring the pace at which the project is being financed and built.
The scale of ambition extends beyond aviation infrastructure. DWC is being planned as a self-contained “airport city,” incorporating business, cultural, and residential districts across Dubai South, roughly 35 kilometres from Dubai Marina, according to the same Khaleej Times reporting. All operations currently based at DXB — including Emirates’ long-haul network — are expected to eventually transfer to the new hub.
Part of a much bigger regional aviation build-out
Al Maktoum’s expansion is the largest single project within a broader regional wave of investment: airports across the Middle East, Africa, and South Asia are expected to spend a combined $183 billion on capacity, connectivity, and passenger-experience upgrades, with the UAE and Saudi Arabia leading the push, according to Gulf News. Within the UAE alone, expansion plans extend beyond Dubai to Sharjah and Ras Al Khaimah, with a shared emphasis on AI-enabled operations, IoT systems, and energy-efficient terminal design.
What it means for the region’s real estate and travel markets
The airport build-out is already reshaping property markets nearby. Transactions in Dubai South exceeded AED 15 billion ($4.1 billion) in just the first five months of 2025 — nearly matching the entire AED 16.1 billion recorded across all of 2024 — with analysts forecasting further price appreciation as the airport nears completion, according to K Estates. For travellers and airlines, the eventual payoff is a dramatic increase in regional connectivity capacity at a time when global air travel demand — and airfares — have both been climbing steadily through 2026.
Key takeaways
- Al Maktoum International Airport’s expansion carries a price tag of roughly $34.8 billion (Dh128 billion) and is intended to make it the world’s largest airport by 2050.
- Full build-out capacity: five runways, ~400 gates, up to 260 million passengers annually and 12 million tonnes of cargo.
- Phase one, targeted for around 2032, alone will handle 150 million passengers a year.
- The project has already reshaped Dubai South real estate, with transactions surpassing AED 15 billion in the first five months of 2025.
- It is the anchor project within a broader $183 billion regional airport investment wave across the Middle East, Africa, and South Asia.
FAQ
When will Al Maktoum International Airport be the world’s largest? Full completion is projected around 2050, though the first major phase is targeted for roughly 2032.
How many passengers will Al Maktoum Airport handle? Up to 260 million passengers annually at full capacity, with the first completed phase alone handling 150 million.
Will Emirates move its operations to the new airport? Yes — all Dubai International Airport operations, including Emirates’ long-haul network, are expected to eventually transfer to Al Maktoum International.
Discover more from The Economy
Subscribe to get the latest posts sent to your email.
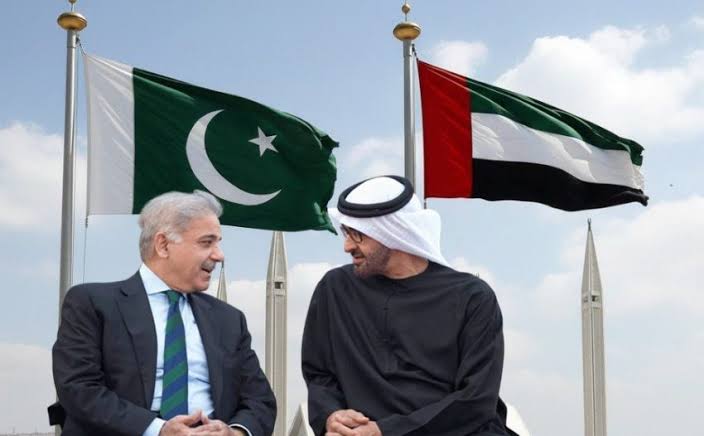
What happened: In early 2026, the United Arab Emirates declined to roll over a $3 billion loan to Pakistan — the first such refusal in seven years. The repayment equalled roughly 18% of Pakistan’s foreign currency reserves, arriving as Islamabad also faced a $1.3 billion bond payment and was waiting on the next IMF tranche.
Why it matters: It’s the clearest sign yet that Gulf sovereign patience with Pakistan’s balance-of-payments cycle is thinning, even as Gulf states simultaneously court China, Saudi Arabia, and each other for capital in a tightening regional liquidity environment.
The Story Nobody’s Connecting
Most coverage of Pakistan’s 2026 external account stress treats the UAE’s loan decision as an isolated liquidity event — a “routine financial transaction,” in the words of Pakistan’s own Ministry of Foreign Affairs. That framing misses the bigger pattern. The same weeks that Abu Dhabi called in its $3 billion, unusual delays began appearing in bank transfers from Saudi Arabia to the UAE itself — friction between the Gulf’s two largest economies, at a moment when both are also managing their own post-war oil price adjustment. (Pakistan & Gulf Economist)
Put those two data points together and a different story emerges: this isn’t just about Pakistan’s creditworthiness. It’s about Gulf capital becoming more selective, more transactional, and less willing to extend informal grace periods across the board — with Pakistan simply the most exposed borrower in the queue.
The Numbers Behind the Pressure
Pakistan’s State Bank held $16.4 billion in reserves as of late March 2026 — enough to cover roughly three months of imports, a threshold economists generally treat as a comfort floor, not a cushion. (Mettis Global News) The UAE’s declined rollover landed at the same time as a looming $1.3 billion international bond payment and dependence on the next $1.2 billion IMF disbursement — a convergence of obligations that left the State Bank with limited room to maneuver beyond import restrictions, rate hikes, or fresh commercial borrowing.
The backdrop matters too. The rupee had been trading in a comparatively narrow 278–282 band before the escalation of the Iran conflict pushed global oil prices higher, squeezing Pakistan’s import bill precisely when its Gulf safety net began to wobble. The KSE-100 benchmark, meanwhile, had already shed around 15% amid the broader pressure. (Mettis Global News)
This is not Pakistan’s first Gulf-dependency cycle. The IMF’s own record shows a now-familiar pattern: staff-level agreements reached in Dubai, UAE pledges of multibillion-dollar investment arriving alongside IMF tranches, and Gulf bridge financing used to stave off sovereign default in periods when reserves cover shrinks toward zero. (Business Standard) What’s different in 2026 is that the bridge itself is showing cracks.
Islamabad’s Official Line vs. the Structural Reality
Pakistan’s government has leaned into a “stability to sustainable growth” narrative around its FY2026–27 federal budget, with the finance minister framing the transition as export-driven rather than reserve-dependent. Business groups have broadly welcomed the budget, and the current account posted a $459 million surplus in May 2026, an improvement attributed to strong remittance inflows. (Business Recorder) The Monetary Policy Committee has held rates steady rather than reaching for emergency tightening, which is itself a signal that the central bank does not yet see the UAE episode as a systemic trigger.
But a current account surplus built substantially on remittances is different from one built on export competitiveness or durable FDI. Pakistan’s trade structure still leans heavily on a narrow set of partners: China supplies over a quarter of its imports and a meaningful share of its exports, the UAE is both a top export destination and its second-largest import source, and Gulf states collectively remain the primary channel for both remittances and emergency liquidity. (Wikipedia — Economy of Pakistan) That concentration is precisely what makes a single Gulf lender’s changed appetite so consequential.
Why the Oil Backdrop Compounds the Risk
None of this is happening in a vacuum. The IMF’s own July 2026 commentary noted that global oil markets “absorbed the war shock” from the Iran conflict, but cautioned that buffers — spare production capacity, strategic reserves, shipping insurance capacity — are running low. (IMF Blog) For an oil-importing, reserve-constrained economy like Pakistan, a second energy price shock without deeper buffers would land directly on the same reserves the UAE loan was meant to protect.
What to Watch Next
- Whether Saudi Arabia steps in as an alternative bridge lender, or whether the Riyadh–Abu Dhabi transfer friction signals a broader Gulf liquidity tightening that limits everyone’s appetite to backstop Pakistan.
- The pace and size of the next IMF tranche, and whether Fund conditionality shifts to demand deeper reserve buffers given the UAE precedent.
- Whether China increases its role as lender of last resort, deepening Pakistan’s dependency in exactly the direction Gulf financing was historically meant to offset.
Discover more from The Economy
Subscribe to get the latest posts sent to your email.
Introduction
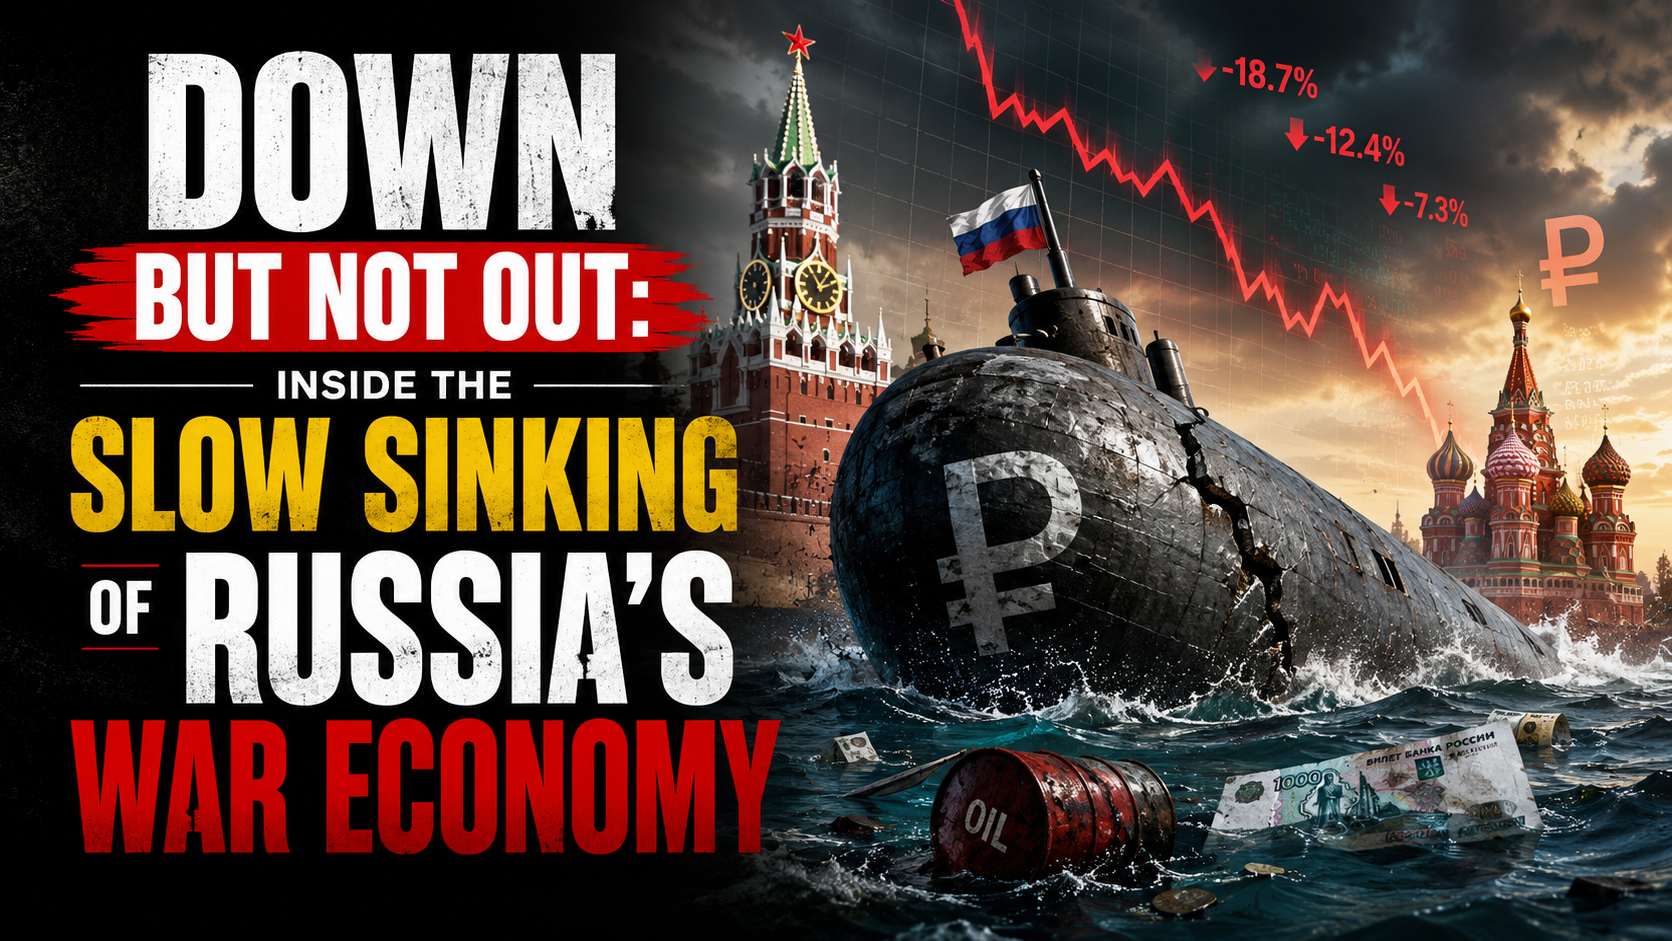
The European Council formally extended its economic sanctions against Russia for another full year on 25 June 2026, keeping restrictive measures in place until 31 July 2027 (Council of the EU). More than four years into the war, the headline story of Russia’s economy has shifted from whether sanctions would work to a more nuanced question: how much longer can the Kremlin keep financing the war before the accumulated strain becomes impossible to hide behind favorable official statistics.
The Sanctions Architecture, Renewed Again
The EU’s economic measures against Russia, first introduced in 2014 and dramatically expanded after the February 2022 full-scale invasion, now span trade, finance, energy and dual-use technology restrictions, alongside asset freezes and travel bans on a broad range of individuals and entities (Council of the EU). Since February 2022, the EU has adopted 20 separate sanctions packages, and the European Council has explicitly stated it remains determined to keep weakening Russia’s war economy by further reducing its energy revenues, curbing shadow-fleet oil shipping operations and constraining its banking system (Council of the EU). Separately, on 3 July 2026 the EU sanctioned six individuals connected to the poisoning and death of opposition figure Alexei Navalny, underscoring that the sanctions regime continues to expand on human-rights grounds as well as economic ones (Council of the EU Sanctions Timeline).
The Headline Numbers Beijing-Style Optimism Can No Longer Explain Away
Russia’s GDP is now put at roughly $2.51 trillion, the world’s eleventh-largest economy — comparable in size to South Korea despite Russia’s vastly larger landmass and resource base — with 2026 growth projected at just 1.0% and inflation running at 5.2% (Statistics of the World). More pessimistic estimates put full-year 2026 growth even lower, at around 0.4%, which would be worse than 2025’s already-weak 1% expansion and would mark a sharp deceleration from the 4.1% growth Russia posted in 2023 as it forged new trading relationships to route around initial sanctions (Forbes).
Oil and gas revenues — historically around half of Russia’s state income — have fallen to roughly a quarter, a deliberate outcome of Western sanctions strategy that targets how much Russia earns from exports rather than blocking those exports outright (Stockholm School of Economics/SITE). Russia’s oil and gas budget revenues reportedly halved in January 2026 alone, with crude prices falling below $73 a barrel before the Middle East conflict briefly reversed the trend, sending Brent surging more than 55% to near $120 a barrel at its peak (Forbes).
The Middle East War: A Temporary Lifeline With Long-Term Costs
The spike in oil prices tied to the Iran conflict, combined with a period of eased US sanctions enforcement on Russian oil under President Trump, offered Moscow unexpected fiscal breathing room in mid-2026 (Forbes). But that same conflict has undermined Russia’s longer-term energy diversification ambitions in the region: two Russian-backed power plant projects in Iran have been put on hold, along with oil and gas exploration work and plans to build new transit routes linking Russia to India via Iran (Forbes).
The Gap Between Official Statistics and Underlying Reality
Perhaps the most important analytical point from recent research is not about any single data point but about the reliability of Russian statistics themselves. Torbjörn Becker of the Stockholm Institute of Transition Economics has argued the real test of sanctions is not whether they end the war overnight, but how much they erode the Kremlin’s capacity to finance it — and by that measure, the evidence points to deeper strain than headline GDP figures suggest (Stockholm School of Economics/SITE). Becker notes that Russia’s economy grew only modestly in 2022 despite oil prices rising sharply that year — a gap between expected and actual performance that implies a considerably larger hidden economic hit than the official contraction figures showed (Stockholm School of Economics/SITE). Compounding the problem, Russian authorities have stopped publishing several key statistics since 2022, making independent assessment of inflation, consumption and real economic conditions increasingly difficult — leading Becker to conclude that “statistics have become part of the narrative” rather than a neutral measure of economic reality (Stockholm School of Economics/SITE).
The Military-Civilian Economic Split
A recurring theme across recent analysis is the growing bifurcation between Russia’s overheating military-industrial sector and a stagnating civilian economy. This imbalance has pushed interest rates higher and forced the liquidation of a striking 71% of Russia’s gold reserves to help fund continued war spending (Forbes). Russia’s total fossil fuel export revenue is estimated at roughly €734 million per day, underscoring just how central hydrocarbon income remains to the entire war financing model even as that revenue stream shrinks (Forbes).
The Counter-Narrative: Wages Still Rising
It would be inaccurate to describe Russia’s economy as in freefall. CSIS research notes that Russian salaries rose 17.8% in nominal terms and 8.7% in real terms in 2024 compared to 2023, with disposable incomes up 6.1% in 2023 and 7.3% in 2024 — growth rates not seen in Russia in almost two decades (CSIS). Government budget projections still expect real salaries to rise, albeit at a decelerating pace: 7% in 2025, 5.7% in 2026 and 4.1% in 2027 — a marked slowdown from the 2024 peak but still roughly double the pre-invasion decade average (CSIS). This wage growth, driven substantially by wartime labor shortages and military-adjacent spending, is precisely the kind of headline-stabilizing data point that has allowed Putin to argue publicly that sanctions have failed to cripple his economy (Fortune) — even as think tanks describe the broader trajectory as pushing Russia toward what one report calls an “economic, political, and military abyss” (Fortune).
What Comes Next
Renewed legislative pressure in Washington — including the Sanctioning Russia Act introduced with strong bipartisan support — signals appetite in the US for tightening the screws further, even as the loss of a key congressional champion for that effort has complicated the political path forward (TIME). Whether the EU’s renewed sanctions regime, continued oil price pressure, and constrained reserves ultimately force a shift in Kremlin calculus toward negotiation remains the central open question for 2027.
Key Takeaways
- The EU has extended Russia sanctions for a further year, through 31 July 2027, continuing a regime built from 20 separate packages since 2022.
- Russia’s 2026 GDP growth is forecast between 0.4% and 1.0%, a sharp deceleration from 2023’s 4.1% post-shock rebound.
- Oil and gas revenue’s share of Russian state income has fallen from roughly half to about a quarter as Western sanctions target export earnings specifically.
- Russia has liquidated a large share of its gold reserves to sustain war financing amid a widening split between an overheating military sector and a stagnating civilian economy.
- Official Russian statistics likely understate the true economic strain, according to independent economists who cite a widening gap between reported and expected performance.
Sources: Council of the EU, Council of the EU Sanctions Timeline, Stockholm School of Economics/SITE, Forbes, Statistics of the World, CSIS, Fortune, TIME
Discover more from The Economy
Subscribe to get the latest posts sent to your email.

Macroeconomic Fallout of Middle Eastern Airspace Restrictions: Why U.S. Carriers Are Abandoning Gulf Hubs Through 2027

High-CPM Finance Niches 2026: Publisher Monetization Blueprint

IMF & World Bank 2026 Global Economic Outlook: Growth, Inflation, Debt

Pork Recall 2026: USDA Guanciale Listeria Recall in 8 States Explained

Zelda: Ocarina of Time Switch 2 Remake — Release Date & Everything Confirmed

Social Security Trust Fund 2032: OASI Depletion Timeline Explained

Oracle (ORCL) Stock Analysis: AI Cloud Growth Ahead of Sept 10 Earnings

2027 Social Security COLA: 3.5% Increase Explained

Non-State Actors and AI 2026: The Push for Global Guardrails

Mandatory Lobbying Registers 2026: Corporate Risk Guide

Beyond $100 Oil: Why the Geopolitical Shock at Hormuz Marks a Structural Turning Point

Digitally Deliverable Services: 56% of Global Trade in 2026

AI Data Center Real Estate 2026: Power & Grid Battle Guide

Smart Glasses Privacy Crisis 2026: Regulation & Compliance

State Farm’s $5B Dividend 2026: Who Qualifies & Payout Dates

US-China Relations in Q3 2026: Trade Tariffs and Supply Chain Risks

Gold’s Wild 2026: From a Record $5,600 Peak to a 24% Crash and Back Toward $4,500

Oil Surges as Strait of Hormuz Traffic Collapses Again

The Rocket That Won’t Quit: Inside SpaceX’s Falcon 9 Launch Machine

Bank of England Set to Hold Rates Through Year-End, Reuters Poll Shows

The 2026 Crypto Regulatory Shift: What It Means for Institutional Investors

SpaceX Starship Flight 14: First Orbital Attempt & Starlink V3 Launch Explained

Retail Earnings Week: What Home Depot, Target & Walmart Reveal

AI-Powered Training: The Next Multi-Billion Dollar Ecosystem in Fitness

AI Chip Stocks 2026: The Best Semiconductor Investments Beyond Marvell

Russia’s Black Sea Oil Exports Fall for a Fifth Straight Week

China’s Economy Has a Structural Problem: Factories Are Winning, Households Are Losing

Global Chip Selloff Deepens: What’s Driving the Aug. 19 Semiconductor Rout
-

 Markets & Finance8 months ago
Top 15 Stocks for Investment in 2026 in PSX: Your Complete Guide to Pakistan’s Best Investment Opportunities
-

 Analysis7 months ago
Johor’s Investment Boom: The Hidden Costs Behind Malaysia’s Most Ambitious Economic Surge
-

 Analysis7 months ago
Top 10 Stocks for Investment in PSX for Quick Returns in 2026
-

 Analysis7 months ago
Brazil’s Rare Earth Race: US, EU, and China Compete for Critical Minerals as Tensions Rise
-

 Banks8 months ago
Best Investments in Pakistan 2026: Top 10 Low-Price Shares and Long-Term Picks for the PSX
-

 Investment8 months ago
Top 10 Mutual Fund Managers in Pakistan for Investment in 2026: A Comprehensive Guide for Optimal Returns
-

 Global Economy9 months ago
15 Most Lucrative Sectors for Investment in Pakistan: A 2025 Data-Driven Analysis
-

 Global Economy9 months ago
Pakistan’s Export Goldmine: 10 Game-Changing Markets Where Pakistani Businesses Are Winning Big in 2025
Pingback: South Asia's Economic Renaissance: 5 Markets Leading Recovery - The Economy