
Banks
Singapore’s Banking Paradox: Why Fee Income and Loan Recovery Can’t Fully Save Margins in 2026
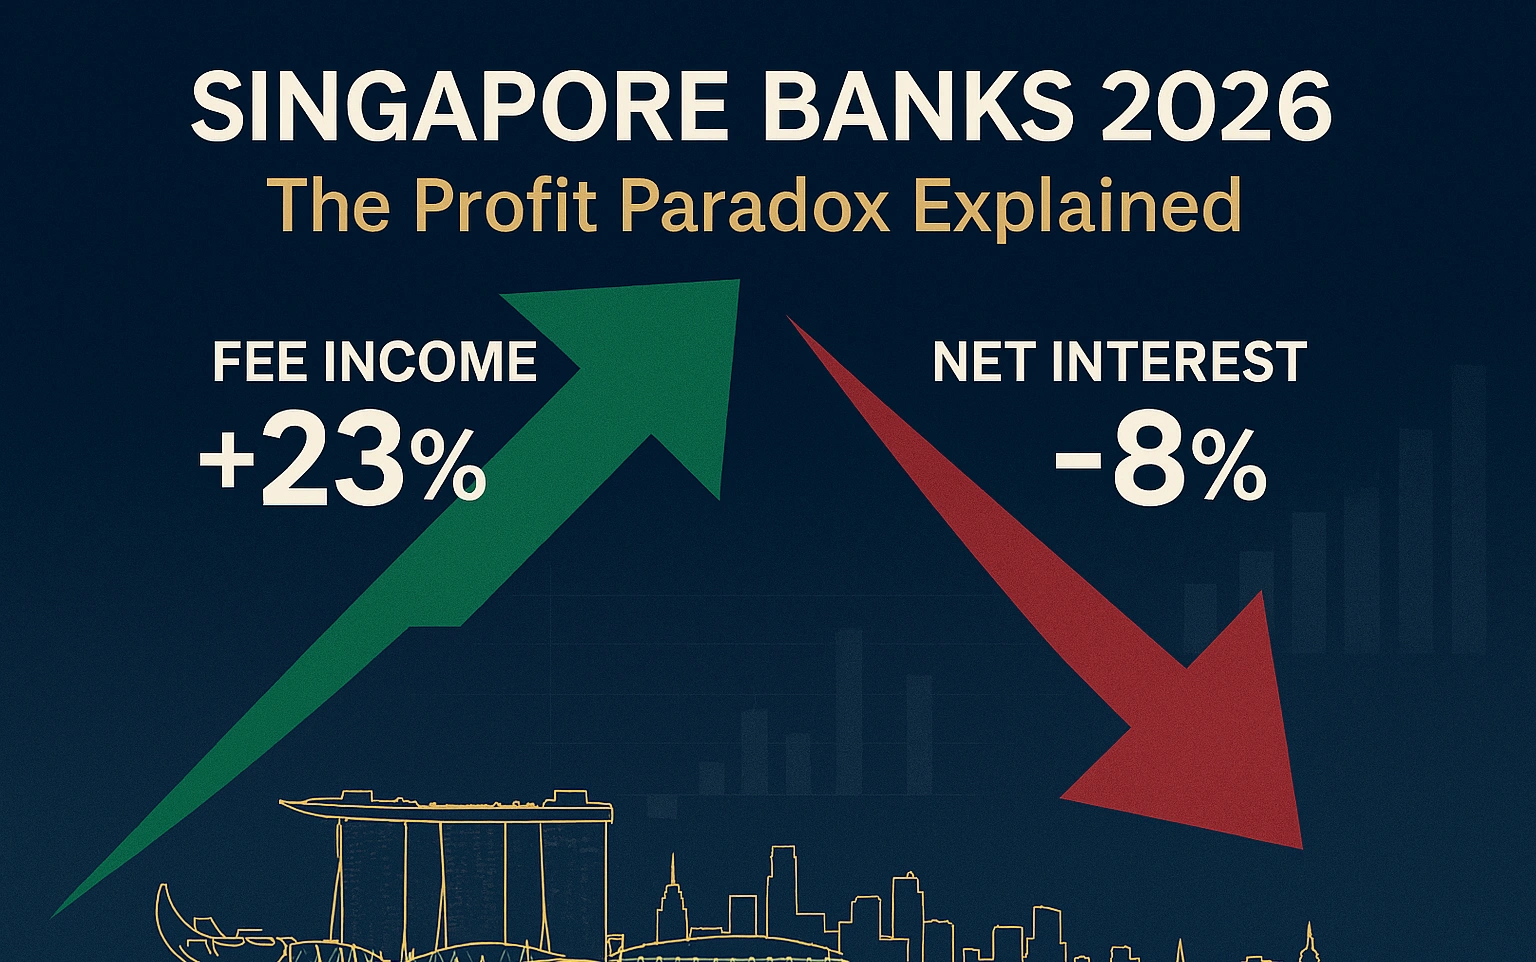
The city-state’s banking giants are rewriting their revenue playbook as traditional profit engines sputter—here’s what investors need to know
When DBS CEO announced Q3 2025 results with wealth management fees surging 20% year-over-year, the stock dropped 4%. Welcome to the new reality for Singapore banking: spectacular growth in one revenue stream can’t quite compensate for what’s eroding in another.
As 2026 unfolds, Singapore’s Big Three banks—DBS Group Holdings, OCBC Bank, and United Overseas Bank—find themselves navigating a fundamental recalibration. Analysts foresee a 2% growth in earnings per share for DBS in 2026, driven mainly through fee income, while net interest margins are anticipated to soften further, with UOB guiding for 1.75%-1.80%, down from 1.85%-1.90% in 2025.
This isn’t a crisis. It’s a transformation—one that reveals which banks have successfully diversified their revenue engines and which remain dangerously dependent on interest spreads that peaked in 2024 and won’t return anytime soon.
The Great Margin Squeeze: Why Singapore Banks Face Their Toughest Earnings Test in Years
The golden age of Singapore banking profitability, fueled by the 2022-2024 interest rate surge, is definitively over. Net interest margin declined to 1.84% for OCBC in Q3 2025 from 1.92% in Q2, while DBS reported the highest net interest margin at 1.96%, compared to 1.84% for OCBC and 1.82% for UOB.
These numbers tell a stark story. Between Q2 2024 and Q3 2025, Singapore’s banks watched their core profit engine—the spread between what they charge on loans and what they pay on deposits—compress by 15 to 28 basis points. For context, every 10 basis point decline in net interest margin reduces group profit by approximately 2-3%, according to bank management guidance.
Key Takeaways for Investors
- Net interest margins will compress further in 2026, with UOB guiding 1.75-1.80% versus 1.85-1.90% in 2025
- Wealth management AUM surged 18% year-over-year for DBS and OCBC, 8% for UOB in Q3 2025
- Dividend yields forecast at 6.1% for DBS, 5.4% for OCBC and UOB in FY2026
- Loan growth expected at low-to-mid single digits (2-5%), driven by corporate lending and regional expansion
- All three banks maintain CET1 ratios above 15%, providing capital buffers for dividends and buybacks
The culprit? A perfect storm of declining benchmark rates and aggressive deposit repricing. Flagship current accounts and SGD fixed deposits have been repriced by -120 basis points to -175 basis points from Q3 2024 to Q3 2025, with UOB making a further 60 basis point cut to its flagship current account in December 2025.
Here’s what makes this particularly challenging: while rates fell sharply, banks couldn’t immediately reduce deposit rates without risking customer flight. This asymmetry—loans repricing downward quickly while deposits adjust slowly—creates a painful compression period that Singapore banks are navigating right now.
The regional comparison is equally sobering. UOB’s net interest margin narrowed to 1.82% from 2.05%, representing a 23 basis point decline that exceeds what many regional peers experienced. Hong Kong banks, facing similar rate dynamics, have generally maintained margins in the 1.6%-1.9% range, suggesting Singapore banks entered this downturn from a higher baseline—meaning they had further to fall.
Yet there’s a crucial silver lining buried in the data. DBS economists expect 3-month Singapore Overnight Rate Average (SORA) to rebound from lows of 1.13% in early December 2025 to hold at approximately 1.25% through 2026. This stabilization suggests the worst of the margin compression may be behind us, even if margins don’t recover to 2024 peaks.

Fee Income Revolution: The S$4.8 Billion Question Reshaping Singapore Banking
While net interest income declines, an extraordinary wealth management boom is reshaping Singapore’s banking landscape—and the numbers are staggering.
DBS’s wealth management assets under management rose 12% year-on-year in the first half of 2025, while wealth income grew 8% year-on-year. Meanwhile, OCBC recorded an 11% year-on-year increase in wealth management AUM, with wealth income up 4% year-on-year. Even UOB, dealing with integration challenges from its Citibank acquisition, posted respectable gains.
By Q3 2025, the momentum accelerated dramatically. Assets under management grew 18% year-over-year for both DBS and OCBC, while UOB recorded an 8% increase. To put these figures in perspective: DBS alone added approximately S$21 billion in net new money in 2024, lifting total AUM to S$426 billion.
What’s driving this wealth influx? Singapore’s transformation into Asia’s premier wealth management hub isn’t accidental—it’s structural. The city-state now hosts 1,650 single-family offices as of 2025, nearly double the count from two years earlier. Each of these family offices represents not just wealthy individuals parking capital, but sophisticated financial entities requiring comprehensive banking services: treasury management, foreign exchange hedging, multi-currency accounts, and bespoke lending arrangements.
The fee composition tells an even more interesting story. Wealth management income isn’t just investment management fees—it encompasses a sophisticated menu of services. DBS, for instance, generates wealth fees from discretionary portfolio management (where the bank makes investment decisions on behalf of clients), advisory services, custody fees, transaction commissions on securities trades, foreign exchange markups, and insurance product distribution through its bancassurance partnerships.
Fee income showed strong 20% year-over-year growth to S$1.58 billion for DBS in Q3 2025, driven primarily by wealth management fee income. OCBC’s performance was equally impressive, with 15% year-over-year growth in non-interest income to S$1.57 billion, driven particularly by net fees and commissions in wealth management.
The mathematics of fee income versus net interest income deserves scrutiny. While fee income is growing at double-digit rates, it starts from a much smaller base than net interest income. For DBS, total fee income of approximately S$6 billion annually still represents roughly one-third of total net interest income. This means even a 20% surge in fees can only partially offset a 5-8% decline in NII.
But here’s what makes the fee story genuinely transformational: quality of earnings. Net interest income is inherently cyclical, tied to central bank policies and economic cycles beyond any individual bank’s control. Fee income, particularly from wealth management, is stickier. Once a bank captures a wealthy family’s business—establishing trust, demonstrating competence, and embedding itself in the family’s financial infrastructure—that relationship tends to persist across interest rate cycles.
The sustainability question looms large, however. Can wealth inflows continue at this pace? Two factors suggest yes. First, geopolitical instability in Hong Kong continues to drive capital southward. Second, ESG-related investments in Singapore have surged to SGD 45 billion by 2025, doubling in just two years, creating entirely new fee pools as banks develop and distribute sustainable investment products.
Loan Growth: The Comeback That Almost Wasn’t
For most of 2023 and early 2024, loan growth was Singapore banks’ Achilles heel. High interest rates discouraged borrowing, corporate treasurers prioritized paying down debt, and property market cooling measures kept mortgage growth subdued.
The turnaround, while modest, is real. Overall loans to non-bank customers grew by 4.7% year-over-year as of August 2025, compared to 3.8% in Q2, driven by higher corporate loans to residents and increased lending to the Americas.
Breaking down the loan book reveals where growth is materializing. Singapore bank loans increased to SGD 853.3 billion in June 2025 from SGD 844.6 billion in May 2025, driven by higher loans to businesses. Within the business sector, particularly strong growth appeared in building and construction (up to SGD 178.8 billion), general commerce (SGD 88 billion), and financial and insurance activities.
Consumer lending tells a more nuanced story. Housing and bridging loans increased to SGD 237.2 billion in June 2025 from SGD 235.7 billion in May, representing growth but at a glacial pace given Singapore’s perpetually hot property market. This reflects the ongoing impact of property cooling measures—higher stamp duties, tighter loan-to-value ratios, and total debt servicing ratio frameworks that limit how much Singaporeans can borrow relative to their income.
The 2026 outlook for loan growth requires parsing bank-specific guidance and macroeconomic realities. UOB expects low single-digit loan growth, which translates to roughly 2-3% expansion. OCBC projects mid-single-digit loan growth (approximately 4-5%), while DBS, despite its optimistic tone, faces mathematical challenges in maintaining growth from the largest loan book base among the three.
Corporate lending opportunities exist but come with important caveats. Singapore’s GDP growth is projected at 1-3% for 2026, significantly below the 4.4% achieved in 2024. This slower growth naturally constrains business expansion and, by extension, credit demand. However, credit demand should stay healthy in the immediate term as business sentiment improves amid some reduction in uncertainty.
Trade finance represents another bright spot. Singapore’s position as ASEAN’s financial hub means it captures a disproportionate share of regional trade financing. As ASEAN economies continue their 5-6% growth trajectories—faster than developed markets—Singapore banks benefit from financing intra-regional commerce, even when Singapore’s own domestic economy grows more slowly.
The property market deserves special attention because it represents such a large portion of consumer loan books. While mortgage rates are likely to continue easing, potentially offering some relief to homeowners or those looking to enter the property market, banks are simultaneously becoming more cautious. Banks will be scrutinizing loan applications more carefully, particularly for investment properties or in sectors they perceive as higher risk.
This creates an interesting dynamic: borrowing costs are falling, which should stimulate demand, but credit standards are tightening, which constrains supply. The net effect will likely be modest loan growth—positive but underwhelming—that contributes to but doesn’t transform the earnings picture.
The Analyst Verdict: Flattish Profits, Spectacular Dividends
Wall Street and regional investment banks have coalesced around a remarkably consistent view of Singapore banks’ 2026 prospects: profits will plateau or decline slightly, but shareholder returns remain compelling.
DBS is forecast to post a dividend yield of 6.1% in FY2026, while OCBC and UOB are each expected to offer yields of about 5.4%. These yields sit well above Singapore’s 10-year government bond yield (approximately 2.8%) and comfortably exceed fixed deposit rates offered by the same banks (ranging from 2.5-3.2% for 12-month placements).
The earnings forecasts themselves paint a picture of stability rather than excitement. DBS, the sector bellwether, faces expectations of approximately 2% earnings growth—essentially flat in real terms after accounting for inflation. The net profit may ease slightly from 2025 peaks, while total income stays stable.
What underpins these dividend forecasts isn’t just current profitability but capital strength. All three banks maintain Common Equity Tier 1 (CET1) ratios exceeding 15%, which sits comfortably 5 percentage points above Monetary Authority of Singapore requirements. This excess capital provides multiple strategic options: higher dividends, share buybacks, or capital-return programs.
Dividend yields of up to 6% and excess capital continue to be strong tailwinds for the sector, with potential for general provisions writeback and excess capital on the cards (exempting UOB). The mention of general provisions writeback is significant. During 2020-2021, banks dramatically increased loan loss provisions anticipating COVID-related defaults that ultimately materialized less severely than feared. As these precautionary provisions prove unnecessary, banks can release them back into earnings, providing a one-time boost to reported profits.
The investment case increasingly hinges on total shareholder return (capital appreciation plus dividends) rather than earnings growth alone. At current valuations, DBS trades at the highest price-to-earnings and price-to-book ratios among the three banks, with the lowest dividend yield, reflecting its premium positioning and superior return on equity of 17.1%.
Regional comparisons provide useful context. Hong Kong banks trade at similar valuation multiples but face greater uncertainty from China’s property market struggles and geopolitical tensions. Australian banks offer comparable dividend yields but operate in a more mature, slower-growth market. Singapore banks occupy a sweet spot: developed-market stability with emerging-market wealth accumulation dynamics.
One crucial risk factor that analysts flag consistently is asset quality, particularly concerning exposure to Greater China property markets. UOB faced sharply higher allowances for credit and other losses, working through refinancing stress in parts of its real estate exposure. While systemic risk appears contained—Singapore banks’ direct exposure to distressed Chinese developers remains limited—any deterioration would quickly undermine the benign credit cost assumptions underpinning 2026 forecasts.
Strategic Crossroads: How Banks Are Adapting Beyond 2026
The banks’ strategic responses to margin pressure reveal dramatically different philosophies about the future of banking in Asia.
DBS has doubled down on digital transformation and regional expansion. The bank’s wealth management success stems partly from technology investments that allow relationship managers to serve more clients more efficiently. Its digital platforms process over $1 billion in daily transaction volumes, generating fee income from every foreign exchange conversion, cross-border payment, and securities trade.
OCBC’s strategy centers on insurance integration and what it calls the “multi-pillar” approach. OCBC Bank’s performance highlights the critical role of diversification in insulating total income, allowing net profit to remain virtually unchanged year-over-year. Through Great Eastern, its insurance subsidiary, OCBC cross-sells life insurance and investment-linked products to banking customers, generating commissions that appear in non-interest income but originate from the banking relationship.
UOB faces the most complex strategic challenge: integrating the Citibank consumer businesses it acquired across Thailand, Malaysia, Vietnam, and Indonesia. The synergy extraction phase from the integration of Citi Malaysia, Thailand, Indonesia, and Vietnam is proving more challenging than initially anticipated. However, UOB aims to accelerate Southeast Asia expansion, targeting 30% of revenue from the region in 2026, while keeping Singapore’s revenue share at 50%.
The technology arms race deserves particular attention. All three banks are investing heavily in artificial intelligence for credit underwriting, fraud detection, and customer service. DBS processes loan applications that once took three days in under 30 minutes using machine learning models that assess creditworthiness across hundreds of data points. These efficiency gains directly impact the cost-to-income ratio—a critical metric as revenue growth slows.
Regulatory environment shifts could also reshape the competitive landscape. The Monetary Authority of Singapore continues refining frameworks around digital banks, cryptocurrency, and family office regulation. Any tightening of wealth management regulations could slow the very fee income growth that banks are counting on to offset margin compression.
The 2026 Investment Case: Income Over Growth
For investors weighing Singapore bank stocks as 2026 approaches, the thesis has fundamentally shifted from a growth story to an income story.
The bull case rests on three pillars. First, Singapore equity valuations remain attractive, with the yield gap against T-bills tracking above historical averages. Second, dividend sustainability looks rock-solid given excess capital buffers. Third, the worst of net interest margin compression has likely passed, meaning earnings should stabilize rather than continue deteriorating.
The bear case centers on limited upside. With analysts forecasting essentially flat earnings growth, capital appreciation depends on multiple expansion—investors paying more for the same earnings—which seems unlikely in a higher-interest-rate world where bonds offer decent yields. Additionally, any negative surprises on asset quality, particularly from China exposure or Singapore property market weakening, could quickly undermine the defensive narrative.
For income-focused investors, particularly retirees or those building dividend portfolios, Singapore banks offer rare combination of yield, quality, and liquidity. The 5.4-6.1% dividend yields exceed what most developed-market banks offer, while Singapore’s regulatory framework and banks’ capital strength provide safety that emerging market banks cannot match.
The technical picture matters too. The sector is expected to see continued fund inflows, supported by a second round of Equity Market Development Programme fund deployment extending into early 2026. This government-driven initiative channels sovereign wealth into Singapore equities, providing steady bid support that can dampen volatility and support valuations.
Conclusion: Excellence Amid Moderation
Singapore’s banking sector enters 2026 not in crisis but in transition. The extraordinary profitability of 2023-2024, driven by interest rate tailwinds that won’t repeat, is giving way to a more nuanced revenue model where fee income and modest loan growth must compensate for narrowing margins.
Analysts foresee wealth management momentum continuing, creating compensatory fees in place of declines in net interest income. Whether this compensation proves complete or partial will determine whether 2026 earnings merely flatline or actually contract.
For DBS, OCBC, and UOB, the test isn’t survival—their balance sheets and market positions ensure that—but rather whether they can demonstrate the strategic agility to thrive in a lower-margin environment. Early evidence suggests they can, but the journey from record profits to sustainable, diversified excellence requires execution discipline that few banks globally have consistently demonstrated.
Investors should approach Singapore banks with realistic expectations: high dividend yields and defensive characteristics, but limited capital appreciation until either interest rates rise again or fee income growth accelerates beyond current trajectories. That’s not a condemnation—it’s simply the reality of mature, well-capitalized banks operating in a moderating economic environment.
The Singapore banking story for 2026 isn’t about explosive growth. It’s about quality income, prudent capital management, and the slow transformation of business models to match a changing economic reality. For investors seeking stable returns in uncertain times, that might be exactly what they need.
What’s your take on Singapore banks’ strategic pivot? Can fee income models sustainably replace net interest income dominance, or are we witnessing temporary compensation for cyclical margin pressure? Share your perspective in the comments below.
Discover more from The Economy
Subscribe to get the latest posts sent to your email.


Banks
Pakistan’s Most Reliable Export Is Its People: Remittances Hit $41.6 Billion, Overtaking Total Exports

Introduction
For the first time in the country’s history, money sent home by Pakistan’s overseas workers has exceeded the value of everything Pakistan actually sells abroad. Remittances hit a record $41.6 billion in the fiscal year ending June 30, 2026, according to State Bank of Pakistan data — surpassing total merchandise exports for the same period and cementing a structural shift that economists are increasingly uneasy about (VOI World/State Bank of Pakistan).
The Numbers Behind the Milestone
Remittance inflows rose 8.6% year-on-year in FY26, up from $38.3 billion in FY25 (VOI World). Some reporting puts the full 11-month figure even higher at $38 billion before the final month was tallied, with May 2026 alone contributing $4.25 billion — an amount roughly equal to what the entire country spends on imports in a single month (Express Tribune). A separate Express Tribune report puts the full FY26 total even higher, at $41.58 billion, an increase of nearly $3.29 billion over the prior year, delivered “without structured educational, training or welfare support” for the overseas workforce generating it (Express Tribune — Remittances Without Structured Support).
Saudi Arabia remained the single largest source of remittances in June 2026 at $829.6 million, followed by the UAE ($792.3 million), the United Kingdom ($514.9 million) and the United States ($296.8 million), with Italy and Oman each contributing more than $100 million (VOI World). That geographic concentration matters: a substantial share of Pakistan’s remittance base originates from the Gulf, leaving the country’s external account exposed to labor market reforms, economic cycles and geopolitical developments concentrated in a single, currently volatile region (Business Recorder Editorial).
Exports Have Been Stuck for Years
The remittance surge stands in sharp contrast to Pakistan’s export performance, which has shown little sustained dynamism despite years of concessional financing, preferential tariff regimes and subsidized energy for exporters (Business Recorder Editorial). The textile sector — long considered the backbone of Pakistan’s export economy — has been stuck in a $15–18 billion annual range for years, even as a handful of forward-thinking textile groups have managed to grow exports and diversify product lines under the exact same operating conditions others cite as prohibitive (Express Tribune). Separately reported nine-month data for the fiscal year showed exports contracting 5.8% to $23.3 billion even as imports rose nearly 8% to $46.8 billion, widening the trade gap further (Minute Mirror).
Over the three fiscal years from 2023 to 2025, Pakistan received $95.8 billion in remittances compared with $91 billion in merchandise exports — a gap that reflects, according to Business Recorder analysis, a deliberate policy orientation that has effectively institutionalized remittances as the default tool for stabilizing the current account rather than addressing the underlying export weakness (Business Recorder Opinion).
The Dutch Disease Warning
Independent economists have begun explicitly framing this pattern as a precursor to Dutch disease — the phenomenon where a large, easy source of foreign currency inflow reduces the pressure and incentive to build a competitive tradeable export sector (Business Recorder Opinion). The policy dimension is not incidental: under IMF program conditions, a long-standing subsidy that had encouraged banks to actively mobilize remittance transfers was withdrawn in the 2026 Budget, contributing to a temporary slowdown in inflows during the early months of the fiscal year before the government released Rs30 billion from its contingency fund to help revive momentum (Business Recorder Opinion).
A Business Recorder editorial published in July 2026 was blunt about the implication: Pakistan’s overseas workers have effectively become the country’s “most reliable export,” with its own people functioning as its largest export commodity — a framing the editorial explicitly calls an unsustainable foundation for long-term development strategy (Business Recorder Editorial).
The Silver Linings
The remittance boom has provided genuine macroeconomic stabilization. Total liquid foreign reserves crossed $23.98 billion as of early July 2026, including $18.47 billion held by the State Bank of Pakistan itself, with the rupee holding relatively steady around Rs278 per dollar in the interbank market (Express Tribune — Remittances Without Structured Support). Inflation has also been easing, and large-scale manufacturing showed signs of recovery with 5.9% growth in earlier-reported data, while agricultural lending rose 14.4% during July–February, extending credit access to farmers (Minute Mirror). Separately, Pakistan has reportedly repaid roughly Rs4,722 billion in debt ahead of schedule and posted a historic milestone in IT sector exports, suggesting pockets of genuine structural improvement exist alongside the broader export stagnation (Radio Pakistan).
Why This Matters Beyond Pakistan
Pakistan’s experience is a useful case study for other remittance-dependent emerging economies navigating IMF program conditions. The core tension — using a reliable, low-effort capital inflow to paper over a harder structural problem in the tradeable goods sector — is not unique to Pakistan, but few economies illustrate the scale of the imbalance as starkly as a country where remittances now formally exceed total exports.
Key Takeaways
- Pakistan’s FY26 remittances hit a record $41.6 billion, surpassing total merchandise exports for the first time in the country’s history.
- Saudi Arabia and the UAE remain the largest single sources, concentrating external account risk in the Gulf region.
- Textile exports have been stuck between $15–18 billion annually for years despite sustained government support.
- Economists are increasingly framing the remittance-export imbalance as a Dutch disease risk rather than a stabilization success story.
- Reserves have strengthened to nearly $24 billion and the rupee has stabilized, but the underlying export competitiveness problem remains unresolved.
Sources: VOI World, Express Tribune — Remittances Dwarf Exports, Express Tribune — Remittances Without Structured Support, Business Recorder Opinion, Business Recorder Editorial, Minute Mirror, Radio Pakistan
Discover more from The Economy
Subscribe to get the latest posts sent to your email.

Singapore’s non-oil domestic exports rose 20.7% year-on-year in June 2026, driven by a 115.4% surge in integrated circuit shipments tied to AI demand, even as a separate and less-covered trade story unfolds next door: Malaysia-Indonesia bilateral trade is projected to grow 10% to US$29.3 billion in 2026, powered by expanding halal-sector cooperation.
The story most coverage is missing
Regional business press has extensively covered Singapore’s semiconductor export boom. What’s had far less coverage is the parallel, non-tech growth engine developing in the halal trade corridor between Malaysia and Indonesia — a structural, policy-driven trade relationship that is scaling steadily even as the AI trade headlines dominate attention.
Singapore: the AI supply chain’s export barometer
Singapore’s June non-oil domestic exports climbed 20.7% year-on-year, with integrated circuit exports jumping 115.4% and disk media products and personal computers rising 170.9% and 95.8% respectively — a direct read on how deeply the AI infrastructure buildout is flowing through the city-state’s electronics trade (VietnamPlus/VNA). Non-electronic exports told a different story, falling 2.9% in June after a 17.7% rise in May, mainly on weaker shipments of non-monetary gold, petrochemicals and food preparations — evidence the export strength is narrowly concentrated in the AI-linked segment rather than broad-based.
Singapore’s economic gravitational pull on its neighbours is intensifying too: a joint study by the Singapore Business Federation, Restaurant Association of Singapore and Singapore Retailers Association found Singaporean consumers are projected to spend an additional S$1.05 billion (roughly US$810 million) annually in Johor Bahru, just across the Malaysian border — a cross-border consumption pattern that is becoming a meaningful line item in regional retail planning (VietnamPlus/VNA).
The halal corridor: a steadier, policy-built growth story
While AI exports grab headlines, Malaysia’s bilateral trade with Indonesia is forecast to grow 10% to US$29.3 billion in 2026, according to Malaysia’s Chargé d’Affaires in Jakarta, Farzamie Sarkawi — up from US$26.61 billion in 2025, itself a 5.3% increase on the year before (BusinessToday Malaysia).
The driver is structural rather than cyclical: a halal Memorandum of Cooperation signed by the two countries in 2023 established mutual recognition of halal certification, easing product movement and market access across sectors. Sarkawi described the arrangement as delivering “positive progress” through knowledge exchange, training and improved market access for businesses in both countries (BusinessToday Malaysia). The ambition extends beyond the bilateral relationship: intra-D-8 trade — spanning the eight-nation Developing 8 bloc of Muslim-majority economies — currently runs between US$150 billion and US$160 billion annually, with a stated target of US$500 billion by 2030.
The macro backdrop: a region growing, unevenly
The Asian Development Bank’s July 2026 outlook shows Indonesia’s growth forecast holding steady at 5.2% for both 2026 and 2027, while Malaysia’s outlook is unchanged at 4.6% for 2026 and 4.5% for 2027 (ADB). Regional growth leadership, per McKinsey’s Q1 2026 review, sits with Indonesia, Singapore and Vietnam, while the Philippines lagged as domestic challenges weighed on activity (McKinsey).
Indonesia’s investment story has particular momentum: foreign direct investment grew for a second consecutive quarter, rising 8.1% to 249.9 trillion rupiah (roughly US$14.5 billion) in the first quarter of 2026, with Singapore remaining Indonesia’s largest single foreign investor at US$4.6 billion, ahead of China, Japan, Hong Kong and the United States (McKinsey). Realised investment for full-year 2025 reached a record Rp1,931.2 trillion (about US$120.7 billion), exceeding the government’s own target, driven by downstream industrial projects outside Java (BERNAMA).
Indonesia’s central bank has flagged currency management as an active watch item, signalling readiness to step up both onshore and offshore FX intervention to curb rupiah weakness and keep inflation within its 2026-2027 target band (McKinsey). Foreign investment in Indonesian government bonds has nonetheless rebounded, with net inflows of 17.7 trillion rupiah following outflows in the first quarter, alongside cumulative foreign holdings of 174 trillion rupiah in Bank Indonesia Rupiah Securities (BERNAMA).
Institutional context: Singapore’s coming ASEAN chairmanship
Adding a governance dimension to the economic picture, Singapore is set to take over the ASEAN chairmanship from the Philippines in 2027, with Prime Minister Lawrence Wong pledging a smooth transition — a leadership handover that will shape how the bloc coordinates trade and investment policy, including the halal-corridor and semiconductor-trade dynamics described above, through the second half of the decade (BERNAMA).
The bottom line
Southeast Asia’s 2026 growth story is not a single narrative but two distinct, converging tracks: a high-velocity, AI-linked export boom concentrated in Singapore’s electronics trade, and a steadier, policy-engineered halal-sector trade corridor between Malaysia and Indonesia that is quietly scaling toward a $500 billion bloc-wide target by 2030. Investors and policymakers tracking only the semiconductor headlines risk missing the second, structurally more durable growth engine sitting right alongside it.
Discover more from The Economy
Subscribe to get the latest posts sent to your email.
The Federal Reserve’s independence faces its most serious test in decades: a Justice Department investigation into Chair Jerome Powell over building-renovation costs, a Supreme Court case over Trump’s attempt to fire Governor Lisa Cook, and an incoming chair nomination openly tied to Trump’s demand for rates cut “by a lot” — all unfolding as the Fed tries to keep monetary policy decisions separate from the White House.
An institutional crisis hiding inside a rate-cut story
Most financial coverage this year has framed the Federal Reserve story as a simple tug-of-war over interest rates. That framing understates what is actually happening: a structural challenge to the 111-year-old convention that US monetary policy sits outside presidential control — a convention every advanced economy has treated as a prerequisite for market credibility.
The three fronts of the fight
1. The Powell investigation. In January, federal prosecutors served grand jury subpoenas tied to Powell’s congressional testimony about roughly $2.5 billion in cost overruns on the Fed’s headquarters renovation. Powell called the inquiry a “pretext” for punishing the central bank for not cutting rates as quickly as the administration wants, and warned it should be viewed “in the broader context of the administration’s threats and ongoing pressure” on the institution (CNBC). Every living former Fed chair signed a joint statement calling the probe an unprecedented attempt to use prosecutorial pressure to undermine central bank independence (NBC News).
2. The Lisa Cook case. The Supreme Court has separately taken up whether Trump can remove Fed Governor Lisa Cook over mortgage-fraud allegations she denies — a case with direct bearing on whether a president can reshape the Fed’s voting board outside the normal confirmation process (Euronews).
3. The succession fight. Trump has said publicly that Powell’s replacement — due when his term as chair ends in 2026 — should be someone who “believes in lower interest rates, by a lot” (Bloomberg). Analysts note this is a break from decades of precedent in which presidents, whatever their private preferences, avoided direct pressure on the Fed’s leadership pipeline.
Why markets are watching the mechanics, not just the rhetoric
It’s worth noting a structural check that has received less attention than it deserves: the Fed chair casts only one of twelve votes on the Federal Open Market Committee. Appointing a more compliant chair does not, by itself, guarantee the rate cuts Trump wants — any change still requires majority support across the full committee (CBS/AOL).
That has not stopped the market repricing. Following Powell’s Jackson Hole remarks suggesting the Fed could act if the labour market kept weakening, traders moved to price an 85% probability of a September rate cut, sending the S&P 500, Nasdaq and Dow higher while the dollar index and Treasury yields fell — a reaction some economists read as evidence that political pressure is already bleeding into policy expectations, independent of the FOMC’s actual vote (Barchart).
At the same time, inflation data complicates the picture for anyone expecting an easy capitulation. The Fed’s preferred inflation gauge, the PCE price index, sat at 2.8% year-over-year as of November — still above the Fed’s 2% target — while the FOMC’s December dot plot showed a more cautious rate path than markets had previously expected, with the median policymaker view placing the federal funds rate in the low-to-mid 3% range by the end of 2026 (CNBC).
Why it matters beyond the US
Central bank independence is not a purely domestic US concern. The dollar’s role as the world’s reserve currency, and Treasury yields’ function as the global risk-free benchmark, mean that any erosion in perceived Fed independence has second-order effects on borrowing costs from London to Karachi. Emerging-market central banks — including the State Bank of Pakistan and Bank Indonesia — routinely calibrate their own policy against expected Fed moves; a Fed seen as politically compromised makes that calibration harder and potentially more volatile for every economy that prices debt off US Treasuries.
RSM chief economist Joe Brusuelas has predicted Powell will use his public platform to mount “an erudite but accessible defense of central bank independence” at upcoming FOMC press conferences — a sign that Fed leadership itself views the institutional question, not just the rate decision, as the story that matters (AOL/CBS).
What to watch next
- Whether the DOJ investigation into Powell produces formal charges or fizzles amid criticism of its timing
- The Supreme Court’s ruling on the Cook removal case, which could set precedent for presidential authority over independent agency officials generally
- Trump’s formal nomination for the next Fed chair, and how openly that nominee campaigns on a specific rate target
- Whether the FOMC’s committee-based voting structure continues to act as a moderating check regardless of who chairs the meetings
The rate-cut headlines will keep coming. The more consequential story is whether the institutional guardrails around the Fed — designed explicitly to keep monetary policy insulated from electoral cycles — hold through 2026.
Discover more from The Economy
Subscribe to get the latest posts sent to your email.

Pakistan Gulf Investment Outflows 2026: Peace Deal Stakes Explained

Canada Trade Diversification 2026: China, Indonesia, UAE Deals Explained

US Forced-Labour Tariffs on 60 Countries: The Hidden Trade Shock of 2026

Global Central Banks 2026: Fed, BoE and BoJ Decisions Could Reshape Markets

Gulf Capital Retreat From Pakistan 2026: UAE Loan Freeze & What It Means

Pakistan’s Most Reliable Export Is Its People: Remittances Hit $41.6 Billion, Overtaking Total Exports

Indonesia’s Confidence Problem: Record Investment, a Sinking Rupiah, and a Widening Credibility Gap

Down But Not Out: Inside the Slow Sinking of Russia’s War Economy

China’s Growth Slips to a Four-Year Low: Why Beijing Still Won’t Pull the Stimulus Trigger

The Johor-Singapore Corridor: How Malaysia Became Southeast Asia’s AI Infrastructure Powerhouse

Canada’s Economy ‘On Pause’: Inside the CUSMA Deadline That Passed Without a Deal

Dubai’s Millionaire Magnet: How the UAE Turned Middle East Turmoil Into a Capital Safe-Haven Boom

Britain’s Sixth Prime Minister in a Decade: What Starmer’s Exit Means for Gilts, Sterling and Your Portfolio

Anthropic Offers Up to $600,000 Salary for Critical IPO Role as AI Giant Prepares for Wall Street Debut

Carry Trade Unwind 2026: How the Yen’s Snapback Triggered a Global Margin Call

AI Bubble Warning 2026: Why BIS, IMF and Bank of England Fear a Market Crash

BRICS De‑Dollarization Strategy Takes Shape with $15 Billion Local‑Currency Push

The AI Super Bubble Is Ready to Burst

Russia Bans Diesel Exports 2026: Global Fuel Market Impact Explained

Strait of Hormuz Blockade 2026: Oil Prices Surge 9% as US-Iran Conflict Reignites

Private Credit Warning: Most BDCs Turn Unprofitable in 2026, Reuters Finds

Bitcoin $150k Milestone Achieved as US Sovereign Crypto Pivot Looms

IMF Cuts Pakistan Growth Forecast, Raises Inflation to 8.4%
Gulf Capital Retreat From Pakistan 2026: UAE Loan Freeze & What It Means

India Economic Rise 2026: How the Subcontinent Toppled Japan

Strait of Hormuz 2026: Why Markets Still Don’t Trust It’s Open

China Housing Market Turnaround: White‑List Model Stabilises Prices

Chipmakers Just Lost 6.7% in Two Days: Inside the Great AI Trade Rotation
-

 Markets & Finance7 months ago
Top 15 Stocks for Investment in 2026 in PSX: Your Complete Guide to Pakistan’s Best Investment Opportunities
-

 Analysis5 months ago
Johor’s Investment Boom: The Hidden Costs Behind Malaysia’s Most Ambitious Economic Surge
-

 Analysis5 months ago
Top 10 Stocks for Investment in PSX for Quick Returns in 2026
-

 Analysis6 months ago
Brazil’s Rare Earth Race: US, EU, and China Compete for Critical Minerals as Tensions Rise
-

 Banks6 months ago
Best Investments in Pakistan 2026: Top 10 Low-Price Shares and Long-Term Picks for the PSX
-

 Investment7 months ago
Top 10 Mutual Fund Managers in Pakistan for Investment in 2026: A Comprehensive Guide for Optimal Returns
-

 Global Economy7 months ago
15 Most Lucrative Sectors for Investment in Pakistan: A 2025 Data-Driven Analysis
-

 Global Economy7 months ago
Pakistan’s Export Goldmine: 10 Game-Changing Markets Where Pakistani Businesses Are Winning Big in 2025