
Banks
Singapore’s Banking Paradox: Why Fee Income and Loan Recovery Can’t Fully Save Margins in 2026

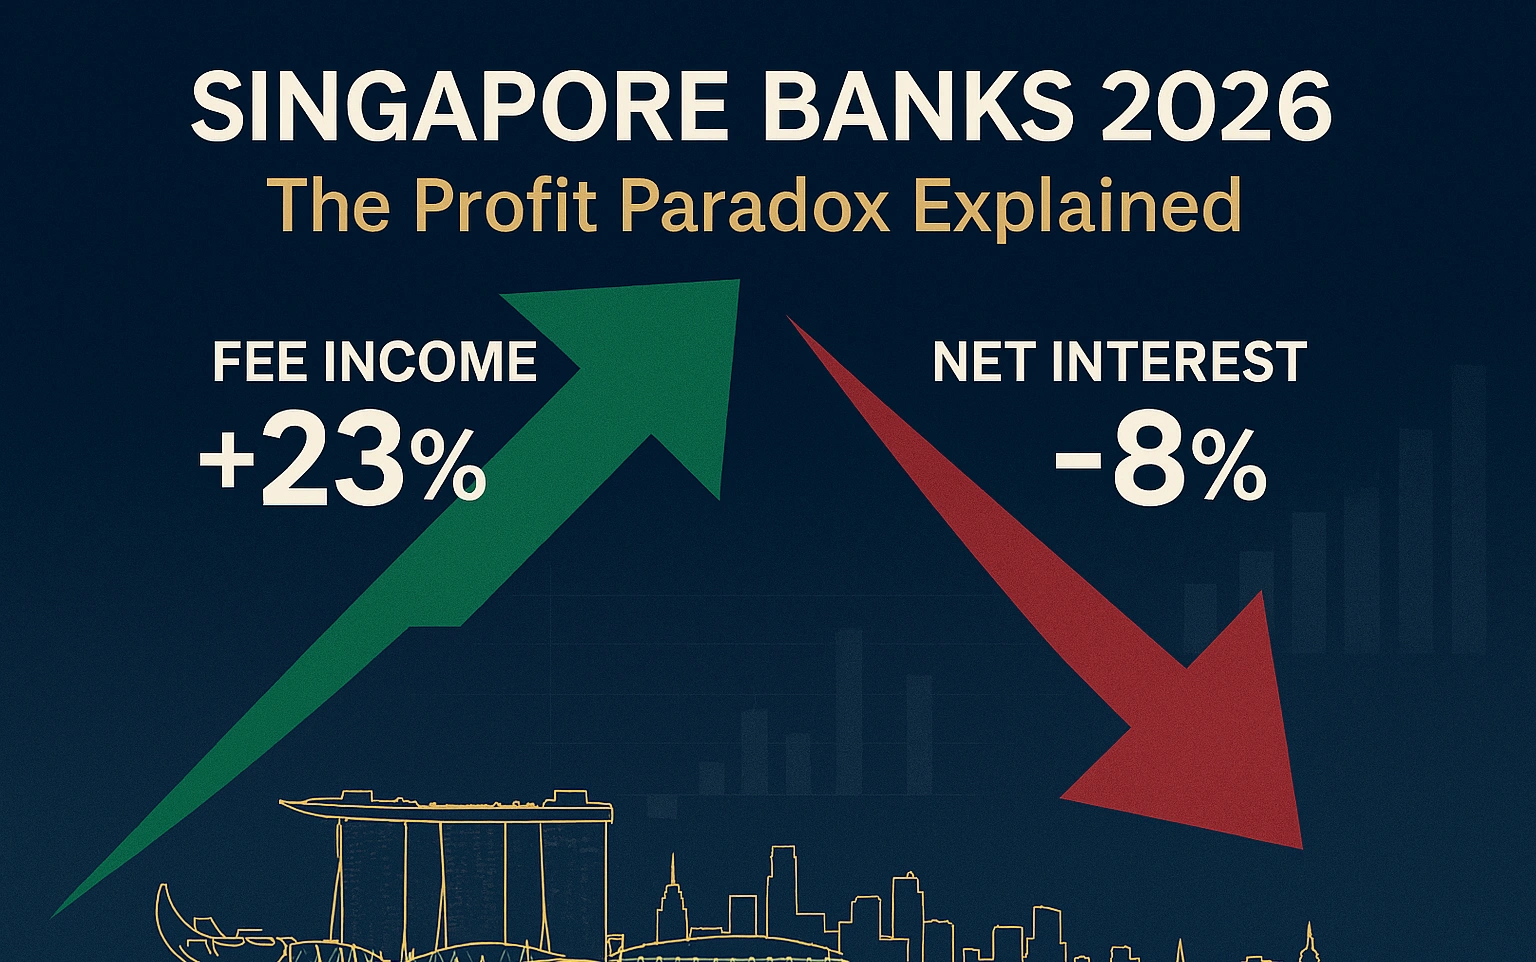
The city-state’s banking giants are rewriting their revenue playbook as traditional profit engines sputter—here’s what investors need to know
When DBS CEO announced Q3 2025 results with wealth management fees surging 20% year-over-year, the stock dropped 4%. Welcome to the new reality for Singapore banking: spectacular growth in one revenue stream can’t quite compensate for what’s eroding in another.
As 2026 unfolds, Singapore’s Big Three banks—DBS Group Holdings, OCBC Bank, and United Overseas Bank—find themselves navigating a fundamental recalibration. Analysts foresee a 2% growth in earnings per share for DBS in 2026, driven mainly through fee income, while net interest margins are anticipated to soften further, with UOB guiding for 1.75%-1.80%, down from 1.85%-1.90% in 2025.
This isn’t a crisis. It’s a transformation—one that reveals which banks have successfully diversified their revenue engines and which remain dangerously dependent on interest spreads that peaked in 2024 and won’t return anytime soon.
The Great Margin Squeeze: Why Singapore Banks Face Their Toughest Earnings Test in Years
The golden age of Singapore banking profitability, fueled by the 2022-2024 interest rate surge, is definitively over. Net interest margin declined to 1.84% for OCBC in Q3 2025 from 1.92% in Q2, while DBS reported the highest net interest margin at 1.96%, compared to 1.84% for OCBC and 1.82% for UOB.
These numbers tell a stark story. Between Q2 2024 and Q3 2025, Singapore’s banks watched their core profit engine—the spread between what they charge on loans and what they pay on deposits—compress by 15 to 28 basis points. For context, every 10 basis point decline in net interest margin reduces group profit by approximately 2-3%, according to bank management guidance.
Key Takeaways for Investors
- Net interest margins will compress further in 2026, with UOB guiding 1.75-1.80% versus 1.85-1.90% in 2025
- Wealth management AUM surged 18% year-over-year for DBS and OCBC, 8% for UOB in Q3 2025
- Dividend yields forecast at 6.1% for DBS, 5.4% for OCBC and UOB in FY2026
- Loan growth expected at low-to-mid single digits (2-5%), driven by corporate lending and regional expansion
- All three banks maintain CET1 ratios above 15%, providing capital buffers for dividends and buybacks
The culprit? A perfect storm of declining benchmark rates and aggressive deposit repricing. Flagship current accounts and SGD fixed deposits have been repriced by -120 basis points to -175 basis points from Q3 2024 to Q3 2025, with UOB making a further 60 basis point cut to its flagship current account in December 2025.
Here’s what makes this particularly challenging: while rates fell sharply, banks couldn’t immediately reduce deposit rates without risking customer flight. This asymmetry—loans repricing downward quickly while deposits adjust slowly—creates a painful compression period that Singapore banks are navigating right now.
The regional comparison is equally sobering. UOB’s net interest margin narrowed to 1.82% from 2.05%, representing a 23 basis point decline that exceeds what many regional peers experienced. Hong Kong banks, facing similar rate dynamics, have generally maintained margins in the 1.6%-1.9% range, suggesting Singapore banks entered this downturn from a higher baseline—meaning they had further to fall.
Yet there’s a crucial silver lining buried in the data. DBS economists expect 3-month Singapore Overnight Rate Average (SORA) to rebound from lows of 1.13% in early December 2025 to hold at approximately 1.25% through 2026. This stabilization suggests the worst of the margin compression may be behind us, even if margins don’t recover to 2024 peaks.

Fee Income Revolution: The S$4.8 Billion Question Reshaping Singapore Banking
While net interest income declines, an extraordinary wealth management boom is reshaping Singapore’s banking landscape—and the numbers are staggering.
DBS’s wealth management assets under management rose 12% year-on-year in the first half of 2025, while wealth income grew 8% year-on-year. Meanwhile, OCBC recorded an 11% year-on-year increase in wealth management AUM, with wealth income up 4% year-on-year. Even UOB, dealing with integration challenges from its Citibank acquisition, posted respectable gains.
By Q3 2025, the momentum accelerated dramatically. Assets under management grew 18% year-over-year for both DBS and OCBC, while UOB recorded an 8% increase. To put these figures in perspective: DBS alone added approximately S$21 billion in net new money in 2024, lifting total AUM to S$426 billion.
What’s driving this wealth influx? Singapore’s transformation into Asia’s premier wealth management hub isn’t accidental—it’s structural. The city-state now hosts 1,650 single-family offices as of 2025, nearly double the count from two years earlier. Each of these family offices represents not just wealthy individuals parking capital, but sophisticated financial entities requiring comprehensive banking services: treasury management, foreign exchange hedging, multi-currency accounts, and bespoke lending arrangements.
The fee composition tells an even more interesting story. Wealth management income isn’t just investment management fees—it encompasses a sophisticated menu of services. DBS, for instance, generates wealth fees from discretionary portfolio management (where the bank makes investment decisions on behalf of clients), advisory services, custody fees, transaction commissions on securities trades, foreign exchange markups, and insurance product distribution through its bancassurance partnerships.
Fee income showed strong 20% year-over-year growth to S$1.58 billion for DBS in Q3 2025, driven primarily by wealth management fee income. OCBC’s performance was equally impressive, with 15% year-over-year growth in non-interest income to S$1.57 billion, driven particularly by net fees and commissions in wealth management.
The mathematics of fee income versus net interest income deserves scrutiny. While fee income is growing at double-digit rates, it starts from a much smaller base than net interest income. For DBS, total fee income of approximately S$6 billion annually still represents roughly one-third of total net interest income. This means even a 20% surge in fees can only partially offset a 5-8% decline in NII.
But here’s what makes the fee story genuinely transformational: quality of earnings. Net interest income is inherently cyclical, tied to central bank policies and economic cycles beyond any individual bank’s control. Fee income, particularly from wealth management, is stickier. Once a bank captures a wealthy family’s business—establishing trust, demonstrating competence, and embedding itself in the family’s financial infrastructure—that relationship tends to persist across interest rate cycles.
The sustainability question looms large, however. Can wealth inflows continue at this pace? Two factors suggest yes. First, geopolitical instability in Hong Kong continues to drive capital southward. Second, ESG-related investments in Singapore have surged to SGD 45 billion by 2025, doubling in just two years, creating entirely new fee pools as banks develop and distribute sustainable investment products.
Loan Growth: The Comeback That Almost Wasn’t
For most of 2023 and early 2024, loan growth was Singapore banks’ Achilles heel. High interest rates discouraged borrowing, corporate treasurers prioritized paying down debt, and property market cooling measures kept mortgage growth subdued.
The turnaround, while modest, is real. Overall loans to non-bank customers grew by 4.7% year-over-year as of August 2025, compared to 3.8% in Q2, driven by higher corporate loans to residents and increased lending to the Americas.
Breaking down the loan book reveals where growth is materializing. Singapore bank loans increased to SGD 853.3 billion in June 2025 from SGD 844.6 billion in May 2025, driven by higher loans to businesses. Within the business sector, particularly strong growth appeared in building and construction (up to SGD 178.8 billion), general commerce (SGD 88 billion), and financial and insurance activities.
Consumer lending tells a more nuanced story. Housing and bridging loans increased to SGD 237.2 billion in June 2025 from SGD 235.7 billion in May, representing growth but at a glacial pace given Singapore’s perpetually hot property market. This reflects the ongoing impact of property cooling measures—higher stamp duties, tighter loan-to-value ratios, and total debt servicing ratio frameworks that limit how much Singaporeans can borrow relative to their income.
The 2026 outlook for loan growth requires parsing bank-specific guidance and macroeconomic realities. UOB expects low single-digit loan growth, which translates to roughly 2-3% expansion. OCBC projects mid-single-digit loan growth (approximately 4-5%), while DBS, despite its optimistic tone, faces mathematical challenges in maintaining growth from the largest loan book base among the three.
Corporate lending opportunities exist but come with important caveats. Singapore’s GDP growth is projected at 1-3% for 2026, significantly below the 4.4% achieved in 2024. This slower growth naturally constrains business expansion and, by extension, credit demand. However, credit demand should stay healthy in the immediate term as business sentiment improves amid some reduction in uncertainty.
Trade finance represents another bright spot. Singapore’s position as ASEAN’s financial hub means it captures a disproportionate share of regional trade financing. As ASEAN economies continue their 5-6% growth trajectories—faster than developed markets—Singapore banks benefit from financing intra-regional commerce, even when Singapore’s own domestic economy grows more slowly.
The property market deserves special attention because it represents such a large portion of consumer loan books. While mortgage rates are likely to continue easing, potentially offering some relief to homeowners or those looking to enter the property market, banks are simultaneously becoming more cautious. Banks will be scrutinizing loan applications more carefully, particularly for investment properties or in sectors they perceive as higher risk.
This creates an interesting dynamic: borrowing costs are falling, which should stimulate demand, but credit standards are tightening, which constrains supply. The net effect will likely be modest loan growth—positive but underwhelming—that contributes to but doesn’t transform the earnings picture.
The Analyst Verdict: Flattish Profits, Spectacular Dividends
Wall Street and regional investment banks have coalesced around a remarkably consistent view of Singapore banks’ 2026 prospects: profits will plateau or decline slightly, but shareholder returns remain compelling.
DBS is forecast to post a dividend yield of 6.1% in FY2026, while OCBC and UOB are each expected to offer yields of about 5.4%. These yields sit well above Singapore’s 10-year government bond yield (approximately 2.8%) and comfortably exceed fixed deposit rates offered by the same banks (ranging from 2.5-3.2% for 12-month placements).
The earnings forecasts themselves paint a picture of stability rather than excitement. DBS, the sector bellwether, faces expectations of approximately 2% earnings growth—essentially flat in real terms after accounting for inflation. The net profit may ease slightly from 2025 peaks, while total income stays stable.
What underpins these dividend forecasts isn’t just current profitability but capital strength. All three banks maintain Common Equity Tier 1 (CET1) ratios exceeding 15%, which sits comfortably 5 percentage points above Monetary Authority of Singapore requirements. This excess capital provides multiple strategic options: higher dividends, share buybacks, or capital-return programs.
Dividend yields of up to 6% and excess capital continue to be strong tailwinds for the sector, with potential for general provisions writeback and excess capital on the cards (exempting UOB). The mention of general provisions writeback is significant. During 2020-2021, banks dramatically increased loan loss provisions anticipating COVID-related defaults that ultimately materialized less severely than feared. As these precautionary provisions prove unnecessary, banks can release them back into earnings, providing a one-time boost to reported profits.
The investment case increasingly hinges on total shareholder return (capital appreciation plus dividends) rather than earnings growth alone. At current valuations, DBS trades at the highest price-to-earnings and price-to-book ratios among the three banks, with the lowest dividend yield, reflecting its premium positioning and superior return on equity of 17.1%.
Regional comparisons provide useful context. Hong Kong banks trade at similar valuation multiples but face greater uncertainty from China’s property market struggles and geopolitical tensions. Australian banks offer comparable dividend yields but operate in a more mature, slower-growth market. Singapore banks occupy a sweet spot: developed-market stability with emerging-market wealth accumulation dynamics.
One crucial risk factor that analysts flag consistently is asset quality, particularly concerning exposure to Greater China property markets. UOB faced sharply higher allowances for credit and other losses, working through refinancing stress in parts of its real estate exposure. While systemic risk appears contained—Singapore banks’ direct exposure to distressed Chinese developers remains limited—any deterioration would quickly undermine the benign credit cost assumptions underpinning 2026 forecasts.
Strategic Crossroads: How Banks Are Adapting Beyond 2026
The banks’ strategic responses to margin pressure reveal dramatically different philosophies about the future of banking in Asia.
DBS has doubled down on digital transformation and regional expansion. The bank’s wealth management success stems partly from technology investments that allow relationship managers to serve more clients more efficiently. Its digital platforms process over $1 billion in daily transaction volumes, generating fee income from every foreign exchange conversion, cross-border payment, and securities trade.
OCBC’s strategy centers on insurance integration and what it calls the “multi-pillar” approach. OCBC Bank’s performance highlights the critical role of diversification in insulating total income, allowing net profit to remain virtually unchanged year-over-year. Through Great Eastern, its insurance subsidiary, OCBC cross-sells life insurance and investment-linked products to banking customers, generating commissions that appear in non-interest income but originate from the banking relationship.
UOB faces the most complex strategic challenge: integrating the Citibank consumer businesses it acquired across Thailand, Malaysia, Vietnam, and Indonesia. The synergy extraction phase from the integration of Citi Malaysia, Thailand, Indonesia, and Vietnam is proving more challenging than initially anticipated. However, UOB aims to accelerate Southeast Asia expansion, targeting 30% of revenue from the region in 2026, while keeping Singapore’s revenue share at 50%.
The technology arms race deserves particular attention. All three banks are investing heavily in artificial intelligence for credit underwriting, fraud detection, and customer service. DBS processes loan applications that once took three days in under 30 minutes using machine learning models that assess creditworthiness across hundreds of data points. These efficiency gains directly impact the cost-to-income ratio—a critical metric as revenue growth slows.
Regulatory environment shifts could also reshape the competitive landscape. The Monetary Authority of Singapore continues refining frameworks around digital banks, cryptocurrency, and family office regulation. Any tightening of wealth management regulations could slow the very fee income growth that banks are counting on to offset margin compression.
The 2026 Investment Case: Income Over Growth
For investors weighing Singapore bank stocks as 2026 approaches, the thesis has fundamentally shifted from a growth story to an income story.
The bull case rests on three pillars. First, Singapore equity valuations remain attractive, with the yield gap against T-bills tracking above historical averages. Second, dividend sustainability looks rock-solid given excess capital buffers. Third, the worst of net interest margin compression has likely passed, meaning earnings should stabilize rather than continue deteriorating.
The bear case centers on limited upside. With analysts forecasting essentially flat earnings growth, capital appreciation depends on multiple expansion—investors paying more for the same earnings—which seems unlikely in a higher-interest-rate world where bonds offer decent yields. Additionally, any negative surprises on asset quality, particularly from China exposure or Singapore property market weakening, could quickly undermine the defensive narrative.
For income-focused investors, particularly retirees or those building dividend portfolios, Singapore banks offer rare combination of yield, quality, and liquidity. The 5.4-6.1% dividend yields exceed what most developed-market banks offer, while Singapore’s regulatory framework and banks’ capital strength provide safety that emerging market banks cannot match.
The technical picture matters too. The sector is expected to see continued fund inflows, supported by a second round of Equity Market Development Programme fund deployment extending into early 2026. This government-driven initiative channels sovereign wealth into Singapore equities, providing steady bid support that can dampen volatility and support valuations.
Conclusion: Excellence Amid Moderation
Singapore’s banking sector enters 2026 not in crisis but in transition. The extraordinary profitability of 2023-2024, driven by interest rate tailwinds that won’t repeat, is giving way to a more nuanced revenue model where fee income and modest loan growth must compensate for narrowing margins.
Analysts foresee wealth management momentum continuing, creating compensatory fees in place of declines in net interest income. Whether this compensation proves complete or partial will determine whether 2026 earnings merely flatline or actually contract.
For DBS, OCBC, and UOB, the test isn’t survival—their balance sheets and market positions ensure that—but rather whether they can demonstrate the strategic agility to thrive in a lower-margin environment. Early evidence suggests they can, but the journey from record profits to sustainable, diversified excellence requires execution discipline that few banks globally have consistently demonstrated.
Investors should approach Singapore banks with realistic expectations: high dividend yields and defensive characteristics, but limited capital appreciation until either interest rates rise again or fee income growth accelerates beyond current trajectories. That’s not a condemnation—it’s simply the reality of mature, well-capitalized banks operating in a moderating economic environment.
The Singapore banking story for 2026 isn’t about explosive growth. It’s about quality income, prudent capital management, and the slow transformation of business models to match a changing economic reality. For investors seeking stable returns in uncertain times, that might be exactly what they need.
What’s your take on Singapore banks’ strategic pivot? Can fee income models sustainably replace net interest income dominance, or are we witnessing temporary compensation for cyclical margin pressure? Share your perspective in the comments below.
Discover more from The Economy
Subscribe to get the latest posts sent to your email.



New Federal Reserve Chairman Kevin Warsh held rates steady at 3.50–3.75% at his first FOMC meeting, but signalled rate hikes are possible as inflation hits a three-year high. What this means for markets, mortgages, and the economy.
Key Takeaways
- The Fed unanimously held rates at 3.50–3.75% at Warsh’s first FOMC meeting on June 17–18, 2026
- Nine of 18 committee members now project a rate hike by year-end — a complete reversal from earlier in 2026
- Warsh declined to submit his own dot-plot projection and announced five task forces to reform Fed communications
- U.S. inflation hit 4.2% annually in May, driven primarily by energy prices linked to the Iran conflict
- Markets now price a 49% probability of a September rate hike, up from 27% the day before the meeting
A New Sheriff at the Fed
The Federal Reserve’s June 2026 meeting was always going to be historic. It was the first chaired by Kevin Warsh, confirmed by the Senate on May 13, 2026, and sworn in on May 22 — arriving at the Fed’s helm at arguably the most fraught monetary moment since the post-pandemic inflation surge of 2021–2023 (CBS News, June 2026).
What the market got was a meeting that held no surprises on rates — the FOMC voted 12-0 to keep the benchmark federal funds rate anchored at 3.50%–3.75% — but delivered a seismic shift in tone, communications philosophy, and forward guidance that sent stocks lower, bond yields sharply higher, and traders scrambling to reprice the rate path for the rest of 2026 (Fox Business, June 17, 2026).
What the Dot Plot Revealed
The June Summary of Economic Projections told the real story. The dot plot — which charts individual FOMC members’ rate expectations — showed that all but one participating policymaker believe interest rates will remain where they are or increase by end-2026 (Chase / J.P. Morgan Wealth Management, June 2026). That is a dramatic reversal from March, when the average committee member was projecting at least one rate cut in 2026.
Nine of the 18 voting members specifically indicated a rate hike is needed before year-end, with six of those projecting two 25-basis-point hikes (Fox Business). The committee now sees PCE inflation at 3.6% at year’s end — up from its March projection of 2.7% — and revised GDP growth modestly lower to 2.2%, with unemployment expected at 4.3% (CNBC, June 17, 2026).
Most significantly, there was one dot missing from the chart: Warsh’s own. In an unusually direct signal, the new chairman confirmed at his post-meeting press conference that he had declined to submit a personal rate forecast. “I did not submit a dot for me,” he said. “It’s not helpful in the conduct of policy.” He announced plans for a broad review of Fed communications, including press conferences, dot plots, meeting transcripts, and minutes — signalling a potentially fundamental overhaul of how the world’s most powerful central bank speaks to markets (CNBC).
Why Inflation Has Derailed the Cuts Narrative
The backdrop to Warsh’s debut is an inflation picture dramatically worse than expected at the start of the year. The Consumer Price Index rose 4.2% year-on-year in May — the highest reading since April 2023 — driven almost entirely by the energy price shock that followed the U.S.-Israel military strikes on Iran in late February 2026 (CBS News).
West Texas Intermediate crude futures spiked from approximately $57 per barrel at the start of 2026 to a peak of $113 in April before recently retreating toward $76 as ceasefire talks progressed (U.S. Bank Asset Management, June 2026). The Core PCE Price Index — the Fed’s preferred inflation gauge, which strips out volatile food and energy — remains more contained at 2.9%, offering policymakers some political cover for patience. But headline inflation above 4% is politically toxic and difficult to explain to American households facing elevated energy bills (NPR, June 17, 2026).
Warsh has argued publicly that supply-shock inflation — the kind driven by a geopolitical disruption rather than excess demand — should generally be looked through when formulating monetary policy. That view has its academic supporters. But it becomes harder to defend when a resilient labour market complicates the argument for accommodation: U.S. employers added 172,000 jobs in May, and the unemployment rate has held at 4.3% for a full year (CNBC). A tight labour market alongside 4.2% headline inflation gives hawks ample ammunition.
A Shorter Statement, a Different Philosophy
The most visible immediate change under Warsh was the Fed’s policy statement itself. The June release was dramatically shorter than past statements — stripped of the forward-guidance language that has characterised Powell-era communications and replaced with a simple, declarative commitment: “This committee will deliver price stability.” (Fox Business).
That brevity is a philosophy, not just an aesthetic choice. Warsh has long been a critic of elaborate forward guidance, arguing that explicit rate-path signalling constrains the Fed’s flexibility and can create self-fulfilling market dynamics that complicate, rather than clarify, policy transmission. By stripping the statement down to its essentials and declining to offer his own dot, Warsh is deliberately reintroducing uncertainty into the forward rate path — a radical departure from the communication frameworks that defined the Bernanke, Yellen, and Powell eras (U.S. Bank).
Whether this enhances credibility or simply increases volatility remains to be seen. But the market’s reaction was unambiguous: the Dow fell 507 points (0.98%), the S&P 500 dropped 1.21%, and the Nasdaq Composite declined 1.34% (CNN Business, June 17, 2026). Two-year Treasury yields — the most sensitive market instrument to near-term Fed expectations — jumped 16 basis points to 4.21%, their highest level in over a year. Traders moved quickly to reprice September: the probability of a hike rose from 27% the day before to 49% immediately after the press conference (CNN Business).
The Warsh-Trump Dynamic
President Trump nominated Warsh with an expectation, made clear in public statements, that the new chairman would push for lower interest rates. That calculation has been upended by the Iran war’s inflationary consequences. Warsh faces a structurally awkward position: the president who elevated him wants cheap money; the data he is sworn to follow is demanding the opposite (NPR).
Warsh has vowed publicly that the Fed will remain “strictly independent” in overseeing monetary policy. His June meeting — where he followed through on that pledge despite obvious political headwinds — represents his first credibility test. The five task forces he announced to review Fed operations signal a reformist agenda that could eventually reshape the institution’s structure, independence framework, and public communications in ways that markets have not yet fully priced (CNBC).
Notably, former Chairman Jerome Powell — whose term as chairman expired in May — has elected to remain on the Fed’s governing board for a period, promising to keep a low profile (NPR). His presence provides institutional continuity during a transition period, but also ensures that any significant policy shift by Warsh will be evaluated against a living, present benchmark.
Implications for Borrowers and Investors
The June meeting’s hawkish signal has direct consequences for borrowers, particularly in the housing market. Mortgage rates, which track long-term Treasury yields rather than the Fed’s overnight rate directly, are unlikely to retreat materially in the near future (CNN Business). The combination of elevated inflation, a possible September hike, and rising 2-year yields keeps refinancing incentives weak and new purchase affordability constrained.
For bond investors, the Fed’s revised dot plot means the yield curve steepening trade — which assumed cuts arriving in H2 2026 — is effectively dead for now. The CME FedWatch gauge, ahead of the June meeting, was already pricing no cuts in 2026 and a quarter-point hike by year-end (CNBC). Post-meeting, that baseline has only strengthened.
For equity investors, the picture is more nuanced. Higher-for-longer rates are traditionally a headwind for growth stocks and long-duration assets. But U.S. Bank’s asset management team notes that consumer spending and corporate earnings growth remain resilient, supported by lower corporate and individual taxes and recent tariff rebates — factors that could cushion the earnings impact of tighter monetary conditions (U.S. Bank).
What to Watch Next
The key variable is energy prices. If the U.S.-Iran peace framework holds — and Brent crude continues its retreat from $113 toward the mid-$70s — the inflation impulse could fade naturally, reducing the case for a September hike and giving Warsh room to stay on hold through year-end. If the Hormuz situation deteriorates again, the inflationary pressure resumes, and the hawks on the committee who projected two hikes will find their forecast validated.
Beyond the rate path, Warsh’s five task forces represent the real long-term story. Reviews spanning monetary policy operations, communications, data sources, productivity, and labour markets suggest a chairman who intends to leave a structural mark on the institution — not merely a cyclical one. The outcomes of those reviews, expected by year-end, could reshape how the Fed operates for the next decade.
Discover more from The Economy
Subscribe to get the latest posts sent to your email.

South Korea’s central bank is keeping a close watch on the labor market after major semiconductor companies handed out substantial bonuses to chip workers, a development that risks adding to domestic inflationary pressure even as the country’s export-driven chip sector rides a wave of strong global demand. CNBC reported on the dynamic this week as part of its broader coverage of how the AI-driven chip boom is rippling through Asian economies.
A Sector Riding High
South Korea’s semiconductor industry, anchored by giants such as Samsung Electronics and SK Hynix, has been a major beneficiary of the global AI infrastructure buildout, with surging demand for memory chips and advanced logic components used in data centers worldwide. That strength has translated into outsized profitability — and, in turn, generous compensation for employees, with large bonus payouts highlighted by CNBC as a notable feature of this earnings cycle.
Why It Matters for Inflation
While strong corporate performance and rising worker pay might typically be welcomed, South Korea’s central bank is treating the trend as a potential inflation risk. Higher wages in a key export sector can flow through to broader consumer spending and wage expectations across the economy, complicating the central bank’s efforts to manage price stability — particularly at a moment when many of the region’s monetary authorities are already navigating elevated energy costs tied to the Iran conflict.
Part of a Broader Asian Monetary Policy Story
The South Korean situation fits into a wider pattern across Asia-Pacific central banks, several of which have been managing monetary policy amid a combination of energy cost pressures and rising AI-related capital and labor costs. Bank Indonesia’s recent rate hike cycle reflects similar concerns about imported inflation, while regional central banks broadly are weighing how to balance support for booming technology export sectors against the risk of overheating domestic price pressures.
What to Watch Next
Investors and policymakers will be watching whether the South Korean central bank moves to tighten policy further in response to wage-driven inflation risk, or whether it opts to look through the bonus-related pay bump as a one-off event tied to an unusually strong earnings cycle in the chip sector. The decision carries implications not just for South Korea’s currency and bond markets, but for how other Asian economies riding the AI supercycle calibrate their own policy responses to similar wage and profit windfalls.
Discover more from The Economy
Subscribe to get the latest posts sent to your email.
Analysis
Easing Iran Tensions Push Mortgage Rates Lower — But a Potential Fed Hike Clouds the Outlook

Mortgage rates have eased in recent days as tensions around the US-Iran conflict appeared to de-escalate, offering a modest reprieve for homebuyers and refinancers. But that relief is now being tempered by growing uncertainty over whether the Federal Reserve could move to raise rates, according to CNN Business.
A Brief Window of Relief
CNN Business reported that the pullback in geopolitical tension helped push mortgage rates lower, a welcome development for a housing market that has struggled with affordability pressures. Lower borrowing costs are particularly significant given how much home-equity activity has picked up: CNBC reported that homeowners tapped $47 billion in equity in the first quarter alone, underscoring how sensitive household finances remain to shifts in interest rates.
The Fed Wildcard
The relief, however, may prove short-lived. With inflation rising for a second straight month — driven largely by gasoline prices tied to the Iran conflict, according to ABC News — markets are increasingly weighing the possibility that the Federal Reserve, now under new leadership, could move to raise rates rather than cut them. CNN Business described markets as still “learning the rules” of the Fed’s new chair, adding a layer of unpredictability to the rate outlook that directly affects mortgage pricing.
Why It Matters for Borrowers
Mortgage rates are influenced by a combination of Fed policy expectations and broader bond market dynamics, both of which have been unusually volatile this week as investors weigh competing signals from the Iran conflict, inflation data, and “Fedspeak,” per CNBC’s market commentary. For prospective homebuyers, this means the recent dip in rates could prove temporary if the inflation trend tied to elevated gas prices persists into next month’s data — which CNBC noted has taken on heightened importance for markets trying to anticipate the Fed’s next move.
A Cautionary Note for the Housing Market
The interplay between geopolitical risk, inflation, and Fed policy leaves the housing market in an unusually uncertain position. While lower rates in the near term could spur a modest pickup in home-buying activity, any reversal — whether from renewed Hormuz tensions or a hawkish Fed surprise — could quickly erase those gains, leaving borrowers facing the same affordability challenges that have defined the market for much of the past several years.
Discover more from The Economy
Subscribe to get the latest posts sent to your email.

Goldman Sachs: “The Circulatory System Is Not Working”

Why the U.S. Budget Airline Model Is Running Out of Runway

China’s Oil Shock Absorber: How Beijing Kept Crude Prices Half of What Analysts Predicted

CRH Nears Biggest-Ever Deal to Acquire Arcosa

U.S. Inflation at a Three-Year High: How the Iran War Turned an Economic Recovery Into a Stagflation Risk

IPO Summer 2026: Anthropic, OpenAI, and the Race to Price Artificial Intelligence on Public Markets

Strait of Hormuz Crisis 2026: How a Waterway War Broke Global Oil Markets

Kevin Warsh’s Fed Debut: Rate Hikes Now on the Table as U.S. Monetary Policy Enters a New Era

SpaceX IPO 2026: Inside the $85.7 Billion Listing That Made Elon Musk the World’s First Trillionaire

PSX KSE-100 Up 500+ Points: The Geopolitical Impact on Stocks

Did Anthropic Talk Its Way Into an AI Export Ban?

Big Bonuses for South Korea’s Chip Workers Put Central Bank on Inflation Alert

Easing Iran Tensions Push Mortgage Rates Lower — But a Potential Fed Hike Clouds the Outlook

Paramount’s $111 Billion Warner Bros. Discovery Merger Clears DOJ, But Faces New Hurdles

China Overhauls the World’s Biggest Surveillance Network with Advanced AI

SpaceX IPO: Inside the $2 Trillion Market Debut

KPMG Australia CEO Resigns After Whistleblower Claims Exposed Investigation Failures

PwC China Partner Payouts Cut Amid Evergrande Audit Fraud

Broadcom Market Value Loss: Revenue Forecast Disappoints

The Guardrails Are Down: How Meta and Google’s AI Models Fold Under Pressure

Pakistan Budget FY 2026-27: Relief, Prospects, and the Tightrope Walk

Benefitbay Raises $18M to Build the Plumbing for America’s ICHRA Shift

Here’s How Much It’ll Cost You to Be Part of SpaceX’s Record-Breaking $75 Billion IPO

Nasdaq Tumbles 4% as Chip and Memory Stocks Sink: A $1.2 Trillion Wipeout

Japanese Mid-Sized Firms Flock to Southeast Asia for Growth

Singapore Puts a Clock on Wealth: MAS Orders Banks to Halve Account-Opening Times

Investors Pile Into Bullish Dollar Bets as ‘US Exceptionalism’ Trade Returns

Can Exxon Build the World’s Biggest Carbon Capture Business?
-

 Markets & Finance6 months ago
Top 15 Stocks for Investment in 2026 in PSX: Your Complete Guide to Pakistan’s Best Investment Opportunities
-

 Analysis4 months ago
Top 10 Stocks for Investment in PSX for Quick Returns in 2026
-

 Analysis5 months ago
Brazil’s Rare Earth Race: US, EU, and China Compete for Critical Minerals as Tensions Rise
-

 Analysis4 months ago
Johor’s Investment Boom: The Hidden Costs Behind Malaysia’s Most Ambitious Economic Surge
-

 Banks5 months ago
Best Investments in Pakistan 2026: Top 10 Low-Price Shares and Long-Term Picks for the PSX
-

 Investment5 months ago
Top 10 Mutual Fund Managers in Pakistan for Investment in 2026: A Comprehensive Guide for Optimal Returns
-

 Global Economy6 months ago
15 Most Lucrative Sectors for Investment in Pakistan: A 2025 Data-Driven Analysis
-

 Global Economy6 months ago
Pakistan’s Export Goldmine: 10 Game-Changing Markets Where Pakistani Businesses Are Winning Big in 2025