
China Economy
China’s 5% Growth Target: The Calculated Pivot From Speed to Substance
How Beijing’s quality-over-quantity doctrine signals the most consequential restructuring of the world’s second-largest economy in a generation
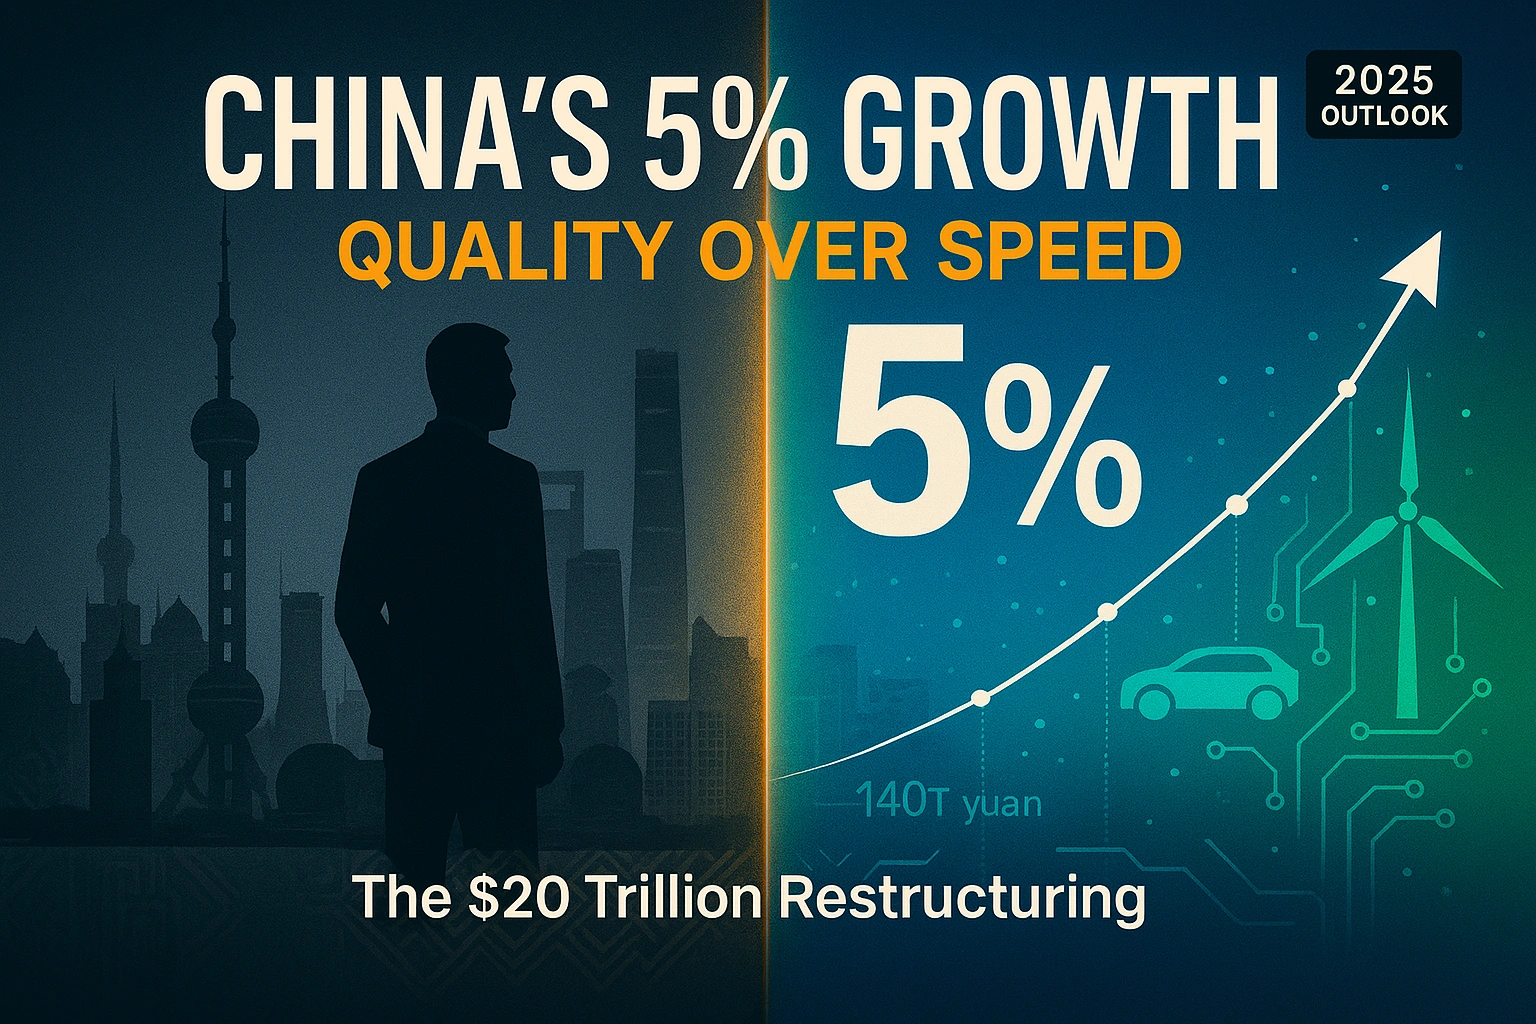
On the final day of 2025, as the world prepared to usher in a new year, President Xi Jinping announced China’s economy would reach its growth target of around 5% for 2025, reaching approximately 140 trillion yuan ($20 trillion) in total economic output. The declaration came not with triumphant fanfare but with measured emphasis on what Xi called China’s economy moving forward “under pressure…showing strong resilience and vitality.”
That qualifier—”under pressure”—reveals everything about where China stands at this inflection point.
For the first time in four decades, Beijing is publicly embracing a growth model that prizes quality over velocity. Xi emphasized the country will promote “effective qualitative improvement and reasonable quantitative growth”, a carefully calibrated phrase that marks China’s most significant economic pivot since Deng Xiaoping’s market reforms. The shift arrives as manufacturing data validates Xi’s confidence while exposing the economy’s underlying fragility.
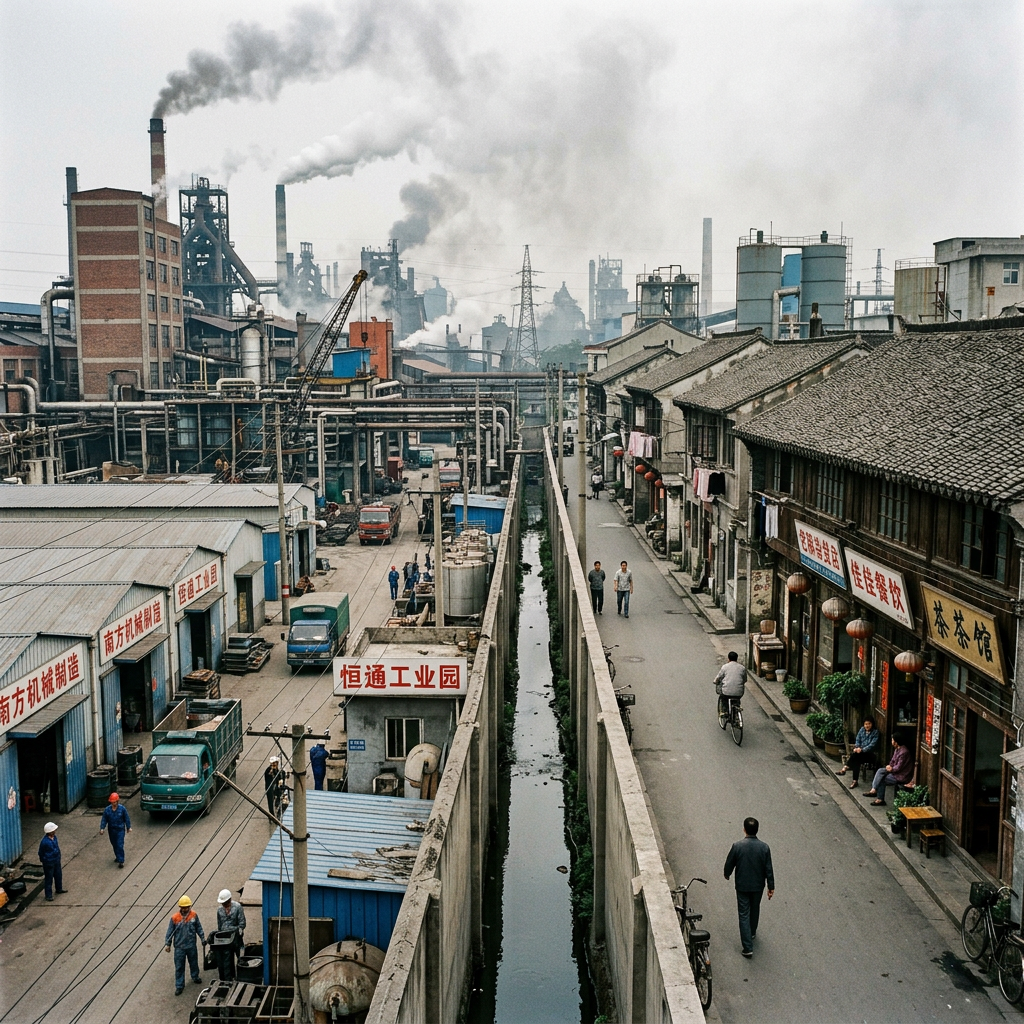
December’s official manufacturing PMI reached 50.1, crossing the expansion threshold and beating forecasts, while factory activity expanded for the first time in nine months. Yet beneath these green shoots lies an economy wrestling with property sector paralysis, deflationary pressures, and youth unemployment approaching crisis proportions. This is the paradox of modern China: achieving its growth targets while simultaneously engineering its most fundamental structural transformation since opening to global markets.
The Numbers Behind the Narrative
In the first three quarters of 2025, China’s GDP reached 101.5 trillion yuan, expanding by 5.2% year-on-year. The trajectory appeared solid until momentum faltered in Q3, when growth decelerated to 4.8%, revealing the economy’s dependence on external demand.
Exports’ contribution to GDP growth hit its highest level since 1997, producing a record trade surplus of nearly $1 trillion. This export surge, driven by manufacturers front-loading shipments ahead of anticipated tariffs and trade tensions, provided the crucial buffer that enabled Beijing to declare victory on its growth target. But export-led growth contradicts Xi’s stated ambition of consumption-driven development.
The International Monetary Fund, in its December 2025 Article IV consultation, upgraded China’s growth projections to 5.0% for 2025 and 4.5% for 2026, revisions of 0.2 and 0.3 percentage points respectively from October forecasts. The World Bank followed suit, estimating 4.9% growth in 2025 and projecting 4.4% in 2026. Both institutions cited recent fiscal stimulus and lower-than-expected tariffs as catalysts, but their projections also acknowledged persistent structural drags.
China’s GDP exceeded 130 trillion yuan in 2024, marking continued expansion despite headwinds. Yet this aggregate figure obscures critical sectoral divergence. Manufacturing GDP reached 33.55 trillion yuan ($4.67 trillion) in 2024, representing approximately 24.86% of total GDP, while the service industry’s share rose to 56.7% in 2024. This gradual rebalancing toward services aligns with Beijing’s quality-growth doctrine, though the pace remains insufficient to offset manufacturing sector pressures.
The inflation picture reveals deeper troubles. Headline inflation averaged 0% in 2025 and is projected to reach only 0.8% in 2026, indicating persistent deflationary pressures that undermine corporate profitability and consumer confidence. The share of zombie firms—companies whose operating earnings cannot cover interest expenses—rose from 5% in 2018 to 16% in 2024, with the real estate sector particularly afflicted at 40% zombie share.
The Property Sector: Beijing’s $5 Trillion Problem
No force has constrained China’s economic trajectory more than the real estate crisis that began in 2020 when regulators implemented the “Three Red Lines” policy to curb excessive developer debt. The sector that once contributed up to 30% of GDP and served as the primary wealth accumulation vehicle for Chinese households now represents Beijing’s most intractable challenge.
Investment in real estate development for the first ten months of 2025 declined by 14.7%, with sales of new homes projecting a decrease of 8% for the full year, marking the fifth consecutive year of negative growth. Housing prices continued their relentless descent, with new and secondhand home prices falling at an accelerated pace in 2024.
The human toll appears in stark relief. Evergrande, once the world’s most indebted property developer, was ordered liquidated in January 2024 owing more than $300 billion. China Vanke reported a record 49.5 billion yuan ($6.8 billion) annual loss for 2024, becoming the first state-backed developer to signal debt restructuring needs. Country Garden reported a net loss of 12.8 billion yuan for the first half of 2024, with revenue plummeting 55% year-over-year.
The contagion extends beyond developers. Land sale revenue, which made up 24% of total local government income in 2022, dropped by 23% that year. China’s total debt exceeded 300% of GDP as of June 2025, with local government financing vehicles holding estimated debt at 46% of GDP in 2023. The IMF estimates resolving property-sector distortions could require resources equivalent to around 5% of GDP over several years, underscoring this is a medium-term structural adjustment, not a cyclical correction.
Beijing’s response has been measured but increasingly assertive. In May 2024, authorities reduced minimum down payment ratios to 15% for first homes and 25% for second homes, while the one-year loan prime rate stood at 3.0% and five-year at 3.5%, down 1.25 percentage points from 2019 peaks. Yet these monetary interventions cannot offset the fundamental problem: excess supply meeting cratering demand in an economy where household debt surged from less than 20% of GDP in 2008 to more than 60% by 2023.
The property crisis reveals Beijing’s shifting priorities. Rather than engineering a full-scale rescue that would perpetuate moral hazard and misallocated capital, authorities are accepting short-term pain for long-term rebalancing. The latest household income data showed housing-related expenditure declining to 21.6% from 22.2% in 2024, while China accumulated a historical high of 160 trillion yuan in total household savings by May 2025. This represents both a problem—weak consumption—and an opportunity: a pool of capital available for redirection if confidence can be restored.
The Youth Employment Crisis: Counting What Can’t Be Hidden
Few statistics have proven as politically sensitive as youth unemployment. After the rate hit a record 21.3% in June 2023, authorities suspended publication for six months, later resuming with a revised methodology excluding students. Even with this adjustment, youth unemployment for ages 16-24 stood at 17.3% in October 2025, while the 25-29 age bracket reached 7.2%.
Conservative estimates suggest at least 20 million urban Chinese youth aged 15-29 are out of work, representing just over 12% of that demographic excluding students. The true figure likely exceeds this, as official methodology counts anyone working even one hour per week as employed and excludes those not actively seeking work.
The timing could not be worse. China’s 2025 graduating class numbered 12.22 million, the largest in history, entering a labor market disrupted by AI automation, manufacturing overcapacity, and service sector weakness. By 2022, the average age of a Chinese worker reached 40, creating generational tensions as younger workers struggle to find footholds while the economy relies on an aging workforce with diminishing productivity.
The social implications extend beyond statistics. Young Chinese increasingly embrace “lying flat” (tangping) and “letting it rot” (bai lan)—movements rejecting hustle culture and intense competition. Migration patterns shift as Chengdu recorded a 71,000 increase in residents in 2024, the only Chinese megacity to grow, as youth flee expensive first-tier cities for lower-cost alternatives. More alarmingly, the number of Chinese citizens seeking political asylum overseas climbed to 120,000 in 2023, a twelvefold increase since the Hu Jintao era.
Beijing recognizes youth unemployment threatens social stability—the Party’s paramount concern. Yet the structural causes—manufacturing overcapacity, property sector stagnation, and service sector underperformance—resist quick fixes. Throughout 2024, 12.56 million new jobs were created in urban areas, but these positions increasingly consist of precarious gig economy work rather than stable employment offering paths to middle-class prosperity.
The Electric Vehicle Triumph: China’s Industrial Policy Vindication
If property represents Beijing’s greatest vulnerability, electric vehicles exemplify its strategic success. One in nearly every two cars sold in China in 2024 was an electric vehicle, a penetration rate unmatched globally and achieved through coordinated industrial policy, massive subsidies, and protected domestic markets.
BYD Auto delivered 4.27 million vehicles in 2024, capturing 34.1% market share, overtaking Tesla as the world’s largest EV manufacturer. The company’s vertical integration—manufacturing both vehicles and batteries—provides cost advantages and supply chain control that legacy automakers cannot match. China’s EV exports exceeded 1.25 million vehicles in 2024, flooding markets from Brazil to Thailand and triggering protectionist responses in Europe and North America.
The numbers reveal China’s dominance. In 2024, over 85% of new electric cars sold in Brazil came from China, while Chinese imports accounted for 85% of EV sales in Thailand. Chinese EV exports to Mexico skyrocketed over 2,000% in November 2025 as BYD aggressively expanded. China shipped 5.5 million vehicles in 2024, making it the world’s largest auto exporter, with projections exceeding 7 million by end of 2025.
This export surge partly reflects overcapacity at home. Despite selling around 4.3 million vehicles, BYD leads multiple rounds of price cuts in a discounting war that started in early 2023. The brutal domestic competition—with dozens of manufacturers vying for market share—forces weaker players to exit while strengthening survivors through Darwinian selection.
Beijing’s EV strategy demonstrates several critical advantages. First, technological leapfrogging: China bypassed internal combustion engine expertise to lead in battery technology, with CATL controlling 37.9% of the global EV battery market. Second, coordinated policy: subsidies, charging infrastructure investment, and purchase incentives created demand while restrictions on traditional vehicles accelerated transition. Third, scale economies: China’s massive domestic market enabled manufacturers to achieve cost structures unreachable by foreign competitors.
The geopolitical implications are profound. Chinese automakers are projected to capture 30% of global car sales by 2030, up from 21% in 2024. BYD commissioned the world’s largest roll-on/roll-off vessel in 2025, bringing total shipping capacity to more than 30,000 electric cars, while establishing manufacturing facilities in Brazil, Thailand, and Turkey to circumvent tariffs. This represents not merely exports but comprehensive industrial ecosystem replication globally.
Western responses—100% US tariffs, up to 45% EU tariffs—slow but don’t halt Chinese expansion. Despite tariffs, over 600,000 Chinese EVs entered Europe in the first eleven months of 2025. Manufacturers absorb costs through efficiency gains and premium positioning, or establish local production to sidestep barriers entirely. The EV sector validates Xi’s insistence that state-directed industrial policy, when executed with sufficient capital and coordination, can create commanding positions in strategic industries.
Quality Growth: Translating Rhetoric Into Reality
Xi’s quality-growth doctrine rests on three pillars: technological advancement, green development, and shared prosperity. Each confronts formidable obstacles.
Technological self-sufficiency remains paramount given US-China technology decoupling. Production of 3D printing devices, industrial robots, and new energy vehicles grew by 40.5%, 29.8%, and 29.7% year-on-year respectively in the first three quarters of 2025. China leads in AI applications, 5G deployment, and renewable energy capacity. Yet semiconductor independence—critical for technological sovereignty—remains elusive despite massive investment, as advanced chip manufacturing requires equipment and expertise concentrated in the US, Netherlands, Japan, and Taiwan.
Green development shows tangible progress. China dominates solar panel manufacturing, wind turbine production, and battery technology. China contributed around 30% of global manufacturing added value in 2024, maintaining its position as the world’s largest manufacturing powerhouse for 15 consecutive years. Yet this manufacturing prowess comes with environmental costs that conflict with carbon neutrality pledges. The contradiction between export-led growth driven by energy-intensive manufacturing and climate commitments requires reconciliation.
Common prosperity—reducing inequality while maintaining growth—presents perhaps the greatest challenge. Real wage growth lags productivity gains, urban-rural disparities persist, and the gig economy proliferates without adequate social protections. Low inflation relative to trading partners led to real exchange rate depreciation, contributing to strong exports but exacerbating external imbalances, with the current account surplus projected to reach 3.3% of GDP in 2025. This imbalance reflects weak domestic consumption, the inverse of consumption-led growth.
The IMF articulates the central tension clearly: China’s large economic size and heightened global trade tensions make reliance on exports less viable for sustaining robust growth. Yet pivoting to domestic consumption requires reforms Beijing has resisted: strengthening social safety nets, improving pension systems, reducing healthcare costs, and allowing yuan appreciation. Each measure would boost consumer confidence and spending power but requires fiscal expenditure or policy adjustments that conflict with other priorities.
The Path Forward: Navigating Contradictions
The central government allocated 62.5 billion yuan from special treasury bonds to local governments for the consumer goods trade-in scheme for 2026, while the state planner released early investment plans involving about 295 billion yuan in central budget funding. These measures represent incremental support rather than transformative intervention.
Three scenarios emerge for China’s trajectory through 2026 and beyond:
Base case: Growth decelerates to the 4.5% range as export momentum fades, property adjusts gradually, and consumption improvements remain modest. This scenario reflects institutional consensus—the IMF, World Bank, and major investment banks cluster around similar projections. Deflationary pressures persist, youth unemployment improves marginally, and structural imbalances narrow slowly. China remains globally significant but growth normalizes closer to potential output given demographic constraints and capital saturation.
Upside case: Beijing implements more aggressive fiscal stimulus—beyond the incremental measures announced—focusing on direct household transfers, accelerated pension reform, and consumption subsidies. Export competitiveness in EVs and advanced manufacturing offsets property weakness. Technological breakthroughs in semiconductors reduce foreign dependencies. Growth stabilizes around 5% through 2026-2027 with improving internal balance. This requires policy choices Beijing has historically resisted but growing external pressures could force adaptation.
Downside case: Property crisis deepens, triggering financial system stress and consumption collapse. Trade tensions escalate beyond current assumptions, shrinking export markets. Youth unemployment breeds social instability, forcing authorities to prioritize security over growth. Growth falls to 3-4% range, deflationary spiral intensifies, and “middle-income trap” concerns materialize. This scenario remains possible but looks less probable given authorities’ demonstrated willingness to support growth and financial system stability.
The most likely outcome falls between base and upside cases. Xi has consolidated sufficient authority to implement difficult reforms if convinced they’re necessary. The 15th Five-Year Plan (2026-2030) provides framework for consumption emphasis, though implementation determines outcomes. External pressures—Western tariffs, geopolitical tensions, technology restrictions—paradoxically may accelerate internal reforms by reducing export-dependency viability.
What Investors and Policymakers Should Watch
Several indicators will signal China’s trajectory:
Property stabilization: Monitor new home sales volume and pricing trends in first-tier cities. Stabilization there precedes broader recovery, but sustained improvement requires at least four consecutive quarters of positive data.
Consumption metrics: Retail sales year-over-year growth, service sector PMI, and household savings rate. Household savings reached 160 trillion yuan by May 2025—mobilizing even a fraction toward consumption significantly boosts growth.
Youth unemployment: The political sensitivity indicates this metric matters for stability. Sustained improvement below 15% for 16-24 age group would signal labor market health, while deterioration above 20% risks social instability.
Manufacturing profit margins: Industrial enterprise profits were up only 0.9% year-on-year in the first eight months of 2025. Margin improvement indicates pricing power recovery and demand strengthening; continued compression suggests overcapacity persists.
Yuan valuation: Real effective exchange rate movements reveal whether authorities prioritize export competitiveness or consumption rebalancing. Appreciation signals confidence in domestic demand; depreciation indicates continued export reliance.
Fiscal stance: Central government deficit size and composition matter. Direct household transfers and consumption subsidies signal genuine rebalancing intent; infrastructure investment and manufacturing subsidies indicate path dependency.
The December PMI uptick and export resilience enabled Xi’s confident 5% achievement declaration. But whether China masters the transition from speed to substance—from investment-driven to consumption-led, from quantity to quality—remains the defining economic question of this decade. Beijing has the resources and policy tools for success. What’s uncertain is whether political economy constraints allow their deployment before external pressures force less optimal adjustments.
For global markets, China’s rebalancing represents both opportunity and threat. A consumption-driven Chinese economy offers expanded markets for services, luxury goods, and consumer brands. But the transition period—characterized by volatile growth, sectoral disruption, and policy experimentation—creates uncertainty that challenges long-term capital allocation.
The world’s second-largest economy is attempting something unprecedented: engineering a fundamental growth model shift while maintaining social stability, geopolitical strength, and technological advancement. Xi’s 5% target achievement provides political validation, but the harder work of structural transformation extends far beyond 2025. Whether China emerges as a balanced, sustainable major economy or stumbles into the middle-income trap will shape global economic geography for the coming generation.
Statistical Sources: National Bureau of Statistics of China, International Monetary Fund, World Bank, China Passenger Car Association, Trading Economics, MERICS, Bloomberg, PwC China Economic Quarterly
Discover more from The Economy
Subscribe to get the latest posts sent to your email.


China Economy
China’s Growth Slips to a Four-Year Low: Why Beijing Still Won’t Pull the Stimulus Trigger

Introduction
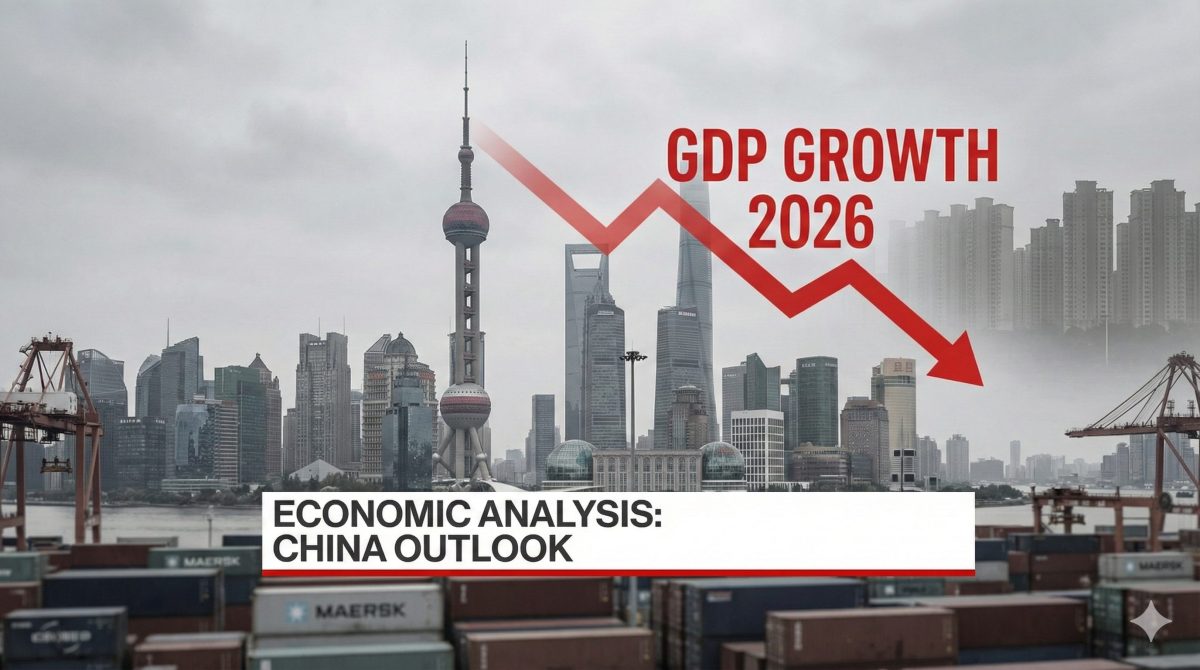
China’s economy expanded just 4.3% in the second quarter of 2026, the weakest quarterly pace since late 2022, missing economists’ 4.5% consensus forecast and slowing sharply from 5% growth in the first quarter (CNBC). The reading came in below Beijing’s own full-year target range of 4.5% to 5% — already the least ambitious growth goal China has set in decades — and has intensified calls for fresh stimulus even as policymakers show little appetite for aggressive intervention (CNBC).
What’s Actually Slowing
The slowdown is being driven by an accelerating slide in investment and stubbornly subdued consumption, even as exports have remained comparatively resilient — helped, paradoxically, by a global oil shock that boosted demand for Chinese goods in some categories even as it squeezed household budgets in others (WHBL/Reuters). Reuters’ polling of analysts projects growth will edge up slightly to 4.6% in the third quarter before easing to 4.5% in the fourth, putting full-year 2026 growth at roughly 4.6%, down from 5.0% in 2025 and expected to slow further to 4.4% in 2027 (WHBL/Reuters).
Notably, one bright spot within the investment slump is technology: surging tech-related imports point to a deepening domestic AI infrastructure buildout, with autos and consumer electronics adding further momentum even as broader fixed-asset investment weakens (CNBC).
The Deflation Problem Beijing Can’t Shake
Underlying the growth numbers is a more persistent structural issue: China’s producer prices have now fallen for roughly three years running, undercutting corporate profitability and discouraging the kind of household spending that would normally pull the economy out of a slowdown (FXStreet). When prices fail to rise, consumers have less incentive to spend “today,” a dynamic that suppresses GDP and forces the central bank to actively target positive inflation rather than simply react to it (FXStreet). Analysts at FxPro describe China as a continued “net exporter of deflation” to the rest of the world — as its own overcapacity pushes discounted goods into global markets, applying disinflationary pressure well beyond its borders (FXStreet).
Why Beijing Is Holding Back on Stimulus
Despite the weak headline numbers, most analysts expect no aggressive stimulus action from the late-July Politburo meeting unless growth deteriorates more sharply. The reasoning is twofold: exports have remained resilient, and policymakers remain more focused on curbing excess factory capacity to fight deflation than on further juicing demand, which risks worsening the overcapacity problem that is driving deflation in the first place (WHBL/Reuters).
That said, fiscal policy is expected to accelerate through the second half of the year. Beijing has set a budget deficit of around 4% of GDP for 2026 and lined up heavy government bond issuance specifically to shore up growth after early-year support was front-loaded and then faded (WHBL/Reuters). Capital Economics expects growth to pick up over the second half as this fiscal support ramps up, while cautioning that domestic overcapacity will remain entrenched — meaning China’s economy stays structurally reliant on exports for growth rather than a genuine consumption rebound (WHBL/Reuters). Analysts polled by Reuters expect the People’s Bank of China to hold its key seven-day reverse repo rate unchanged for the remainder of 2026, signaling that Beijing sees this as a fiscal problem rather than a purely monetary one (WHBL/Reuters).
The Trade War Backdrop
The slowdown is unfolding against continued tensions with trade partners, including the United States, which have weighed on export growth even as it has held up better than domestic demand (CNBC). U.S. tariffs specifically are cited as a factor exacerbating China’s domestic deflationary trend by reducing demand for Chinese goods abroad, compounding the overcapacity problem at home (FXStreet). Analysts note that a meaningful reversal of China’s deflationary spiral would likely require either a Federal Reserve rate cut that eases global financial conditions, or a easing of the tariff regime directly — neither of which is fully within Beijing’s control (FXStreet).
What to Watch Next
- The late-July Politburo meeting: the clearest near-term signal of whether Beijing shifts from measured fiscal support to a more aggressive stimulus posture.
- Producer price index trends: continued multi-year declines would reinforce the deflation narrative and pressure corporate margins further.
- Bond issuance pace: heavy issuance against a 4%-of-GDP deficit target will be a key gauge of how quickly fiscal support actually reaches the real economy.
- U.S.-China trade signals: any easing of tariffs would provide more relief to Chinese exporters than domestic policy alone is currently offering.
Key Takeaways
- China’s Q2 2026 GDP growth of 4.3% was its weakest since late 2022, missing forecasts and falling below Beijing’s own full-year target range.
- Producer prices have declined for roughly three years, cementing China’s role as a net exporter of global deflation.
- Beijing is prioritizing capacity reduction over demand-side stimulus, betting that fiscal spending — not rate cuts — will carry the second-half recovery.
- Full-year 2026 growth is forecast at around 4.6%, cooling further to 4.4% in 2027 as structural export-reliance persists.
- A genuine reversal of China’s deflation trend likely depends on external factors — Fed policy or US tariff relief — as much as domestic stimulus.
Sources: CNBC, WHBL/Reuters, FXStreet
Discover more from The Economy
Subscribe to get the latest posts sent to your email.
China’s economy has just delivered its weakest quarterly result since the depths of the pandemic recovery, and the number that matters most isn’t the headline growth figure — it’s what Beijing does, or doesn’t do, about it.
The Numbers Behind the Miss
Gross domestic product expanded 4.3 percent in the April-to-June period, according to the National Bureau of Statistics, missing economists’ forecast of 4.5 percent and slowing sharply from 5 percent in the first quarter. Crucially, that print came in below Beijing’s own full-year target range of 4.5 to 5 percent — described by CNN as the least ambitious goal Beijing has set in decades — and represents a rare public admission of economic weakness for a government that has long leaned on infrastructure investment and exports to mask domestic softness.
An accelerating slide in fixed investment, alongside subdued consumption, is doing most of the damage. Reuters polling ahead of the release had already flagged that weak domestic demand was offsetting the boost from resilient exports during the global oil shock triggered by the Iran conflict.
The Export Paradox
Here is the twist most coverage has undersold: China’s exports haven’t collapsed — in some categories they’ve been the standout performer. Higher energy costs stemming from the war in Iran have actually helped pull China out of one of its longest deflationary stretches on record, as global buyers seeking to reduce fossil-fuel exposure have turned to Chinese batteries, electric vehicles and clean-energy technology.
Macquarie analysts found that chips, computer parts and power equipment accounted for roughly half of China’s export growth in the first half of 2026, underscoring how intertwined China’s growth engine has become with global AI infrastructure spending — even as its domestic property and consumption engines continue to sputter.
Will Beijing Blink on Stimulus?
All eyes now turn to the Politburo’s expected late-July meeting. The consensus among analysts is caution rather than a bazooka. Capital Economics expects growth to pick up in the second half as fiscal support ramps up, but warns that entrenched domestic overcapacity means China’s economy will remain structurally reliant on exports rather than consumption for growth. UOB economist Woei Chen Ho told CNN that a large-scale stimulus package appears unlikely, with selective, targeted measures instead more probable to stabilise investment and consumption.
Beijing has already set a budget deficit of roughly 4 percent of GDP for 2026 and lined up heavy bond issuance, with GDP growth forecast to edge up modestly to 4.6 percent in the third quarter before easing again in the fourth, according to Reuters’ economist poll.
Deflation Still the Deeper Problem
Even with the export-led relief, China’s deflationary pressure has not disappeared. Producer prices have now fallen for well over two years running, with July’s year-on-year decline running at roughly 3.6 percent even as consumer inflation hovers near zero. Analysts note this dynamic effectively exports deflation to trading partners already grappling with tariff-driven cost pressures — complicating monetary policy from Washington to Jakarta.
Why It Matters for Southeast Asia and the Gulf
China remains the dominant trading partner for much of Southeast Asia and a major source of imports for Pakistan. A structurally slower, export-dependent China means continued downward pressure on regional manufacturing prices, but also sustained demand for the commodities and components that feed its clean-energy export machine — a dynamic ASEAN economies from Malaysia to Indonesia are positioning to capture, as detailed in our companion coverage of the region’s investment inflows.
Discover more from The Economy
Subscribe to get the latest posts sent to your email.
China’s National Bureau of Statistics reported second-quarter GDP growth of 4.3%, missing analyst forecasts of 4.5% and falling below Beijing’s own 4.5–5% annual target — the lowest target range the country has set since it began publishing such figures in 1991 (CNN; NPR). It is the weakest quarterly print since the pandemic-disrupted final quarter of 2022, and it lands at the mid-point of a year already reshaped by the Iran war’s oil shock.
Two Economies, One Government
Economists including Natixis’s Alicia Garcia-Herrero describe an increasingly pronounced “two-track economy”: a thriving export engine — car exports topped one million units for the first time in June and semiconductor and computer-part shipments surged — running alongside a domestic consumption base still weighed down by a property slump and cautious households (CNN). Retail sales rose just 1% year-over-year in June, while fixed asset and property investment continued to contract, with property investment down roughly 18% (Reuters via WTAQ).
The Uncovered Angle: A Widening Surplus Meets a Fragile World
China’s trade surplus widened to $125.6 billion in June even as crude oil imports fell to near decade lows — evidence that Beijing is managing the Hormuz-driven energy shock better than most importers, while simultaneously exporting the industrial overcapacity problem to trading partners. That widening surplus is already straining relations with the European Union, and it has direct implications for manufacturing competitors across Southeast Asia and South Asia, including Pakistan’s textile and Malaysia’s electronics sectors, which now compete more directly with subsidised Chinese EV, battery and solar exports flooding third markets (CNN; IndexBox).
What Happens Next: The Politburo’s July Decision
Convera’s APAC strategist Shier Lee Lim frames the miss as strengthening the case for additional stimulus at the July Politburo meeting, potentially through faster special local government bond issuance or new policy financing tools rather than a formal budget revision (WTAQ). The IMF has already nudged its 2026 China growth forecast up slightly to 4.6%, while projecting a further slowdown to 4.1% in 2027 as the AI and robotics-led export boom fails to translate into broad-based job creation (IndexBox).
Why Cross-Border Investors Should Care
For Pakistan, whose CPEC-linked trade and infrastructure financing remains closely tied to Chinese capital flows, and for Malaysia and Singapore, whose electronics and semiconductor sectors sit downstream of Chinese supply chains, the composition of any Beijing stimulus matters more than the headline growth number. A consumption-focused package would support Southeast Asian consumer and tourism exports; an infrastructure-heavy package would deepen the commodity and industrial-goods relationship that already dominates trade with Indonesia and Malaysia.
The Bottom Line
China’s growth model is becoming structurally unbalanced in a way that a single quarter of stimulus cannot fix. Cornell economist Eswar Prasad’s assessment — that heavy state and private investment in frontier technology is running well ahead of job-creating sectors — points to a slow-burn risk for global trade partners that goes well beyond this quarter’s data print (IndexBox).
Discover more from The Economy
Subscribe to get the latest posts sent to your email.

Pakistan Gulf Investment Outflows 2026: Peace Deal Stakes Explained

Canada Trade Diversification 2026: China, Indonesia, UAE Deals Explained

US Forced-Labour Tariffs on 60 Countries: The Hidden Trade Shock of 2026

Global Central Banks 2026: Fed, BoE and BoJ Decisions Could Reshape Markets

Gulf Capital Retreat From Pakistan 2026: UAE Loan Freeze & What It Means

Pakistan’s Most Reliable Export Is Its People: Remittances Hit $41.6 Billion, Overtaking Total Exports

Indonesia’s Confidence Problem: Record Investment, a Sinking Rupiah, and a Widening Credibility Gap

Down But Not Out: Inside the Slow Sinking of Russia’s War Economy

China’s Growth Slips to a Four-Year Low: Why Beijing Still Won’t Pull the Stimulus Trigger

The Johor-Singapore Corridor: How Malaysia Became Southeast Asia’s AI Infrastructure Powerhouse

Canada’s Economy ‘On Pause’: Inside the CUSMA Deadline That Passed Without a Deal

Dubai’s Millionaire Magnet: How the UAE Turned Middle East Turmoil Into a Capital Safe-Haven Boom

Britain’s Sixth Prime Minister in a Decade: What Starmer’s Exit Means for Gilts, Sterling and Your Portfolio

Anthropic Offers Up to $600,000 Salary for Critical IPO Role as AI Giant Prepares for Wall Street Debut

Carry Trade Unwind 2026: How the Yen’s Snapback Triggered a Global Margin Call

AI Bubble Warning 2026: Why BIS, IMF and Bank of England Fear a Market Crash

BRICS De‑Dollarization Strategy Takes Shape with $15 Billion Local‑Currency Push

The AI Super Bubble Is Ready to Burst

Russia Bans Diesel Exports 2026: Global Fuel Market Impact Explained

Strait of Hormuz Blockade 2026: Oil Prices Surge 9% as US-Iran Conflict Reignites

Private Credit Warning: Most BDCs Turn Unprofitable in 2026, Reuters Finds

IMF Cuts Pakistan Growth Forecast, Raises Inflation to 8.4%

Bitcoin $150k Milestone Achieved as US Sovereign Crypto Pivot Looms
Gulf Capital Retreat From Pakistan 2026: UAE Loan Freeze & What It Means

India Economic Rise 2026: How the Subcontinent Toppled Japan

Strait of Hormuz 2026: Why Markets Still Don’t Trust It’s Open

China Housing Market Turnaround: White‑List Model Stabilises Prices

Chipmakers Just Lost 6.7% in Two Days: Inside the Great AI Trade Rotation
-

 Markets & Finance7 months ago
Top 15 Stocks for Investment in 2026 in PSX: Your Complete Guide to Pakistan’s Best Investment Opportunities
-

 Analysis5 months ago
Johor’s Investment Boom: The Hidden Costs Behind Malaysia’s Most Ambitious Economic Surge
-

 Analysis5 months ago
Top 10 Stocks for Investment in PSX for Quick Returns in 2026
-

 Analysis6 months ago
Brazil’s Rare Earth Race: US, EU, and China Compete for Critical Minerals as Tensions Rise
-

 Banks6 months ago
Best Investments in Pakistan 2026: Top 10 Low-Price Shares and Long-Term Picks for the PSX
-

 Investment7 months ago
Top 10 Mutual Fund Managers in Pakistan for Investment in 2026: A Comprehensive Guide for Optimal Returns
-

 Global Economy7 months ago
15 Most Lucrative Sectors for Investment in Pakistan: A 2025 Data-Driven Analysis
-

 Global Economy7 months ago
Pakistan’s Export Goldmine: 10 Game-Changing Markets Where Pakistani Businesses Are Winning Big in 2025