
China Economy
China’s 5% Growth Target: The Calculated Pivot From Speed to Substance
How Beijing’s quality-over-quantity doctrine signals the most consequential restructuring of the world’s second-largest economy in a generation
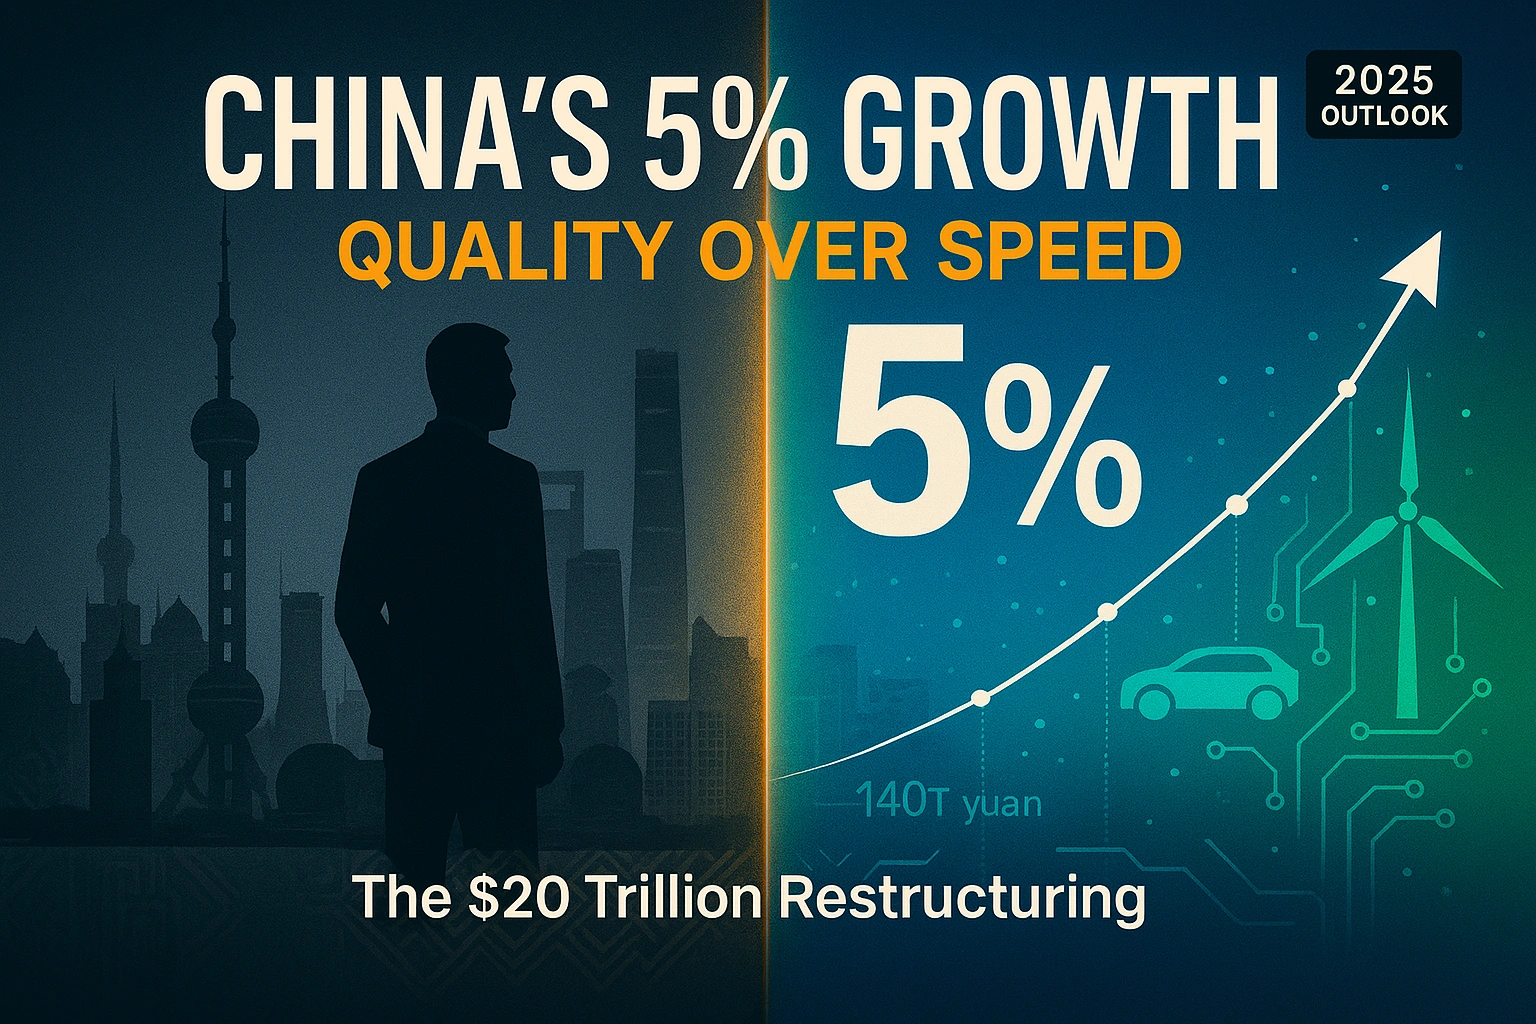
On the final day of 2025, as the world prepared to usher in a new year, President Xi Jinping announced China’s economy would reach its growth target of around 5% for 2025, reaching approximately 140 trillion yuan ($20 trillion) in total economic output. The declaration came not with triumphant fanfare but with measured emphasis on what Xi called China’s economy moving forward “under pressure…showing strong resilience and vitality.”
That qualifier—”under pressure”—reveals everything about where China stands at this inflection point.
For the first time in four decades, Beijing is publicly embracing a growth model that prizes quality over velocity. Xi emphasized the country will promote “effective qualitative improvement and reasonable quantitative growth”, a carefully calibrated phrase that marks China’s most significant economic pivot since Deng Xiaoping’s market reforms. The shift arrives as manufacturing data validates Xi’s confidence while exposing the economy’s underlying fragility.
December’s official manufacturing PMI reached 50.1, crossing the expansion threshold and beating forecasts, while factory activity expanded for the first time in nine months. Yet beneath these green shoots lies an economy wrestling with property sector paralysis, deflationary pressures, and youth unemployment approaching crisis proportions. This is the paradox of modern China: achieving its growth targets while simultaneously engineering its most fundamental structural transformation since opening to global markets.
The Numbers Behind the Narrative
In the first three quarters of 2025, China’s GDP reached 101.5 trillion yuan, expanding by 5.2% year-on-year. The trajectory appeared solid until momentum faltered in Q3, when growth decelerated to 4.8%, revealing the economy’s dependence on external demand.
Exports’ contribution to GDP growth hit its highest level since 1997, producing a record trade surplus of nearly $1 trillion. This export surge, driven by manufacturers front-loading shipments ahead of anticipated tariffs and trade tensions, provided the crucial buffer that enabled Beijing to declare victory on its growth target. But export-led growth contradicts Xi’s stated ambition of consumption-driven development.
The International Monetary Fund, in its December 2025 Article IV consultation, upgraded China’s growth projections to 5.0% for 2025 and 4.5% for 2026, revisions of 0.2 and 0.3 percentage points respectively from October forecasts. The World Bank followed suit, estimating 4.9% growth in 2025 and projecting 4.4% in 2026. Both institutions cited recent fiscal stimulus and lower-than-expected tariffs as catalysts, but their projections also acknowledged persistent structural drags.
China’s GDP exceeded 130 trillion yuan in 2024, marking continued expansion despite headwinds. Yet this aggregate figure obscures critical sectoral divergence. Manufacturing GDP reached 33.55 trillion yuan ($4.67 trillion) in 2024, representing approximately 24.86% of total GDP, while the service industry’s share rose to 56.7% in 2024. This gradual rebalancing toward services aligns with Beijing’s quality-growth doctrine, though the pace remains insufficient to offset manufacturing sector pressures.
The inflation picture reveals deeper troubles. Headline inflation averaged 0% in 2025 and is projected to reach only 0.8% in 2026, indicating persistent deflationary pressures that undermine corporate profitability and consumer confidence. The share of zombie firms—companies whose operating earnings cannot cover interest expenses—rose from 5% in 2018 to 16% in 2024, with the real estate sector particularly afflicted at 40% zombie share.
The Property Sector: Beijing’s $5 Trillion Problem
No force has constrained China’s economic trajectory more than the real estate crisis that began in 2020 when regulators implemented the “Three Red Lines” policy to curb excessive developer debt. The sector that once contributed up to 30% of GDP and served as the primary wealth accumulation vehicle for Chinese households now represents Beijing’s most intractable challenge.
Investment in real estate development for the first ten months of 2025 declined by 14.7%, with sales of new homes projecting a decrease of 8% for the full year, marking the fifth consecutive year of negative growth. Housing prices continued their relentless descent, with new and secondhand home prices falling at an accelerated pace in 2024.
The human toll appears in stark relief. Evergrande, once the world’s most indebted property developer, was ordered liquidated in January 2024 owing more than $300 billion. China Vanke reported a record 49.5 billion yuan ($6.8 billion) annual loss for 2024, becoming the first state-backed developer to signal debt restructuring needs. Country Garden reported a net loss of 12.8 billion yuan for the first half of 2024, with revenue plummeting 55% year-over-year.
The contagion extends beyond developers. Land sale revenue, which made up 24% of total local government income in 2022, dropped by 23% that year. China’s total debt exceeded 300% of GDP as of June 2025, with local government financing vehicles holding estimated debt at 46% of GDP in 2023. The IMF estimates resolving property-sector distortions could require resources equivalent to around 5% of GDP over several years, underscoring this is a medium-term structural adjustment, not a cyclical correction.
Beijing’s response has been measured but increasingly assertive. In May 2024, authorities reduced minimum down payment ratios to 15% for first homes and 25% for second homes, while the one-year loan prime rate stood at 3.0% and five-year at 3.5%, down 1.25 percentage points from 2019 peaks. Yet these monetary interventions cannot offset the fundamental problem: excess supply meeting cratering demand in an economy where household debt surged from less than 20% of GDP in 2008 to more than 60% by 2023.
The property crisis reveals Beijing’s shifting priorities. Rather than engineering a full-scale rescue that would perpetuate moral hazard and misallocated capital, authorities are accepting short-term pain for long-term rebalancing. The latest household income data showed housing-related expenditure declining to 21.6% from 22.2% in 2024, while China accumulated a historical high of 160 trillion yuan in total household savings by May 2025. This represents both a problem—weak consumption—and an opportunity: a pool of capital available for redirection if confidence can be restored.
The Youth Employment Crisis: Counting What Can’t Be Hidden
Few statistics have proven as politically sensitive as youth unemployment. After the rate hit a record 21.3% in June 2023, authorities suspended publication for six months, later resuming with a revised methodology excluding students. Even with this adjustment, youth unemployment for ages 16-24 stood at 17.3% in October 2025, while the 25-29 age bracket reached 7.2%.
Conservative estimates suggest at least 20 million urban Chinese youth aged 15-29 are out of work, representing just over 12% of that demographic excluding students. The true figure likely exceeds this, as official methodology counts anyone working even one hour per week as employed and excludes those not actively seeking work.
The timing could not be worse. China’s 2025 graduating class numbered 12.22 million, the largest in history, entering a labor market disrupted by AI automation, manufacturing overcapacity, and service sector weakness. By 2022, the average age of a Chinese worker reached 40, creating generational tensions as younger workers struggle to find footholds while the economy relies on an aging workforce with diminishing productivity.
The social implications extend beyond statistics. Young Chinese increasingly embrace “lying flat” (tangping) and “letting it rot” (bai lan)—movements rejecting hustle culture and intense competition. Migration patterns shift as Chengdu recorded a 71,000 increase in residents in 2024, the only Chinese megacity to grow, as youth flee expensive first-tier cities for lower-cost alternatives. More alarmingly, the number of Chinese citizens seeking political asylum overseas climbed to 120,000 in 2023, a twelvefold increase since the Hu Jintao era.
Beijing recognizes youth unemployment threatens social stability—the Party’s paramount concern. Yet the structural causes—manufacturing overcapacity, property sector stagnation, and service sector underperformance—resist quick fixes. Throughout 2024, 12.56 million new jobs were created in urban areas, but these positions increasingly consist of precarious gig economy work rather than stable employment offering paths to middle-class prosperity.
The Electric Vehicle Triumph: China’s Industrial Policy Vindication
If property represents Beijing’s greatest vulnerability, electric vehicles exemplify its strategic success. One in nearly every two cars sold in China in 2024 was an electric vehicle, a penetration rate unmatched globally and achieved through coordinated industrial policy, massive subsidies, and protected domestic markets.
BYD Auto delivered 4.27 million vehicles in 2024, capturing 34.1% market share, overtaking Tesla as the world’s largest EV manufacturer. The company’s vertical integration—manufacturing both vehicles and batteries—provides cost advantages and supply chain control that legacy automakers cannot match. China’s EV exports exceeded 1.25 million vehicles in 2024, flooding markets from Brazil to Thailand and triggering protectionist responses in Europe and North America.
The numbers reveal China’s dominance. In 2024, over 85% of new electric cars sold in Brazil came from China, while Chinese imports accounted for 85% of EV sales in Thailand. Chinese EV exports to Mexico skyrocketed over 2,000% in November 2025 as BYD aggressively expanded. China shipped 5.5 million vehicles in 2024, making it the world’s largest auto exporter, with projections exceeding 7 million by end of 2025.
This export surge partly reflects overcapacity at home. Despite selling around 4.3 million vehicles, BYD leads multiple rounds of price cuts in a discounting war that started in early 2023. The brutal domestic competition—with dozens of manufacturers vying for market share—forces weaker players to exit while strengthening survivors through Darwinian selection.
Beijing’s EV strategy demonstrates several critical advantages. First, technological leapfrogging: China bypassed internal combustion engine expertise to lead in battery technology, with CATL controlling 37.9% of the global EV battery market. Second, coordinated policy: subsidies, charging infrastructure investment, and purchase incentives created demand while restrictions on traditional vehicles accelerated transition. Third, scale economies: China’s massive domestic market enabled manufacturers to achieve cost structures unreachable by foreign competitors.
The geopolitical implications are profound. Chinese automakers are projected to capture 30% of global car sales by 2030, up from 21% in 2024. BYD commissioned the world’s largest roll-on/roll-off vessel in 2025, bringing total shipping capacity to more than 30,000 electric cars, while establishing manufacturing facilities in Brazil, Thailand, and Turkey to circumvent tariffs. This represents not merely exports but comprehensive industrial ecosystem replication globally.
Western responses—100% US tariffs, up to 45% EU tariffs—slow but don’t halt Chinese expansion. Despite tariffs, over 600,000 Chinese EVs entered Europe in the first eleven months of 2025. Manufacturers absorb costs through efficiency gains and premium positioning, or establish local production to sidestep barriers entirely. The EV sector validates Xi’s insistence that state-directed industrial policy, when executed with sufficient capital and coordination, can create commanding positions in strategic industries.
Quality Growth: Translating Rhetoric Into Reality
Xi’s quality-growth doctrine rests on three pillars: technological advancement, green development, and shared prosperity. Each confronts formidable obstacles.
Technological self-sufficiency remains paramount given US-China technology decoupling. Production of 3D printing devices, industrial robots, and new energy vehicles grew by 40.5%, 29.8%, and 29.7% year-on-year respectively in the first three quarters of 2025. China leads in AI applications, 5G deployment, and renewable energy capacity. Yet semiconductor independence—critical for technological sovereignty—remains elusive despite massive investment, as advanced chip manufacturing requires equipment and expertise concentrated in the US, Netherlands, Japan, and Taiwan.
Green development shows tangible progress. China dominates solar panel manufacturing, wind turbine production, and battery technology. China contributed around 30% of global manufacturing added value in 2024, maintaining its position as the world’s largest manufacturing powerhouse for 15 consecutive years. Yet this manufacturing prowess comes with environmental costs that conflict with carbon neutrality pledges. The contradiction between export-led growth driven by energy-intensive manufacturing and climate commitments requires reconciliation.
Common prosperity—reducing inequality while maintaining growth—presents perhaps the greatest challenge. Real wage growth lags productivity gains, urban-rural disparities persist, and the gig economy proliferates without adequate social protections. Low inflation relative to trading partners led to real exchange rate depreciation, contributing to strong exports but exacerbating external imbalances, with the current account surplus projected to reach 3.3% of GDP in 2025. This imbalance reflects weak domestic consumption, the inverse of consumption-led growth.
The IMF articulates the central tension clearly: China’s large economic size and heightened global trade tensions make reliance on exports less viable for sustaining robust growth. Yet pivoting to domestic consumption requires reforms Beijing has resisted: strengthening social safety nets, improving pension systems, reducing healthcare costs, and allowing yuan appreciation. Each measure would boost consumer confidence and spending power but requires fiscal expenditure or policy adjustments that conflict with other priorities.
The Path Forward: Navigating Contradictions
The central government allocated 62.5 billion yuan from special treasury bonds to local governments for the consumer goods trade-in scheme for 2026, while the state planner released early investment plans involving about 295 billion yuan in central budget funding. These measures represent incremental support rather than transformative intervention.
Three scenarios emerge for China’s trajectory through 2026 and beyond:
Base case: Growth decelerates to the 4.5% range as export momentum fades, property adjusts gradually, and consumption improvements remain modest. This scenario reflects institutional consensus—the IMF, World Bank, and major investment banks cluster around similar projections. Deflationary pressures persist, youth unemployment improves marginally, and structural imbalances narrow slowly. China remains globally significant but growth normalizes closer to potential output given demographic constraints and capital saturation.
Upside case: Beijing implements more aggressive fiscal stimulus—beyond the incremental measures announced—focusing on direct household transfers, accelerated pension reform, and consumption subsidies. Export competitiveness in EVs and advanced manufacturing offsets property weakness. Technological breakthroughs in semiconductors reduce foreign dependencies. Growth stabilizes around 5% through 2026-2027 with improving internal balance. This requires policy choices Beijing has historically resisted but growing external pressures could force adaptation.
Downside case: Property crisis deepens, triggering financial system stress and consumption collapse. Trade tensions escalate beyond current assumptions, shrinking export markets. Youth unemployment breeds social instability, forcing authorities to prioritize security over growth. Growth falls to 3-4% range, deflationary spiral intensifies, and “middle-income trap” concerns materialize. This scenario remains possible but looks less probable given authorities’ demonstrated willingness to support growth and financial system stability.
The most likely outcome falls between base and upside cases. Xi has consolidated sufficient authority to implement difficult reforms if convinced they’re necessary. The 15th Five-Year Plan (2026-2030) provides framework for consumption emphasis, though implementation determines outcomes. External pressures—Western tariffs, geopolitical tensions, technology restrictions—paradoxically may accelerate internal reforms by reducing export-dependency viability.
What Investors and Policymakers Should Watch
Several indicators will signal China’s trajectory:
Property stabilization: Monitor new home sales volume and pricing trends in first-tier cities. Stabilization there precedes broader recovery, but sustained improvement requires at least four consecutive quarters of positive data.
Consumption metrics: Retail sales year-over-year growth, service sector PMI, and household savings rate. Household savings reached 160 trillion yuan by May 2025—mobilizing even a fraction toward consumption significantly boosts growth.
Youth unemployment: The political sensitivity indicates this metric matters for stability. Sustained improvement below 15% for 16-24 age group would signal labor market health, while deterioration above 20% risks social instability.
Manufacturing profit margins: Industrial enterprise profits were up only 0.9% year-on-year in the first eight months of 2025. Margin improvement indicates pricing power recovery and demand strengthening; continued compression suggests overcapacity persists.
Yuan valuation: Real effective exchange rate movements reveal whether authorities prioritize export competitiveness or consumption rebalancing. Appreciation signals confidence in domestic demand; depreciation indicates continued export reliance.
Fiscal stance: Central government deficit size and composition matter. Direct household transfers and consumption subsidies signal genuine rebalancing intent; infrastructure investment and manufacturing subsidies indicate path dependency.
The December PMI uptick and export resilience enabled Xi’s confident 5% achievement declaration. But whether China masters the transition from speed to substance—from investment-driven to consumption-led, from quantity to quality—remains the defining economic question of this decade. Beijing has the resources and policy tools for success. What’s uncertain is whether political economy constraints allow their deployment before external pressures force less optimal adjustments.
For global markets, China’s rebalancing represents both opportunity and threat. A consumption-driven Chinese economy offers expanded markets for services, luxury goods, and consumer brands. But the transition period—characterized by volatile growth, sectoral disruption, and policy experimentation—creates uncertainty that challenges long-term capital allocation.
The world’s second-largest economy is attempting something unprecedented: engineering a fundamental growth model shift while maintaining social stability, geopolitical strength, and technological advancement. Xi’s 5% target achievement provides political validation, but the harder work of structural transformation extends far beyond 2025. Whether China emerges as a balanced, sustainable major economy or stumbles into the middle-income trap will shape global economic geography for the coming generation.
Statistical Sources: National Bureau of Statistics of China, International Monetary Fund, World Bank, China Passenger Car Association, Trading Economics, MERICS, Bloomberg, PwC China Economic Quarterly
Discover more from The Economy
Subscribe to get the latest posts sent to your email.


In a supermarket in Fuyang this past February, shoppers pushed carts past red lanterns and “Golden Horse Welcoming Spring” banners during China’s longest Lunar New Year holiday on record. Rail networks carried more than 18.7 million passengers in a single day, and Hainan’s duty-free counters rang up 30.8% more sales than a year earlier. For a few weeks, it looked like Beijing’s demand stimulus push might finally be taking hold. The relief didn’t last. By May, retail sales had fallen 0.6% year-on-year — the first monthly decline in more than three years. Xi Jinping has spent eighteen months promising to make households, not factories, the engine of Chinese growth. The data keep saying otherwise.
That gap between rhetoric and reality sits at the centre of China’s economic story heading into the first year of the 15th Five-Year Plan. For two decades, growth has leaned on investment and exports — a model the IMF’s chief economist, Pierre-Olivier Gourinchas, has said needs to “pivot to a more domestically-driven engine of growth.” The IMF now projects China’s GDP growth will slow to 4.5% in 2026, down from 5% in 2025, with private domestic demand described as lackluster even as headline inflation averaged zero percent last year. The World Bank reaches a similar conclusion: households kept funnelling savings into bank deposits through 2025 despite real interest rates that were flat or negative, while local government revenue stayed squeezed by a continued slide in land-lease income. Beijing has answered with trade-in subsidies, interest-rate cuts and a 48-measure consumption action plan. None of it has shifted the basic arithmetic: China still saves more, and spends less, than almost any economy its size.
China’s Demand Stimulus Keeps Hitting the Same Wall
The headline number from May was stark. China’s National Bureau of Statistics reported retail sales fell 0.6% year-on-year, the first such drop since December 2022, reversing April’s 0.2% gain and missing even the most pessimistic forecasts in a Reuters poll. Home appliance and audiovisual equipment sales plunged 15.6%; auto sales tumbled 16.1%, extending an eighth consecutive month of decline in the world’s largest car market. Only services kept the picture from looking worse: spending on catering, travel and entertainment grew 5.4%, outpacing goods retail by 4.2 percentage points, according to Caixin Global.
Beijing’s response was immediate but modest. The government injected a fresh 62.5 billion yuan ($9.2 billion) into the consumer trade-in scheme by the end of June, even as it quietly scaled the 2026 program back to 250 billion yuan from 300 billion yuan in 2025, narrowing eligibility to cars, appliances and smart glasses. Nine government departments also rolled out a joint action plan built around 48 separate measures, spanning:
- Subsidised dining and catering vouchers in lower-tier cities
- Expanded reimbursement for elder-care and healthcare services
- Relaxed visa rules to draw foreign tourist spending
- Additional tax-refund points at border crossings for inbound shoppers
It’s a familiar pattern. The Ministry of Commerce says the broader trade-in program has driven 4.16 trillion yuan in cumulative sales since launch — real money, by any measure. Yet the same dataset shows why the lift keeps fading: full-year 2025 retail sales growth came in at 3.7%, trailing industrial output’s 5.9% expansion and the economy’s overall 5% growth rate, Reuters reported. Growth bottomed at 0.9% year-on-year in December, recovered to 2.8% in early 2026, then slipped to 1.7% by March as the subsidy cycle turned, in the words of analysts at ING, “from a tailwind to a headwind.” Auto sales fell 9.1% in the first quarter even as China’s passenger-car exports jumped 60.6% — a sign that excess domestic production is increasingly finding buyers abroad rather than at home.
Monetary policy moved alongside the fiscal support. The People’s Bank of China entered 2026 promising a “moderately loose” stance and in January cut interest rates on several structural lending tools by 0.25 percentage points, lowering the one-year central bank lending facility rate from 1.5% to 1.25%. Governor Pan Gongsheng has signalled more is coming, telling Xinhua there is “still room for further RRR and interest rate cuts this year.” New refinancing tools are now earmarked specifically for services consumption and elder care — a quiet admission that goods subsidies alone weren’t going to do the job. Consumer prices briefly perked up too: CPI rose 1.3% year-on-year in February, the fastest pace in three years, before easing to 1.0% in March as core inflation slipped from 1.8% back to 1.1%. Producer prices, meanwhile, are still falling, extending a fourth straight year of factory-gate deflation.
There’s also a self-inflicted wound. Beijing’s “anti-involution” campaign, aimed at curbing cut-throat price wars among manufacturers of everything from solar panels to electric vehicles, is meant to fix a supply-side problem. But the IMF’s Article IV report warns that continued industrial-policy support for priority sectors risks perpetuating the very overcapacity it’s trying to cure, adding to deflationary pressure rather than easing it. Subsidise demand with one hand and subsidise supply with the other, and the price level barely moves.
Why China’s Household Savings Rate Won’t Budge
Subsidies treat a symptom. The disease is precautionary saving, and it’s structural rather than cyclical. A December 2025 IMF working paper by economists Yizhi Xu, Fan Zhang, Rongyu Cui and Ding Hua traces China’s stubbornly high household savings rate to three forces that reinforce one another: thin social spending in rural areas, the hukou household-registration system that denies many migrant workers full access to urban healthcare, schooling and pensions, and a property-market correction that has eroded the wealth of homeowners, who make up more than 90% of Chinese households.
Why Is China’s Domestic Demand Still Weak?
China’s domestic demand stays weak because three forces compound: a property slump that erased household wealth, thin social safety nets that force precautionary saving, and a hukou system denying migrant workers full urban benefits. Subsidies lift spending briefly, but they don’t fix why households save first.
The mechanics matter. The IMF researchers find that falling housing wealth pushes homeowners to save more, not less, as they try to rebuild lost equity — an effect that has held steady since the property correction began in 2021. More than 50 Chinese developers have defaulted since then; Country Garden, once the country’s largest, saw contracted sales fall by 70% to 6.91 billion yuan in a single December after an October debt default. What’s shifted is the other side of the ledger: would-be buyers, once forced to save aggressively for a down payment, are increasingly just postponing the purchase altogether amid uncertainty over future prices — which means the old “save to buy” motive is weakening even as the “save because I lost equity” motive intensifies.
Hukou reform has made real, if uneven, progress. Beijing has eased registration restrictions in dozens of cities since 2024, and the National Development and Reform Commission has continued chipping away at residency limits in smaller cities. But the IMF’s modelling suggests reform alone won’t be enough. Pair stronger social safety nets with hukou liberalisation and a smoother property-market transition, the paper argues, and Beijing could meaningfully cut precautionary saving. Pursue trade-in subsidies in isolation, and the savings rate barely moves — which is more or less what’s happened since 2024.
The Second-Order Costs of a Spending Gap That Won’t Close
The consequences extend well past China’s borders. With factory-gate prices still falling, manufacturers facing weak domestic orders are doing what they’ve always done: exporting the surplus. That’s part of why passenger-car exports surged even as domestic auto sales fell, and a similar pattern is playing out across solar panels, batteries and steel. Trading partners in Europe and Southeast Asia have noticed, and China’s trillion-dollar annual trade surplus keeps surfacing as a flashpoint in talks with Washington and Brussels alike.
Inside China, the strain shows up in local-government finances and in investment data that are now flashing red alongside consumption. Fixed-asset investment fell 4.1% in the first five months of 2026, and property investment extended its slide, dropping 16.2% over the same period — a sharper fall than January-April’s 13.7% decline, Reuters reported. NBS spokesperson Fu Linghui attributed part of the slowdown to extreme summer heat and heavy rain in some regions, along with the broader transition from old growth drivers to new ones. Land-lease revenue, once a primary funding source for cities, kept contracting through 2025, and the World Bank found consolidated fiscal revenue growth barely turned positive — just 0.2% year-on-year through October. That squeezes precisely the public services, healthcare, pensions, childcare subsidies, that economists say would do the most to unlock household spending in the first place.
Underneath the headline weakness, consumer behaviour is shifting in ways the subsidy programs weren’t built to capture. Chinese travellers are spending less overseas and more at home — a swing Bloomberg Intelligence estimates could redirect roughly $27 billion in outbound tourism spending back into the domestic market, while relaxed visa rules and a softer yuan are expected to draw in an additional $15 billion from inbound visitors. That’s a genuine bright spot, but it’s also a reminder of what’s actually growing: travel and experiences, not the durable-goods spending the trade-in subsidies were built to support.
Then there’s demography, which makes the 2026–2030 window unusually urgent. China’s population could shrink by close to 60 million people between 2026 and 2035, according to projections from the China-focused research firm Rhodium Group, as annual deaths climb toward 15 million a year while births keep falling — the ratio of new births to total population dropped to just 0.563% in 2025, down from 1.199% a decade earlier. Beijing’s 15th Five-Year Plan includes, for the first time, an entire chapter devoted to population policy. The retirement-age increase passed in 2024, to 63 for men and 58 for white-collar women, is expected to add roughly 0.2 percentage points to annual growth through 2030, the IMF estimates, but it does nothing to fix the underlying birth-rate collapse. For small and mid-sized exporters squeezed between soft domestic orders and rising trade friction, the math keeps getting harder, not easier.
Not Everyone Thinks the Strategy Is Failing
Not every economist reads the data this way. Standard Chartered’s Liao Wei points to China’s rising total factor productivity, climbing since 2021, as evidence the export engine can keep absorbing domestic slack without derailing growth, particularly as global appetite for AI-related hardware lifts demand for technology-intensive Chinese exports, she told China Daily. Tao Chuan, chief economist at Guolian Minsheng Securities, goes further, forecasting 2026 growth “no lower than 5%” and describing a shift toward what he calls an export-consumption equilibrium, in which subsidy-driven spending gradually gives way to sustainable services growth.
Beijing’s own assessment, delivered through the Central Economic Work Conference and echoed in Caixin’s opinion pages, holds that the economy’s fundamental trend remains positive and that 2025’s growth, officially 5%, in line with target, proves the model is working, just more slowly than critics would like.
That said, the gap between official confidence and independent estimates is wide enough to give pause. Rhodium Group’s analysts calculate that China’s real 2025 GDP growth likely landed between 2.5% and 3%, roughly half the 5.2% pace the National Bureau of Statistics reported through the first three quarters, with the biggest divergence concentrated in investment figures rather than consumption. If that estimate is closer to the mark, the resilience Beijing points to owes more to production and exports than to any genuine pickup in household spending. The picture is more complicated than either side’s headline number suggests.
A Pivot Beijing Can Postpone But Not Avoid
Strip away the subsidy cycles and the trade data, and the tension is simple: Xi Jinping wants Chinese households to spend like an advanced economy’s consumers while the state still taxes, spends and insures like a developing one. Trade-in vouchers can pull a few months of auto and appliance sales forward. They can’t replace a pension system, fix a broken property market, or convince a young professional in Chengdu that her job is secure enough to stop saving for the worst. The IMF’s own modelling suggests a serious reform package, stronger safety nets, faster hukou liberalisation, a real housing-market transition, could lift consumption’s share of GDP by roughly four percentage points over five years. That’s the size of the prize. It’s also the size of the political and fiscal commitment Beijing has so far avoided making. Until that changes, the trade-in subsidies will keep buying time rather than buying confidence, and the gap between Xi’s ambition and his households’ bank balances will keep showing up in the data, one weak month at a time.
Discover more from The Economy
Subscribe to get the latest posts sent to your email.

Zhou Wei, a 42-year-old software entrepreneur from Shenzhen, stood at the head of a queue snaking outside a retail bank branch in Hong Kong’s Central district. He wasn’t there to buy retail equities or shop for luxury goods. Instead, he carried a briefcase containing meticulous proof of a residential address in Guangdong, three years of tax receipts, and a business registration document. Zhou is part of a quiet, massive migration of private capital. As domestic economic anxieties deepen north of the border, thousands of affluent citizens are attempting to move their wealth into safer waters before the gate shuts permanently.
This capital movement occurs against a backdrop of historic structural shifts within the broader Chinese macroeconomy. Over the last two years, the domestic property market has failed to stabilize, wiping out nearly $5 trillion in household wealth across tier-one and tier-two cities. At the same time, the yuan has faced continuous downward pressure against the US dollar, making domestic, yuan-denominated assets increasingly unattractive to wealth-preservationists. According to a recent Bloomberg macro economic report, capital outflows from China reached a five-year high in the early months of 2026, driven by a profound lack of domestic investment alternatives. For decades, the property market served as the primary engine for middle-class wealth accumulation, but that engine has sputtered out. Consequently, private capital is aggressively seeking offshore alternatives. The nearest, most legally coherent refuge is Hong Kong, which operates under a separate legal system and maintains an unpegged, freely convertible currency linked directly to the greenback.
Demand for Hong Kong Bank Accounts for Mainland Residents
The sudden spike in demand for Hong Kong bank accounts for mainland residents marks a critical turning point in cross-border capital dynamics. Opening these accounts has transformed from a luxury convenience for high-net-worth individuals into a defensive necessity for the upper-middle class. Retail banks across Hong Kong, including major institutions like HSBC and Bank of China Hong Kong, have reported unprecedented volumes of account applications from mainland walk-in clients. To manage the influx, several branches have extended their operating hours to seven days a week, a phenomenon not seen since the pre-pandemic era. Data compiled by the Hong Kong Monetary Authority indicates that non-resident deposit growth grew by 14% in the first quarter of 2026 alone, a surge directly correlated with tightening domestic regulatory environments.
What drives this current rush is a pervasive fear that regulatory windows are closing fast. Mainland citizens face a strict statutory limit of $50,000 in foreign exchange per year. Yet, investors have long used various gray-market mechanisms—ranging from cross-border insurance policies to over-the-counter money changers—to move larger sums. A recent investigation by Reuters financial intelligence revealed that regulatory compliance teams in Shenzhen and Shanghai have begun auditing personal bank transfers that show patterns of consistent, small-scale cross-border movement. This heightened scrutiny has created a profound sense of urgency among mainland savers. They realize that holding an active, fully compliant offshore bank account is the most critical prerequisite for long-term wealth preservation. Without it, even if they manage to convert their currency, they have no secure venue to store it outside the reach of domestic capital controls.
Furthermore, the process of securing these accounts has become dramatically more arduous. Bankers now demand rigorous documentation regarding the source of funds, requiring applicants to prove that their money does not stem from unregistered corporate earnings or hidden property transactions. On June 2, 2026, regulatory guidelines in Hong Kong were quietly tightened to mandate deeper background checks on mainland applicants. This change has triggered a secondary industry of cross-border agencies charging up to $2,000 just to secure guaranteed appointment slots at retail bank branches. For investors like Zhou, this cost is a negligible premium to pay for an economic exit ramp.
The Analytical Layer: How Beijing Financial Regulation Crackdown Drives Capital Flight
Moving beyond the immediate daily news cycle reveals a deeper structural reality. This current capital migration is not a random market fluctuation; it’s a direct reaction to an aggressive Beijing financial regulation crackdown aimed at restructuring domestic private wealth. The central government has systematically closed loopholes that previously allowed private citizens to shield their earnings from state surveillance. From tighter oversight on local wealth management products to aggressive audits of high-earning tech executives, the state is prioritizing fiscal control over private market expansion.
Why are Chinese investors opening bank accounts in Hong Kong?
Chinese investors are opening bank accounts in Hong Kong to protect their wealth from domestic regulatory crackdowns and currency depreciation. By transferring assets to Hong Kong, mainland residents gain access to global investment instruments, US-dollar-pegged stability, and a legal system separate from Beijing’s direct capital controls.
This specific regulatory pressure explains why traditional asset classes within China are losing their appeal. When the state limits private corporate profits and forces state-backed interventions into private enterprises, capital naturally seeks environments governed by predictable common law. The picture is more complicated than a simple search for higher yields. In fact, many mainland depositors are willing to accept lower interest rates on their offshore deposits compared to domestic bonds, provided those offshore assets are denominated in foreign currency and held outside the immediate jurisdiction of mainland courts.
The structural tension is obvious. Beijing needs domestic capital to stay within its borders to fund its transition toward high-tech manufacturing and state-directed infrastructure. When private wealth flees into Hong Kong, it undermines this macro policy goal. Still, the unique administrative status of Hong Kong creates an ironic structural contradiction. The city is technically part of China, yet its financial system serves as the primary conduit for capital trying to escape mainland jurisdiction. This duality turns Hong Kong into both an essential economic asset for the country and a persistent systemic risk for central planners who demand absolute financial oversight. Consequently, every account opened acts as a tiny, cumulative vote of no confidence in the domestic regulatory trajectory, forcing a delicate balancing act between local branch managers and central party officials.
Strategic Shifts in Offshore Wealth Diversification
The downstream consequences of this capital flight are reshaping the financial landscape across Asia. As billions of yuan flow southward, the demand for sophisticated offshore wealth diversification products has outpaced traditional banking services. Hong Kong’s insurance sector has become an unexpected beneficiary, with mainland visitors purchasing dollar-denominated savings policies at a clip not seen in a decade. These insurance structures serve as highly effective wealth stores because they can be easily pledged as collateral for low-interest bank loans, effectively unlocking liquidity in a global currency.
This shift is forcing global asset managers based in the territory to reallocate their resources. Instead of pitch-decking speculative global equities to ultra-high-net-worth individuals, firms are designing conservative, fixed-income vehicles tailored for middle-class mainland depositors who prioritize safety over aggressive growth. According to data published by the Financial Times research unit, investment inflows into Hong Kong-domiciled mutual funds surged by $18 billion during the first four months of 2026, with over 60% of that capital originating from mainland retail investors.
What follows, however, is a direct challenge to Hong Kong’s domestic economy. While the banking sector is flush with liquidity, this capital is highly transactional. It sits in liquid deposits or short-term instruments rather than finding its way into local equities or real estate, both of which remain deeply depressed. The city’s banks are earning substantial fee income from account openings and wealth management consultations, yet they face rising compliance costs as they attempt to vet thousands of new accounts daily.
The long-term risk is that Hong Kong becomes a gilded parking lot for anxious capital—highly liquid, heavily monitored, and intensely vulnerable to sudden policy reversals from the central government in Beijing. If policymakers north of the border decide that the drain on domestic liquidity has crossed a critical threshold, they could halt the Hong Kong wealth management connect pathways overnight, stranding billions in mid-transit. This leaves institutions operating in a state of permanent contingency, knowing their current profitability depends entirely on a regulatory blind spot that could vanish with a single decree from Beijing.
The Counterargument: A Managed Valve for Capital Control
While mainstream analysis positions this asset migration as a chaotic breach in China’s financial defenses, a more rigorous counterargument suggests that Beijing is intentionally permitting this controlled capital movement. From a state planning perspective, a complete closure of all capital exit ramps could trigger severe domestic panic, collapsing consumer confidence and driving the underground banking system completely out of sight. By allowing a regulated, predictable volume of wealth to transition through official channels like the wealth connect schemes, the central government creates a necessary release valve for economic anxiety.
Furthermore, this movement serves an important geopolitical purpose for China’s long-term strategy. Capital that flows into Hong Kong remains technically within the wider financial orbit of the Chinese state, reinforcing the city’s position as an international financial center. If that capital were to flee entirely to Singapore, London, or New York, Beijing would lose all residual leverage over those assets. Analysts at the Institute of International Finance note that keeping wealthy citizens bound to a dollar-denominated hub under ultimate Chinese sovereignty is far preferable to watching that capital vanish into Western jurisdictions.
By maintaining strict outward controls but leaving the Hong Kong door slightly ajar, Beijing balances its domestic need for liquidity with its strategic requirement to maintain confidence among its corporate elite. This reality suggests that the current rush is not an outright defeat for regulators, but a calculated compromise where both the state and the investor accept a highly managed level of risk. Ultimately, a controlled leak within family bounds is far safer for the party than a structural explosion that shatters investor trust entirely.
The Balancing Act of Cross-Border Wealth
The modern race for financial security across the Taiwan Strait exposes a classic economic dilemma. Private capital always chases security and autonomy, while centralized states consistently prioritize control and collective stability. For mainland citizens who have spent the last two decades building substantial private estates, the current regulatory climate makes holding all their assets under a single domestic jurisdiction an unacceptable concentration of risk.
Hong Kong remains their indispensable bridge to the global financial system, providing a rare legal framework that respects private property while remaining geographically and culturally connected to the mainland. Yet, this bridge exists entirely at the pleasure of the sovereign authority in Beijing. As lines continue to form outside the glass towers of Central, every new account opened represents both a personal triumph of wealth preservation and a quiet testament to the enduring friction between private market desires and state-directed economic realities. The ultimate fate of these billions depends not on market mechanics, but on how long the state decides that this financial safety valve remains useful to its own survival.
Discover more from The Economy
Subscribe to get the latest posts sent to your email.
On a Wednesday morning in May 2026, a paper landed in the journal Nature that said more about China’s technological ambitions than almost any policy document released this year. Researchers from Peking University and Alibaba Group’s Damo Academy had fed 7.56 terabytes of satellite imagery through a deep-learning model and produced something that had never existed before: a complete national inventory of China’s renewable energy infrastructure, down to the individual turbine and rooftop panel. The algorithm identified 319,972 solar photovoltaic facilities and 91,609 wind turbines spread across a country the size of a continent. “This allows us to see the country’s new-energy landscape from a ‘God’s-eye view’,” said Liu Yu, a professor at Peking University’s School of Earth and Space Sciences. It was not a metaphor. It was a statement of operational intent.
Why the Timing Is No Accident
The Nature publication arrived against a backdrop that gives it unusual urgency. China’s electricity consumption from data centres — the physical infrastructure underpinning every AI model the country trains and deploys — rose 44 percent year-on-year in the first quarter of 2026, according to the China Academy of Information and Communications Technology. That is not a rounding error. It is a structural jolt to a national grid that the government is simultaneously trying to decarbonise.
The broader numbers are equally stark. Data centres in China posted a 38% compound annual growth rate over the past five years and are forecast to maintain a 19% CAGR through 2030, according to Rystad Energy, lifting their share of national electricity consumption from 1.2% today to roughly 2.3% by the end of the decade. The IEA projects that China’s data centre electricity consumption will rise by approximately 175 TWh — a 170% increase on 2024 levels — making it one of the two largest sources of data-centre demand growth globally, alongside the United States. Beijing has enshrined the sector as a strategic priority in the 2026–2030 Fifteenth Five-Year Plan.
The question the Peking University-Alibaba study implicitly answers is: how do you manage a grid of that complexity without first knowing, with precision, what is on it?
China AI Green Energy Mapping: What the Research Actually Did
The conventional way to track renewable energy deployment is through utility filings, government registries, and industry surveys. Each method suffers from the same flaw: it relies on operators to self-report, which introduces lags, underreporting, and geographic ambiguity. China’s solar build-out has been so rapid — the country commissioned more solar photovoltaic capacity in 2023 alone than the entire world did in 2022 — that administrative databases have struggled to keep pace.
The Damo-Peking University framework took a different approach. Using sub-metre satellite imagery and a deep-learning architecture trained to distinguish solar arrays and wind turbines from roads, rooftops, and farmland, the team produced a unified national inventory covering installations as of 2022. The 7.56 terabytes of processed imagery represent, by any measure, one of the most computationally intensive remote-sensing exercises applied to energy infrastructure in the peer-reviewed literature.
What makes the dataset genuinely useful — rather than merely impressive — is its application to what the paper calls solar-wind complementarity. The core finding, published in Nature, is that pairing solar and wind assets reduces generation variability, and that the effectiveness of this pairing increases as the geographic scope of pairing expands. In plain terms: the more widely a grid operator can see and coordinate dispersed renewable assets, the more stable the system becomes. The inventory is the prerequisite for that coordination at national scale.
Professor Liu’s phrase — “God’s-eye view” — captures something real. China has long had ambitions on paper: carbon peak by 2030, carbon neutrality by 2060, renewable capacity targets that consistently overshoot forecasts. What it has often lacked is the granular data infrastructure to translate targets into real-time operational decisions. This study represents a material step toward closing that gap. For grid operators trying to anticipate renewable output, route curtailed electricity, or site new computing hubs, knowing the precise location and configuration of 411,000 generating assets is not an academic exercise. It is operational intelligence.
The Structural Tension: AI as Both the Problem and the Answer
Here is where the story gets complicated. The same AI capabilities that produced the national energy inventory are also the reason China’s grid faces growing stress. Every large language model trained, every image generated, every real-time query processed draws on data centres whose electricity demand is rising faster than almost any other sector. The dual role of AI — as both the cause of surging energy consumption and the tool being deployed to manage it — creates a feedback loop that policy documents rarely acknowledge directly.
How does China plan to use AI to manage renewable energy grid instability? China is deploying AI models to forecast solar and wind output, optimise real-time electricity dispatch, and coordinate demand response — shifting data-centre loads from peak to off-peak periods. In Shanghai, Jiangsu, and Guangdong, data-centre storage is being integrated into virtual power plants. AI-managed demand response is projected to shave 3.5 gigawatts off peak demand in 2026, according to energy consultancy Qianjia, reducing curtailment and improving grid security without new physical infrastructure.
Beijing’s policy architecture reflects this dual logic. A 29-measure action plan issued in May 2026 by China’s National Energy Administration commits to coordinating data-centre expansion with renewable capacity in resource-rich northern and western provinces — Qinghai, Xinjiang, and Heilongjiang are named explicitly. New data centres within China’s eight national computing hubs must source at least 80% of their energy from renewables. The target year for “mutual empowerment and deep integration between AI and energy” is 2030.
The efficiency mandates are already biting. China requires new large and hyperscale data centres to achieve a power usage effectiveness (PUE) — a measure of how much electricity actually reaches computing hardware versus how much is lost to cooling and distribution — of 1.25 or lower, with projects in national computing hubs held to 1.2. For context, top global facilities have achieved PUE levels as low as 1.04 under favourable climatic conditions. That gap is the efficiency frontier China’s operators are being pushed toward.
Still, the picture is more complicated than the policy documents suggest. The IEA notes that most of China’s existing data centres sit in eastern coastal provinces where roughly 70% of electricity supply still derives from coal. Western provinces offer abundant and cheap renewables, but moving computing infrastructure to Xinjiang or Qinghai introduces latency costs and supply-chain complications that operators find commercially uncomfortable.
What This Means for Markets, Grids, and Geopolitics
The downstream implications of China’s AI-enabled energy mapping project extend well beyond grid management software. Three interconnected consequences deserve attention.
First, the inventory positions China’s state and quasi-state entities to make procurement and planning decisions with a precision unavailable to their counterparts in Europe or the United States. When a grid operator in Shanghai knows not just that 319,972 solar facilities exist, but where each one is, how large it is, and how it correlates spatially with wind assets, the economic value of that information for derivatives pricing, capacity auctions, and transmission investment is substantial. China is on course to nearly double its data-centre capacity to 60 gigawatts by 2030, adding 28 GW of new projects to the 32 GW already installed, according to Rystad Energy. Siting those facilities optimally — close to abundant renewables, far from grid bottlenecks — is a billion-dollar decision problem that granular energy mapping helps solve.
Second, the data-centre buildout is reshaping China’s regional economic geography in ways that won’t fully materialise for years. The push toward Qinghai, Inner Mongolia, and Xinjiang is not simply an energy efficiency play. It ties AI infrastructure investment to provinces that Beijing has long struggled to integrate into the coastal technology economy. Green power industrial parks, with dedicated renewable generation and battery storage co-located with compute clusters, create a vertically integrated energy-compute ecosystem that has no obvious parallel outside China’s planning framework.
Third, the geopolitical dimension is impossible to separate from the technical one. China added more wind and solar capacity over the past five years than the rest of the world combined, according to Wood Mackenzie — and it now has a research-grade inventory of that capacity, processed by AI, published in the most prestigious scientific journal in the world. That combination of physical deployment and analytical visibility represents a form of strategic advantage whose implications extend beyond electricity markets. A country that can see its own energy infrastructure with this clarity can plan, hedge, and respond to shocks faster than one that cannot.
The Limits of the View from Above
Not everyone is persuaded that AI-powered optimism about China’s energy transition is fully warranted. Several structural objections deserve a hearing.
The coal baseline is the most persistent. By 2030, China’s data centres are projected to consume between 400 and 600 terawatt-hours of electricity annually, according to Carbon Brief, with associated emissions of roughly 200 million tonnes of CO₂ equivalent. Research firm SemiAnalysis has noted that data centres in China operate at “a significant disadvantage from the emissions perspective” relative to counterparts powered by cleaner grids. Even if the mapping project enables better solar-wind complementarity, the fuel mix feeding the eastern data centres — where most computing actually runs — remains coal-heavy for the foreseeable future.
There is also a question about the gap between inventory and implementation. Knowing where 411,000 renewable assets are located is not the same as having the grid software, trading mechanisms, and regulatory frameworks to optimise them in real time. China’s green power trading market is still maturing. The “green certificate” mechanisms through which data-centre operators procure renewable electricity vary by province and have been criticised for allowing credits to be decoupled from actual physical power flows. Procurement flexibility, in other words, has not yet become procurement integrity.
Critics of the broader AI-in-energy narrative also point to an epistemological limit. The Peking University-Damo dataset maps facilities as of 2022 — a vintage that already feels historical given the pace of installation. China’s solar build-out is adding capacity at a rate that would outpace any static inventory within months. Keeping the map current requires continuous satellite processing at scale, which is exactly the kind of AI compute task that generates the electricity demand the map is meant to help manage. It’s an elegant circle, though not necessarily a virtuous one.
A New Kind of Infrastructure
The Peking University-Alibaba paper will be cited for years in the energy literature. Its immediate value is scientific: it establishes a reproducible, scalable framework for building national-scale renewable energy inventories using satellite imagery and deep learning. Its longer-term significance is strategic.
China is constructing, piece by piece, a data infrastructure for its energy transition that is qualitatively different from the reporting-based systems that most governments rely on. Real-time AI forecasting of renewable output, demand-response programmes that shift data-centre loads to absorb excess generation, and now a high-resolution national asset inventory — these are not standalone initiatives. They are components of a system designed to manage the inherent tension between an AI economy that demands ever more electricity and a climate commitment that demands ever less carbon.
Whether the system will work — whether the efficiency mandates will stick, whether the grid will stay stable as data-centre power demand maintains its 19% annual growth rate, whether the western renewable hubs will genuinely displace coal-fired eastern compute — remains to be seen. What is no longer in doubt is that China has decided to treat energy and AI as a single engineering problem. The God’s-eye view is just the beginning of that project. What happens when the view becomes a command is the question that will define the decade.
Discover more from The Economy
Subscribe to get the latest posts sent to your email.

Goldman Sachs: “The Circulatory System Is Not Working”

Why the U.S. Budget Airline Model Is Running Out of Runway

China’s Oil Shock Absorber: How Beijing Kept Crude Prices Half of What Analysts Predicted

CRH Nears Biggest-Ever Deal to Acquire Arcosa

U.S. Inflation at a Three-Year High: How the Iran War Turned an Economic Recovery Into a Stagflation Risk

IPO Summer 2026: Anthropic, OpenAI, and the Race to Price Artificial Intelligence on Public Markets

Strait of Hormuz Crisis 2026: How a Waterway War Broke Global Oil Markets

Kevin Warsh’s Fed Debut: Rate Hikes Now on the Table as U.S. Monetary Policy Enters a New Era

SpaceX IPO 2026: Inside the $85.7 Billion Listing That Made Elon Musk the World’s First Trillionaire

PSX KSE-100 Up 500+ Points: The Geopolitical Impact on Stocks

Did Anthropic Talk Its Way Into an AI Export Ban?

Big Bonuses for South Korea’s Chip Workers Put Central Bank on Inflation Alert

Easing Iran Tensions Push Mortgage Rates Lower — But a Potential Fed Hike Clouds the Outlook

Paramount’s $111 Billion Warner Bros. Discovery Merger Clears DOJ, But Faces New Hurdles

China Overhauls the World’s Biggest Surveillance Network with Advanced AI

SpaceX IPO: Inside the $2 Trillion Market Debut

KPMG Australia CEO Resigns After Whistleblower Claims Exposed Investigation Failures

PwC China Partner Payouts Cut Amid Evergrande Audit Fraud

Broadcom Market Value Loss: Revenue Forecast Disappoints

The Guardrails Are Down: How Meta and Google’s AI Models Fold Under Pressure

Pakistan Budget FY 2026-27: Relief, Prospects, and the Tightrope Walk

Benefitbay Raises $18M to Build the Plumbing for America’s ICHRA Shift

Nasdaq Tumbles 4% as Chip and Memory Stocks Sink: A $1.2 Trillion Wipeout

Here’s How Much It’ll Cost You to Be Part of SpaceX’s Record-Breaking $75 Billion IPO

Japanese Mid-Sized Firms Flock to Southeast Asia for Growth

Singapore Puts a Clock on Wealth: MAS Orders Banks to Halve Account-Opening Times

Smash Capital Leads $200M Funding for Allen Control Systems

Can Exxon Build the World’s Biggest Carbon Capture Business?
-

 Markets & Finance6 months ago
Top 15 Stocks for Investment in 2026 in PSX: Your Complete Guide to Pakistan’s Best Investment Opportunities
-

 Analysis4 months ago
Top 10 Stocks for Investment in PSX for Quick Returns in 2026
-

 Analysis5 months ago
Brazil’s Rare Earth Race: US, EU, and China Compete for Critical Minerals as Tensions Rise
-

 Analysis4 months ago
Johor’s Investment Boom: The Hidden Costs Behind Malaysia’s Most Ambitious Economic Surge
-

 Banks5 months ago
Best Investments in Pakistan 2026: Top 10 Low-Price Shares and Long-Term Picks for the PSX
-

 Investment5 months ago
Top 10 Mutual Fund Managers in Pakistan for Investment in 2026: A Comprehensive Guide for Optimal Returns
-

 Global Economy6 months ago
15 Most Lucrative Sectors for Investment in Pakistan: A 2025 Data-Driven Analysis
-

 Global Economy6 months ago
Pakistan’s Export Goldmine: 10 Game-Changing Markets Where Pakistani Businesses Are Winning Big in 2025