
Cryptocurrency
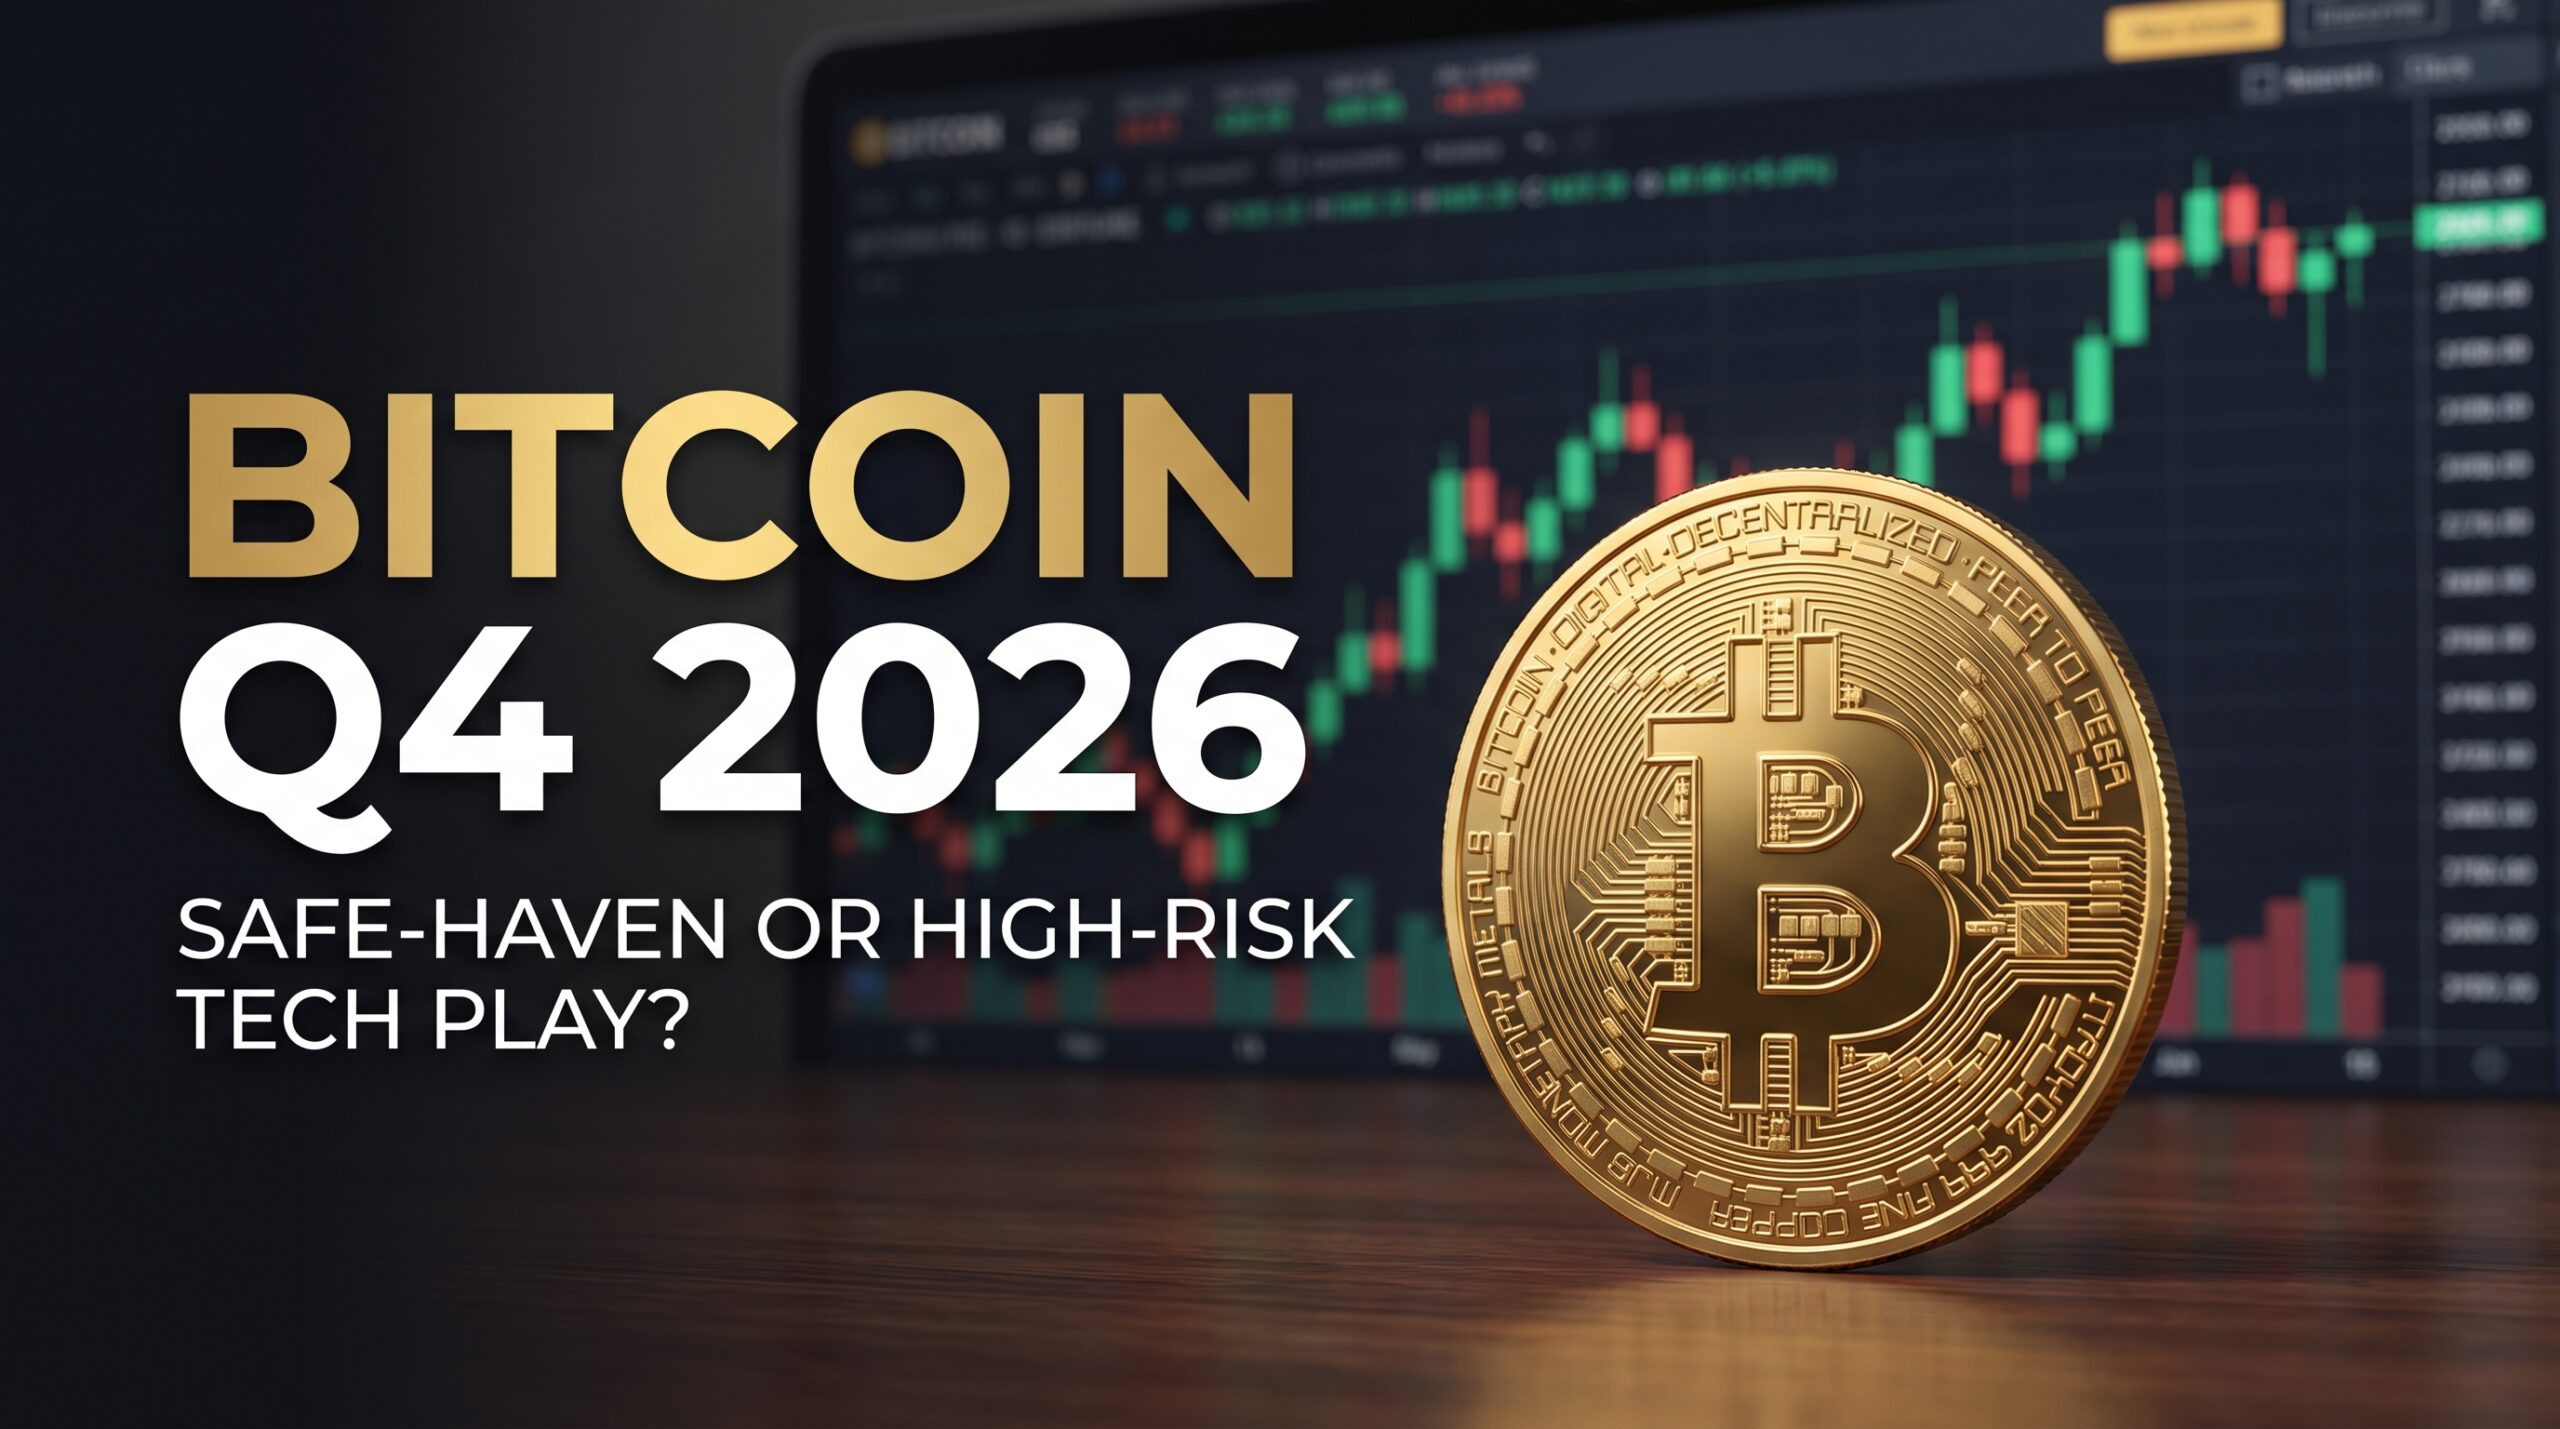
Bitcoin Price Action in Q4 2026: Safe-Haven Asset or High-Risk Tech Play?

Key Takeaways
- Bitcoin has traded in a roughly $76,000–$82,000 range through early-to-mid September 2026, well off its prior cycle highs.
- Long-term holder behavior flipped positive in late August after a month of distribution — a signal some analysts read as accumulation, not capitulation.
- Prediction markets assign meaningfully higher odds to Bitcoin testing lower support ($70,000–$77,500) than to a breakout above $85,000 in the near term.
- Bitcoin’s correlation to risk assets (tech stocks) has remained the dominant pattern in 2026, undercutting the “digital gold” safe-haven narrative during this year’s Middle East-driven volatility.
- Leverage remains elevated on both sides of the trade — Binance alone shows billions in liquidation exposure clustered just below and above current price, meaning sharp moves in either direction are structurally likely.
The Case for “Safe Haven”
Proponents argue Bitcoin’s fixed supply and lack of counterparty risk make it a natural hedge against currency debasement and geopolitical shocks — the same argument made for gold. Some data supports this framing in 2026:
- Long-term holder net position change turned positive on August 31 after four weeks of distribution, suggesting accumulation rather than panic-selling into the year’s volatility.
- The number of large wallets (holding meaningful BTC) has declined only modestly even during a 25% rally, implying existing whales aren’t dumping into strength.
The Case for “High-Risk Tech Play”
The counterargument is that Bitcoin has behaved far more like a leveraged tech stock than gold throughout 2026’s geopolitical stress:
- Bitcoin fell alongside — not against — equities during the sharpest Middle East-driven risk-off sessions in September, the opposite of how gold or the yen typically trade in a flight to safety.
- Seasonality has historically been unkind: Bitcoin closed August green only twice since 2020, and both times September followed with 7%+ declines. (The last three Septembers broke that pattern, so the “worst month” label is contested.)
- Prediction-market pricing as of early September gave roughly a 90% probability to price staying below $77,500 in the near term, with real weight on scenarios down at $65,000–$70,000 — hardly the profile of an asset behaving as ballast.
Where Bitcoin Actually Sits Right Now
| Metric | Reading (Sept 2026) |
|---|---|
| Spot price | ~$77,000–$79,000 range |
| Key support | ~$77,000 |
| Key resistance | ~$82,600–$91,700 |
| Fear & Greed Index | Mid-50s (Greed) |
| 30-day volatility | ~7% |
Levels are illustrative of the mid-September 2026 range and move daily — verify against a live feed before publishing.
What This Means for Portfolio Construction
The honest answer is that Bitcoin in 2026 has functioned as both, depending on the time horizon: a long-term accumulation story for holders who aren’t reacting to daily headlines, and a high-beta risk asset on any given volatile trading day. Treating it as a guaranteed geopolitical hedge — the way this year’s Middle East conflict might tempt some investors to — has not been supported by its actual price behavior during the conflict’s most volatile weeks.
Is Bitcoin a safe haven asset in 2026?
Not consistently. While long-term holder data suggests accumulation rather than panic-selling, Bitcoin’s price has moved in line with — not against — risk assets during 2026’s sharpest geopolitical sell-offs, undermining the “digital gold” thesis in the short term even as some structural bullish signals persist.
Discover more from The Economy
Subscribe to get the latest posts sent to your email.



Bitcoin is doing something it hasn’t done cleanly all year: holding a range. After a brutal first half of 2026 and a sharp recovery through the summer, BTC has settled into the high-$70,000s heading into a week that could reshape U.S. crypto market structure for good. Here’s the full picture across Bitcoin, the major altcoins, and the DeFi regulatory fight that’s about to come to a head.
Bitcoin: From 21-Month Low to Cautious Recovery
Bitcoin’s 2026 has been a genuine round trip. After topping out at an all-time high near $128,200 in October 2025, BTC fell to roughly $58,000 by late June 2026 — a 21-month low — before staging a real recovery, climbing about 37% to touch $80,000 by late August, according to KuCoin’s market roundup. As of mid-September 2026, Bitcoin was trading in the $77,000–$79,000 range, per CoinDesk and Fortune’s daily price tracker, still roughly 37–39% below its October 2025 peak.
Bitcoin’s 2026 price arc:
| Date | Price | Note |
|---|---|---|
| Oct 6, 2025 | ~$128,200 | All-time high |
| Late June 2026 | ~$58,000 | 21-month low |
| Late August 2026 | ~$80,000 | +37% off the bottom |
| Sept 8, 2026 | $78,346 | |
| Sept 9, 2026 | $78,737 | Lost the $80,000 level after holding it for four sessions |
| Sept 11, 2026 | ~$77,200–$77,300 | Recovering as zcash-related leverage unwinds |
The macro backdrop is the dominant driver right now, more than crypto-native news. The Federal Reserve, under Chair Kevin Warsh, has held its policy rate at 3.50%–3.75% for five consecutive meetings in 2026 without a single cut, with the median 2026 dot plot sitting at 3.8% — pointing toward continued tightness rather than the easing cycle many crypto investors were positioned for, according to KuCoin’s analysis. August’s core CPI print, released mid-September, rose a faster-than-forecast 0.3% month-on-month, though the annual pace of 2.4% was the slowest since early 2021, per CoinDesk market coverage — a mixed signal that has kept the market betting on the possibility of a rate hike rather than a cut in the near term, an unusual dynamic for crypto markets historically primed for rate-cut tailwinds.
Altcoins: Ethereum, Solana, and XRP Hold Steady Amid Regulatory Noise
The broader altcoin market has been comparatively rangebound. As of September 11, 2026, Ethereum traded around $2,539, up 2.8% over 24 hours; XRP sat near $1.36–$1.39, roughly flat to slightly down; and Solana traded around $101–$104, according to Investing News Network’s crypto recap.
Major token snapshot (Sept 8–11, 2026):
| Token | Price | 24h Move |
|---|---|---|
| Bitcoin (BTC) | ~$77,000–$79,000 | Mixed |
| Ethereum (ETH) | ~$2,460–$2,540 | +2.8% (Sept 11) |
| XRP | ~$1.36–$1.39 | Roughly flat |
| Solana (SOL) | ~$101–$104 | +1% (Sept 11) |
| BNB | Under pressure | -3.4% in one session |
| Dogecoin (DOGE) | Under pressure | -4.3% in one session |
The ETF complex has meaningfully broadened beyond Bitcoin this year. Solana and XRP-linked ETF products each entered September 2026 with assets near $1.5 billion, according to KuCoin — a sign that institutional demand for regulated altcoin exposure is no longer a Bitcoin-only phenomenon, even as individual token prices remain well below their 2025 highs.
DeFi’s “Killer Use Case”: Institutional Credit
The most consequential DeFi development this month has come from the XRP Ledger rather than Ethereum. According to CoinMarketCap’s coverage of comments from Ripple’s product head, institutional credit is emerging as DeFi’s potential “killer use case” — new XRP Ledger amendments (XLS-65 and XLS-66) enable pooled vaults and fixed-term, uncollateralized lending, with underwriting handled off-chain while the loans themselves settle on-chain. The pitch is straightforward: bring institutional-grade lending mechanics onto a public ledger without forcing institutions to accept crypto-native over-collateralization requirements that don’t match how traditional credit underwriting works.
This is part of a broader pattern of DeFi maturing toward institutional rails rather than remaining a purely retail, yield-farming-driven segment. Ripple’s own treasury business — following its $1 billion acquisition of GTreasury in October 2025 and the April 2026 launch of Digital Asset Accounts — is layering AI-driven policy interpretation and analytics on top of these on-chain lending primitives, aimed squarely at corporate finance teams rather than retail DeFi users.
The Regulatory Cliffhanger: CLARITY Act Vote on September 15
The single biggest near-term catalyst for the entire crypto market is not a price level — it’s a Senate procedural vote. Senate Republicans released a revised, 630-page version of the Digital Asset Market Clarity Act on September 10, 2026, ahead of a pivotal procedural vote scheduled for September 15, according to Investing News Network. The updated bill specifically targets “decentralized-in-name-only” (DINO) protocols — platforms that claim decentralization but remain effectively controlled by an individual or corporate entity — requiring them to register with the CFTC.
Market participants remain skeptical the bill actually becomes law in 2026. CNBC reported that SALT CEO John Darsie told the Wyoming Blockchain Symposium in August that he is “a bit pessimistic about the Clarity Act being passed,” citing the difficulty of moving major legislation heading into midterm elections. The bill already missed one legislative window when the Senate adjourned for August recess without a vote.
Corporate and Institutional Flows to Watch
Beyond regulation, institutional capital continues flowing into crypto infrastructure. Nasdaq Ventures announced a $100 million investment in Payward, the parent company of Kraken, valuing the exchange at $21 billion, according to Investing News Network’s recap — one of several signs that traditional financial infrastructure players are taking direct equity stakes in crypto exchanges rather than simply building competing products.
Final Verdict
The crypto market’s “daily outlook” for mid-September 2026 is really a story about two collisions happening at once: a Federal Reserve that refuses to deliver the rate-cut tailwind crypto bulls were counting on, and a Senate that is finally forced to vote on the market-structure legislation the industry has wanted for years, with genuine uncertainty about whether it passes. Bitcoin’s technical picture — holding above its 200-day EMA near $72,800 while losing the psychologically important $80,000 level — reflects that tension directly. Short-term, expect continued chop around the $75,000–$82,000 range pending the September 15 CLARITY Act vote and the next FOMC decision; the DeFi institutional-credit narrative and altcoin ETF expansion remain the more durable, multi-quarter stories worth tracking independent of daily price action.
Discover more from The Economy
Subscribe to get the latest posts sent to your email.
Cryptocurrency
Anthony Scaramucci’s Crypto Prediction: Why MicroStrategy’s Move Is Bitcoin’s “iPhone Moment”

When Anthony Scaramucci calls something an “iPhone moment,” it’s worth asking what he means — and whether the comparison holds up against the data. The SkyBridge Capital founder used the phrase to describe MicroStrategy’s newest financial engineering move: a high-yield Perpetual Stretch Preferred Stock designed to package Bitcoin exposure in a format institutions can actually buy. Coming from one of Bitcoin’s most consistent institutional cheerleaders, the comment is both a marketing line and a genuine thesis about how Bitcoin adoption scales from here.
The Product: MicroStrategy’s Preferred Stock Play
In March 2026, MicroStrategy (Nasdaq: MSTR) — the software company turned Bitcoin treasury vehicle led by Michael Saylor — issued a Perpetual Stretch Preferred Stock tied directly to its Bitcoin strategy. Rather than relying purely on convertible debt or direct equity issuance to fund additional Bitcoin purchases, the structure packages Bitcoin-related risk and return into a preferred-equity format that is more familiar and operationally simpler for institutional allocators to hold, according to Yahoo Finance.
Scaramucci’s framing was direct: the structure is being positioned as a potential catalyst for broader global institutional adoption of Bitcoin exposure — his “iPhone moment” language implies this is the product that makes Bitcoin exposure genuinely mainstream and easy to distribute, the way the iPhone made mobile computing accessible to a non-technical mass market rather than just early adopters.
Scaramucci’s Broader Bitcoin Thesis in 2026
The preferred-stock comment sits inside a much longer running commentary from Scaramucci throughout 2026, and tracking his calls chronologically shows a consistent, if evolving, thesis.
Scaramucci’s 2026 Bitcoin commentary timeline:
| Date | Statement | Context |
|---|---|---|
| December 2025 | Bitcoin will “easily” reach $150K in 2026 | Made before the 2026 drawdown began |
| March 2026 | MicroStrategy’s preferred stock is Bitcoin’s “iPhone moment” | Institutional access framing |
| June 15, 2026 | Bitcoin can reclaim $70K by end of July | Contingent on regulatory momentum |
| June 17–20, 2026 | Rally expected late Q4 2026 into early 2027 | Defense of Saylor/Strategy amid drawdown |
According to Finbold’s reporting on his June 2026 CNBC interview, Scaramucci argued Bitcoin remains consistent with its historical four-year post-halving cycle, and that the current drawdown — roughly 50% from Bitcoin’s October 2025 all-time high — is milder than the 60–70% peak-to-trough crashes seen in prior cycles. His explanation: spot Bitcoin ETF inflows and broader institutional participation have “buffered” this cycle’s downside in a way retail-dominated cycles never experienced.
Defending Saylor: The Balance Sheet Argument
A recurring theme in Scaramucci’s 2026 commentary has been his defense of Michael Saylor’s Strategy against concerns that a prolonged Bitcoin downturn could force distressed selling of its holdings. Per Yahoo Finance’s report on his CNBC appearance, Scaramucci pointed to Strategy’s roughly $52 billion in Bitcoin holdings, about $1 billion in cash reserves, and no major debt maturities until 2028, as evidence the company has enough structural runway to weather further Bitcoin weakness without a forced liquidation event.
“You have to really understand the mechanisms of the balance sheet to understand that Bitcoin can go a lot lower, and he’s virtually not in trouble,” Scaramucci said, according to the same report. He also noted that Strategy’s stock continues to trade at a premium to its underlying Bitcoin holdings — a structural feature he described as providing “necessary arbitrage” opportunities for sophisticated investors, rather than a red flag.
How the Prediction Has Tracked Against Reality
Bitcoin’s actual 2026 price path offers a mixed scorecard for Scaramucci’s calls. The $150,000 target set in December 2025 has not materialized — Bitcoin instead fell from its October 2025 all-time high of roughly $128,200 to a 21-month low near $58,000 in late June 2026, according to KuCoin’s market analysis. His June 2026 call for a $70,000 reclaim by end of July, however, proved directionally accurate and arguably conservative: Bitcoin recovered roughly 37% off its June low to reach approximately $80,000 by late August 2026, and was trading in the high-$70,000s as of mid-September 2026.
Bitcoin’s actual 2026 price arc:
| Point | Level |
|---|---|
| All-time high (Oct 6, 2025) | ~$128,200 |
| 2026 low (late June) | ~$58,000 (21-month low) |
| Late August 2026 | ~$80,000 |
| Mid-September 2026 | ~$77,000–$79,000 |
The remaining, unresolved part of the thesis — a sustained rally beginning in late Q4 2026 into early 2027 — is still ahead of the market as of this writing, and depends heavily on a macro variable Scaramucci’s commentary has not fully priced: the Federal Reserve under Chair Kevin Warsh has held rates at 3.50%–3.75% for five consecutive meetings in 2026 with no cuts, a materially tighter backdrop than the rate-cutting cycle many crypto bulls expected entering the year.
Why the “iPhone Moment” Framing Matters Beyond MicroStrategy
The significance of Scaramucci’s comment isn’t really about MicroStrategy’s stock — it’s about the broader thesis that Bitcoin’s next leg of adoption depends on wrapping the asset in structures that traditional allocators, insurance companies, and pension funds can hold within existing mandates, rather than requiring them to custody Bitcoin directly. Preferred stock, spot ETFs, and increasingly diversified crypto ETF products (Solana and XRP ETFs each entered September 2026 with roughly $1.5 billion in assets, per KuCoin) all serve that same function: converting a historically retail- and crypto-native asset into something a conventional balance sheet can own.
Final Verdict
Scaramucci’s “iPhone moment” comment is best read as a bet on distribution, not price. His specific numerical Bitcoin price targets in 2026 have had a mixed track record — badly missing on $150K, more accurately calling the $70K recovery level — but his structural thesis, that institutional-friendly wrappers like MicroStrategy’s preferred stock expand who can hold Bitcoin exposure, is playing out in real time across ETFs and now preferred equity. Investors should treat his specific price and timing calls with appropriate skepticism given the track record, while recognizing that the underlying institutional-access thesis has real, verifiable momentum behind it.
Discover more from The Economy
Subscribe to get the latest posts sent to your email.
The Ultimate Ledger of a Nation’s International Economic Transactions
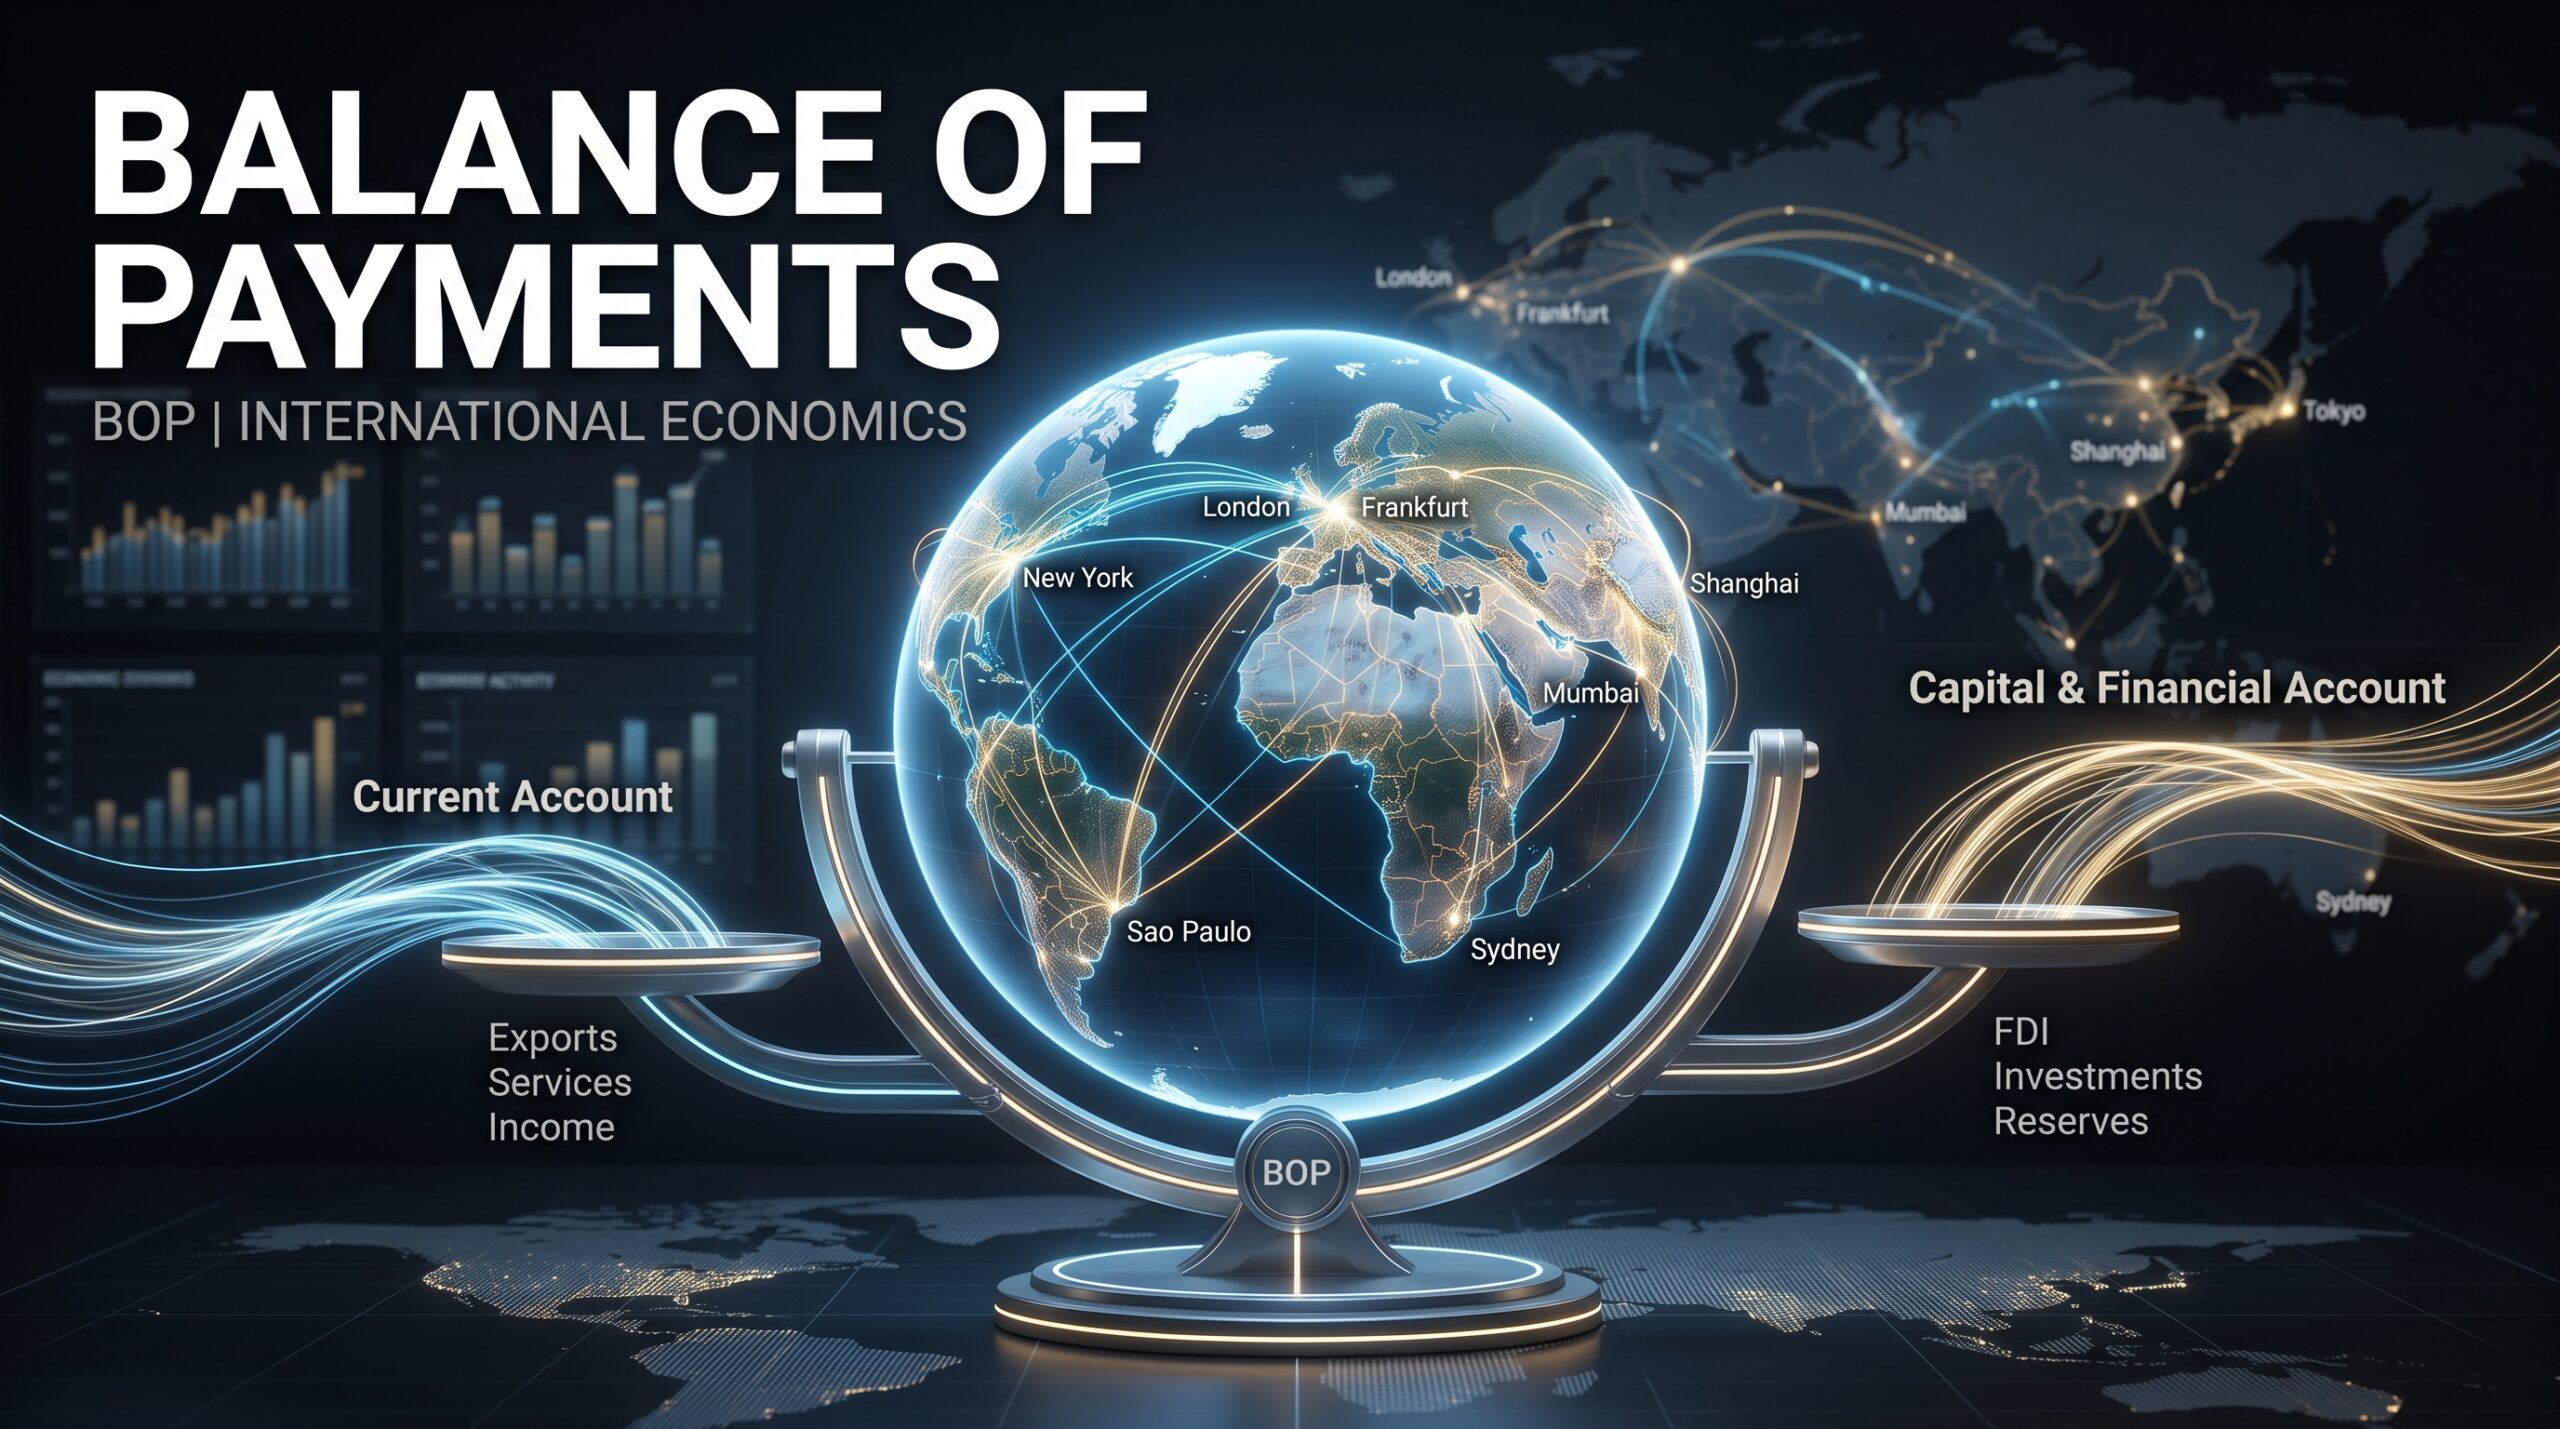
The Balance of Payments (BOP) is one of the most comprehensive and critical macroeconomic accounting tools used by economists, financial analysts, and policymakers. It is a systematic record of all economic transactions conducted between the residents of a country (including individuals, businesses, and the government) and the rest of the world over a specific period, typically a quarter or a year.
For platforms like Thefinance.pk and Economy.com.pk, analyzing a nation’s BOP is non-negotiable. While Gross Domestic Product (GDP) measures domestic production, the BOP measures a country’s financial sovereignty, trade competitiveness, and economic connectivity with global markets. If a country is an economic island, the BOP is the detailed logbook of every ship entering and leaving its ports.
The Accounting Identity of BOP
The fundamental rule of Balance of Payments accounting is that it operates on a double-entry bookkeeping system. Every international transaction results in two entries: a credit and a debit. Theoretically, the sum of all elements in the BOP must always equal zero.
$$\text{Current Account} + \text{Capital Account} + \text{Financial Account} + \text{Net Errors and Omissions} = 0$$
In reality, because data collection from thousands of trade ports, banks, and remittance channels is prone to discrepancies, central banks use a balancing item called Net Errors and Omissions to make the ledger balance. When economists talk about a “BOP surplus” or a “BOP deficit,” they are not referring to the entire ledger summing to zero; rather, they are looking at specific sub-accounts—most notably the current account and official reserve assets.
The Three Core Components of the BOP
The Balance of Payments is officially structured into three primary accounts:
1. The Current Account
The Current Account records the flow of goods, services, primary income, and secondary income. It represents the most tangible part of international trade.
- Trade in Goods (Visible Trade): Physical merchandise exports (e.g., textiles, agricultural products) and imports (e.g., machinery, crude oil, electronics).
- Trade in Services (Invisible Trade): Non-physical services such as IT exports, shipping logistics, tourism, insurance, and financial services.
- Primary Income: Compensation paid to non-resident workers and investment income (dividends, interest earned on foreign investments or paid on foreign debt).
- Secondary Income: Current transfers such as worker remittances, foreign aid, and international grants where no direct good or service is received in return. For developing economies like Pakistan, this sub-category—specifically worker remittances—acts as a vital economic cushion.
2. The Capital Account
The Capital Account is relatively small in most economies. It records non-market, non-produced, and intangible asset transfers. This includes the acquisition or disposal of non-produced, non-financial assets (such as patents, copyrights, trademarks, and franchises), as well as debt forgiveness granted by foreign governments.
3. The Financial Account
The Financial Account records international monetary transactions involving financial assets and liabilities. It tracks how a country finances its current account imbalances and invests its surplus capital. It is broken down into four main components:
- Foreign Direct Investment (FDI): Long-term investments where a foreign entity acquires a lasting interest or managerial control in a domestic enterprise (e.g., building a manufacturing plant or acquiring a local telecom company).
- Portfolio Investment: Transactions in financial securities like stocks and bonds. Unlike FDI, portfolio investment is liquid and can enter or leave a country rapidly based on market sentiment.
- Other Investment: Trade credits, loans, currency deposits, and transactions with the International Monetary Fund (IMF).
- Reserve Assets: Foreign currency reserves, gold holdings, and special drawing rights (SDRs) held by the central bank. Changes in reserve assets reflect how the central bank intervened to stabilize the currency.
Why a BOP Crisis Occurs
A Balance of Payments crisis (often referred to as an exchange rate crisis or currency crisis) happens when a country cannot pay for its essential imports or service its external debt obligations because its foreign exchange reserves have been completely depleted.
This typically unfolds through a predictable chain reaction:
- Persistent Current Account Deficits: The country imports vastly more goods and services than it exports, and remittances fail to cover the gap.
- Depleting Reserves: To defend the local currency from crashing, the central bank sells off its foreign exchange reserves (US Dollars, Euros) in the open market.
- Capital Flight: Foreign and domestic investors, sensing economic instability, pull their money out of local stocks and bonds (portfolio investments).
- Exhaustion: Foreign reserves hit critically low levels (sometimes falling below a few weeks’ worth of import cover).
- IMF Bailout: The government is forced to approach international lenders like the IMF for an emergency stabilization program, which usually comes with harsh conditions, including massive interest rate hikes, tax increases, and currency devaluation.
The Strategic Value of BOP Data
For readers of economist.media, monitoring the quarterly BOP statements published by the central bank provides a crystal ball into future economic policy. If the financial account fails to attract enough FDI or loans to cover a widening current account deficit, the writing is on the wall: currency depreciation and policy tightening are imminent. Conversely, a healthy BOP surplus allows a central bank to build up robust foreign reserves, stabilize inflation, and foster investor confidence.
Key Takeaways:
- The Balance of Payments is a complete ledger of all economic transactions between a country and the rest of the world.
- It consists of three main segments: the Current Account, the Capital Account, and the Financial Account.
- Worker remittances and international trade make up the core of the current account in developing nations.
- A BOP crisis occurs when foreign exchange reserves are depleted, forcing nations to seek emergency IMF bailouts.
Authoritative Sources & Further Reading:
- International Monetary Fund (IMF): Balance of Payments Manual (BPM6)
- World Bank: Global Financial Development and BOP Data
- State Bank of Pakistan (SBP): External Sector Statistics
Discover more from The Economy
Subscribe to get the latest posts sent to your email.

Beyond Rhetoric: How the EU Is Deploying ‘All Tools’ to Rebalance Its €1 Billion-a-Day Trade Deficit with China

Elon Musk’s Next Moves: Disrupting the 2026 Global Economy

INTC Stock Forecast 2026: Can Intel’s Government-Backed Turnaround Hold?

Bitcoin Price Action in Q4 2026: Safe-Haven Asset or High-Risk Tech Play?

The Target Pokémon x Owala Drop: Everything to Know Before It Sells Out

The U.S. Just Confirmed It Has Weapons in Space — Here’s What It Means for Defense Stocks

IRS 2027 Tax Bracket Projections: How to Get Ahead of Bracket Creep

Dow Jones vs. Middle East Tensions: How Wall Street Is Pricing In a 2026 Conflict Nobody Saw Coming

Bank of England’s September 17 Decision: Will UK Interest Rates Finally Move?

Inflation Is Outpacing Wage Growth Again: What It Means for Your Paycheck

10-Year Treasury Yield Tops 5%: What It Means for Mortgages, Stocks, and the Fed

Ceasefire Negotiations in 2026: Predicting the Rebound of European and Asian Economies

Emerging Markets Update: The Impact of World Bank Policies on PSX Stability

Costco Oil Shortage 2026: Will Prices Double for All Synthetic Motor Oils?

State Farm’s $5B Dividend 2026: Who Qualifies & Payout Dates

US-China Relations in Q3 2026: Trade Tariffs and Supply Chain Risks

Gold’s Wild 2026: From a Record $5,600 Peak to a 24% Crash and Back Toward $4,500

Oil Surges as Strait of Hormuz Traffic Collapses Again

Bank of England Set to Hold Rates Through Year-End, Reuters Poll Shows

SpaceX Starship Flight 14: First Orbital Attempt & Starlink V3 Launch Explained

Top 30 Stocks for Investment in PSX for Massive ROI in 2026

The 2026 Crypto Regulatory Shift: What It Means for Institutional Investors

AI Chip Stocks 2026: The Best Semiconductor Investments Beyond Marvell

AI-Powered Training: The Next Multi-Billion Dollar Ecosystem in Fitness

Tween Back-to-School Trends 2026: What’s Driving the $85B Season

Russia’s Black Sea Oil Exports Fall for a Fifth Straight Week

Global Chip Selloff Deepens: What’s Driving the Aug. 19 Semiconductor Rout

Shein Clothes Quality & Safety in 2026: What Lab Tests Show
-

 Markets & Finance8 months ago
Top 15 Stocks for Investment in 2026 in PSX: Your Complete Guide to Pakistan’s Best Investment Opportunities
-

 Analysis7 months ago
Johor’s Investment Boom: The Hidden Costs Behind Malaysia’s Most Ambitious Economic Surge
-

 Analysis7 months ago
Top 10 Stocks for Investment in PSX for Quick Returns in 2026
-

 Analysis7 months ago
Brazil’s Rare Earth Race: US, EU, and China Compete for Critical Minerals as Tensions Rise
-

 Banks8 months ago
Best Investments in Pakistan 2026: Top 10 Low-Price Shares and Long-Term Picks for the PSX
-

 Investment8 months ago
Top 10 Mutual Fund Managers in Pakistan for Investment in 2026: A Comprehensive Guide for Optimal Returns
-

 Global Economy9 months ago
15 Most Lucrative Sectors for Investment in Pakistan: A 2025 Data-Driven Analysis
-

 Global Economy9 months ago
Pakistan’s Export Goldmine: 10 Game-Changing Markets Where Pakistani Businesses Are Winning Big in 2025