
Global Trade
14th WTO Conference 2026: Tariffs & Global Supply Chain Impact


The World Trade Organization’s 14th Ministerial Conference (MC14) closed in Yaoundé, Cameroon this past March without a ministerial declaration and without consensus on its core priorities — the clearest institutional signal yet that the era of rules-based multilateral trade governance is giving way to a patchwork of global trade tariffs imposed unilaterally by major economies. For businesses managing import/export logistics in the second half of 2026, the practical consequence is not abstract: 72% of trade professionals now identify U.S. tariff volatility as the single most impactful regulatory change they face, up sharply from just 41% a year earlier. The effective U.S. tariff rate has climbed to roughly 7.2% in 2026, up from 1.5% in 2022 — the fastest peacetime trade-policy shift in decades.
Key Takeaways
- MC14 ended in impasse after 164 WTO members failed to agree on extending the e-commerce customs duty moratorium, which lapsed on March 31, 2026, allowing countries to begin imposing tariffs on digital trade for the first time in 28 years.
- New U.S. tariffs now apply to an estimated 54% of U.S. goods imports in 2026, raising the applied tariff rate to 11.8% and the effective (revenue-collected) rate to 7.2%.
- Tariffs currently imposed and scheduled are projected to raise $1.4 trillion for the U.S. government from 2026 through 2035.
- The Tax Foundation estimates the new tariffs will reduce long-run U.S. GDP by 0.4%, cut the capital stock by 0.3%, and eliminate 338,000 full-time-equivalent jobs.
- 82% of small and midsize businesses are now passing tariff costs directly to customers, up sharply from just 44% who absorbed those costs internally in 2025.
MC14’s Collapse: What It Means for the Rules-Based Trading System
The WTO’s 14th Ministerial Conference was supposed to reform an institution widely seen as struggling to remain relevant amid rising economic fragmentation. Instead, it became a symbol of that fragmentation. The headline failure — Brazil and Turkey blocking a 164-member agreement to extend the Moratorium on Customs Duties on Electronic Transmissions to December 2030 — meant the 28-year-old digital trade moratorium simply lapsed on March 31, 2026, opening the door for countries to impose tariffs on cross-border digital goods and services (streaming, software, e-books) for the first time in a generation.
| MC14 Outcome | Detail |
|---|---|
| Ministerial declaration | Failed to achieve consensus |
| E-commerce moratorium | Lapsed March 31, 2026 (previously renewed biennially since 1998) |
| Dispute settlement reform | Remains unresolved; developing countries emphasize restoring a functioning system |
| Investment Facilitation for Development (IFD) | China-led agreement opposed by India as eroding WTO’s multilateral foundations |
| U.S. position | USTR publicly stated it is “skeptical of the value of the WTO,” citing the conference outcome as confirmation |
| Attendance/engagement | Nearly 2,000 trade officials attended; only the second WTO Ministerial hosted on the African continent |
The U.S. Trade Representative’s public statement following MC14 was notably blunt, expressing frustration that so few counterparts attended despite repeated assertions that the WTO remains “at the core” of the global trading system — language that itself signals how far U.S. trade policy has already moved toward bilateral and unilateral tools rather than multilateral consensus-building.
The U.S. Tariff Architecture: A Moving Legal and Economic Target
The legal basis for U.S. tariffs shifted meaningfully in 2026. The Supreme Court’s February 20, 2026 decision in Learning Resources, Inc. v. Trump held that the International Emergency Economic Powers Act (IEEPA) does not authorize the president to impose tariffs, vacating the “reciprocal” and trafficking tariffs that had been a centerpiece of trade policy since 2025. The administration responded by shifting its tariff program to alternative statutory authorities — specifically a broad Section 301 action tied to forced-labor enforcement and a Canada-specific Section 338 proclamation.
| Tariff Metric | 2026 Figure |
|---|---|
| Share of U.S. goods imports subject to new tariffs | 54% |
| Applied tariff rate (2026) | 11.8% (up from 1.5% in 2022) |
| Effective tariff rate (revenue-collected basis) | 7.2% |
| Projected total revenue, 2026–2035 | $1.4 trillion |
| Section 301 forced-labor tariff revenue, 2026–2035 | $611.7 billion |
| Projected long-run GDP impact | -0.4% |
| Projected capital stock impact | -0.3% |
| Projected employment impact | -338,000 FTE jobs |
China: The Exception That Proves the Rule
China’s average tariff rate actually declined by 9.3 percentage points in the first four months of 2026 even as total import values also fell — a counterintuitive combination explained by China’s own export controls on critical minerals and high-performance magnet technologies shipped to the United States, which suppressed trade volume independent of tariff levels. China’s average tariff rate remained near 23% as of April 2026, still high enough to sustain strong incentives for U.S. importers to diversify sourcing away from China for both economic and geopolitical hedging reasons.
How Global Supply Chains Are Actually Responding
The “Great Reallocation” Is Real and Measurable
Harvard Business School research covering over 5,300 product categories found that U.S. imports from China have fallen to near-2001 levels — the year China entered the WTO — as companies accelerate a reallocation toward Mexico and other trading partners that predates the current tariff cycle but has sped up dramatically under it.
Transshipment Crackdowns Are Reshaping Legitimate Trade Structuring
A July 2025 Executive Order introduced a 40% punitive tariff targeting illicit transshipment — the practice of routing goods through a third country to avoid origin-based tariffs. This has forced companies engaged in entirely legitimate cross-border manufacturing (where partially completed goods move between countries for modification or packaging) to document “substantial transformation” far more rigorously than before, adding real compliance cost even to non-evasive supply chains.
Businesses Are Absorbing Less and Passing More to Consumers
| Cost Absorption Trend | 2025 | 2026 |
|---|---|---|
| SMBs passing tariff costs directly to customers | 44% absorbed internally | 82% passing directly to customers |
This is one of the most consequential shifts in the entire tariff story for supply chain management software and pricing strategy: the initial 2025 posture of absorbing costs to preserve customer relationships and market share has given way to a 2026 reality where sustained tariff volatility has made absorption financially unsustainable for most small and midsize importers.
Section 232 Critical Materials List: What’s Changing
The U.S. is actively revising its Section 232 tariff list of critical materials, with proposed changes including:
| Action | Materials |
|---|---|
| Proposed removal | Arsenic, tellurium |
| Proposed additions | Copper, lead, potash, rhenium, silicon, silver, uranium, metallurgical coal |
This revision reflects an explicit effort to align tariff policy with evolving supply-chain security priorities — particularly materials tied to defense, energy, and critical infrastructure — rather than purely trade-balance considerations.
A Supply Chain Resilience Framework for Q4 2026
- Build tariff volatility into base-case financial models, not stress-test scenarios. With 72% of trade professionals now calling tariff volatility the top regulatory risk, treating it as a tail-risk scenario rather than a planning baseline is no longer defensible.
- Audit transshipment documentation proactively. The 40% punitive tariff for illicit transshipment, combined with tightened “substantial transformation” scrutiny, means even legitimate multi-country manufacturing chains need rigorous origin documentation now.
- Reassess China-dependency exposure against the full risk picture. China’s declining average tariff rate doesn’t offset its own export controls on critical minerals — sourcing diversification remains prudent for both cost and geopolitical-hedging reasons.
- Prepare for digital trade tariffs. With the e-commerce moratorium lapsed, businesses reliant on cross-border digital goods and services delivery should model exposure to new customs duties that did not exist before March 31, 2026.
- Revisit pricing pass-through strategy. With 82% of SMBs now passing tariff costs to customers, businesses still absorbing costs internally should benchmark whether that posture remains competitively sustainable.
FAQ
What happened at the WTO’s 14th Ministerial Conference?
MC14, held in Yaoundé, Cameroon in March 2026, ended without a ministerial declaration and without consensus on core priorities, most notably failing to extend the 28-year-old e-commerce customs duty moratorium, which subsequently lapsed on March 31, 2026.
What is the current effective U.S. tariff rate?
The effective (revenue-collected) U.S. tariff rate reached approximately 7.2% in 2026, up from 1.5% in 2022, with the applied tariff rate reaching 11.8% and covering an estimated 54% of U.S. goods imports.
Are businesses absorbing tariff costs or passing them to consumers?
The trend has shifted sharply toward pass-through. In 2025, 44% of small and midsize businesses absorbed tariff costs internally; by 2026, 82% were passing those costs directly to customers.
How has the legal basis for U.S. tariffs changed in 2026?
The Supreme Court’s February 2026 ruling in Learning Resources, Inc. v. Trump held that IEEPA does not authorize presidential tariff powers, prompting the administration to shift its tariff program to Section 301 and Section 338 statutory authorities instead.
Discover more from The Economy
Subscribe to get the latest posts sent to your email.


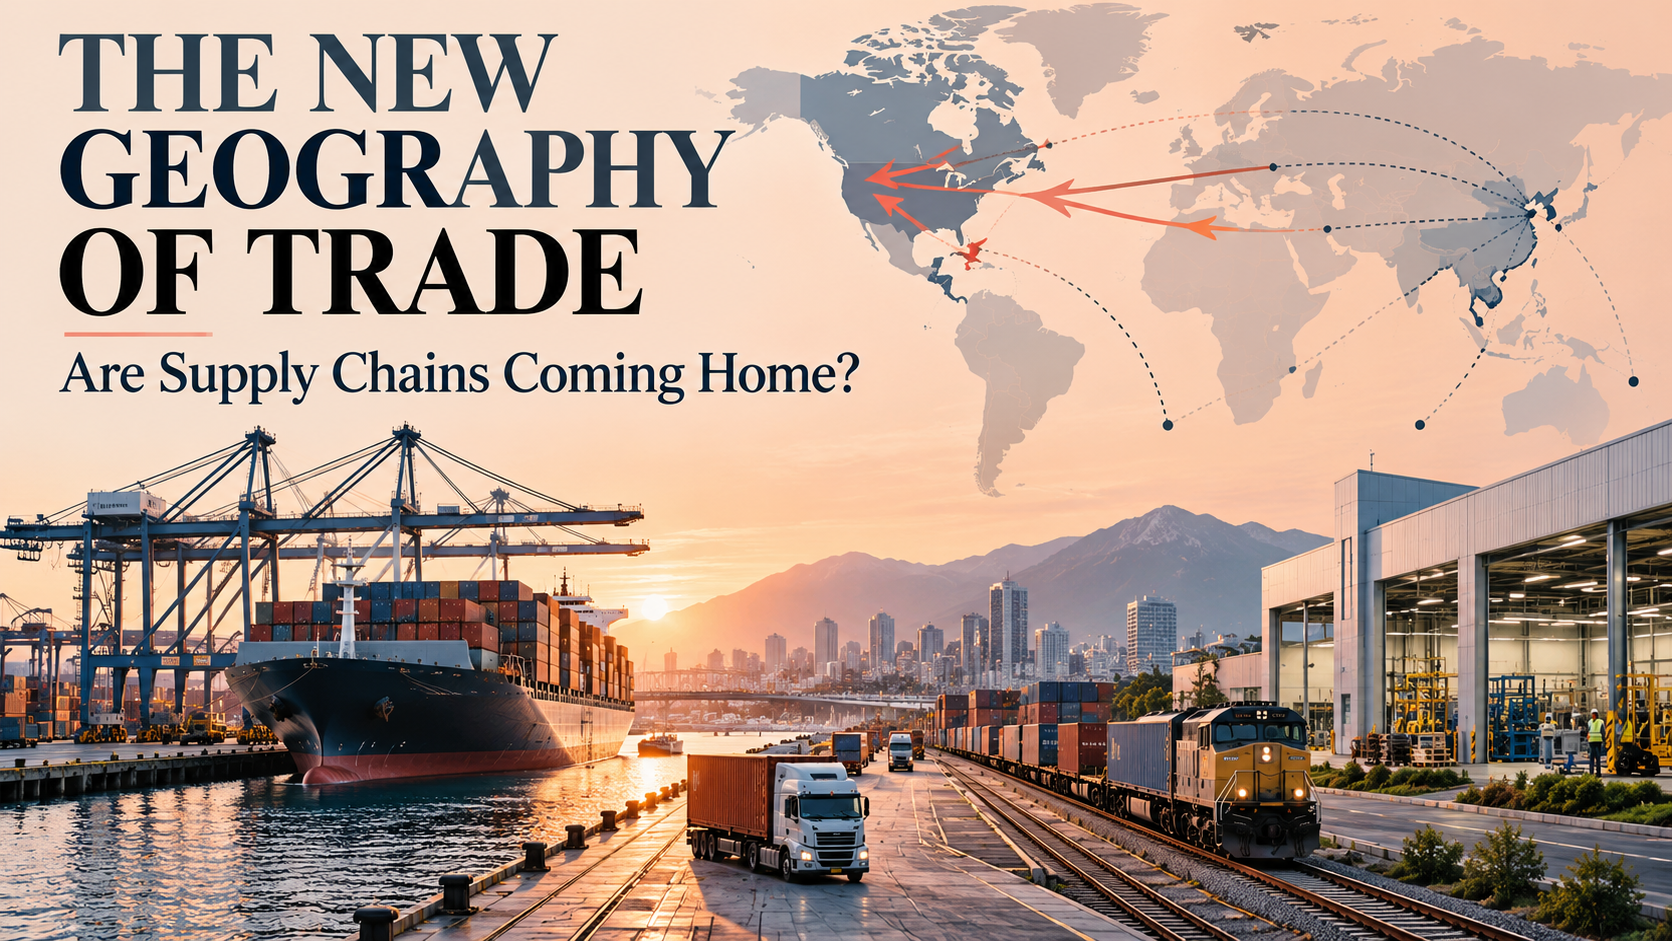
Global supply chains are changing, but the evidence does not support a simple retreat from international trade. Companies are balancing cost against disruption risgek, diversifying suppliers and reconsidering where strategically important production takes place. Some facilities are moving closer to customers; others are shifting to trusted partners or expanding in established Asian manufacturing clusters.
This is a redesign of globalization, not necessarily its end. The World Trade Organization’s October 2026 outlook expects merchandise trade volumes to grow by 3.9% this year and 4.1% in 2027, even after the Middle East conflict disrupted energy and transport routes. The sharper story is which products and economies are driving that growth, and which firms are bearing higher resilience costs.
Key takeaways
- Nearshoring moves production closer to customers; friend-shoring prioritizes strategically aligned partners; neither necessarily eliminates international trade.
- The WTO upgraded its 2026 merchandise-trade growth forecast as supply chains adapted and AI goods demand rose.
- More supplier diversity can reduce disruption exposure but increase inventories, compliance and operating costs.
- Investment is concentrating in advanced technology, energy and strategic manufacturing.
- Pakistan can benefit from supply diversification only through reliable delivery, skills, logistics and trade facilitation.
Why ‘reshoring’ is an incomplete description
A multinational may move one stage of production from a distant supplier while retaining components and equipment sourced from several countries. Measuring the final assembly address tells only part of the story. Modern manufacturing networks are built around intermediate inputs, specialized suppliers, intellectual property and reliable services.
A factory can be geographically close but commercially fragile if critical components still depend on a distant chokepoint. Conversely, a geographically dispersed supplier network can be resilient when sourcing is genuinely diversified and logistics are transparent. Resilience is therefore a property of the entire chain, not merely the location of the last factory.
Trade policy makes this more complex. Tariffs can favour domestic assembly, but firms may still need to import machinery or raw materials. Origin requirements can alter supplier choice. Export restrictions on strategically important technologies can reshape both markets and the timing of investment. These effects should be evaluated product by product rather than described as one global trend.
What the latest trade data actually say
The WTO’s October trade report revised 2026 merchandise trade growth to 3.9%, from 1.9% in its March baseline. It also lowered the 2026 forecast for commercial services trade growth to 3.3%, compared with an earlier 4.8%, with travel affected by the conflict and higher fuel costs. These are different trade categories; stronger goods growth should not be presented as evidence that air travel or every cross-border service is booming.
AI-enabling goods accounted for 47% of merchandise trade-value growth in the first half of 2026, the WTO reports. Technology’s outsized contribution explains part of why trade can appear surprisingly healthy while many importers and tourism businesses are struggling. It also highlights concentration: the countries supplying equipment and components capture gains unavailable to exporters outside those networks.
The WTO’s forecast is conditional. A further disruption in energy markets or a material reassessment of AI investment could change it. Both policymakers and businesses need contingency plans rather than a single straight-line prediction.
Four models of supply-chain redesign
| Strategy | Main objective | Benefit | Hidden cost |
|---|---|---|---|
| Nearshoring | Shorter delivery distance | Lower transit time | May sacrifice supplier specialization |
| Friend-shoring | Reduce geopolitical restrictions | Greater policy predictability | Narrower pool of eligible suppliers |
| Multi-sourcing | Maintain alternatives | Less exposure to one supplier | Higher qualification and management expense |
| Regional hub-and-spoke | Serve several markets from one network | Scale plus regional flexibility | Hub and transport chokepoints remain |
Original conceptual framework. Actual results depend on product, geography and regulation.
The choice depends on what failure costs. A clothing retailer may optimize replenishment speed; a medical-equipment producer may place higher weight on product certification and continuity; a semiconductor user may prioritize access to specialized fabrication. Applying the same sourcing formula to all three would be poor strategy.
A useful model is expected total cost: normal production and shipping costs plus the likely cost of interruption, inventory, financing and regulatory compliance. This is harder to estimate than a unit factory price, but it reflects the risk firms are actually trying to manage.
The investment map is changing faster than most export maps
Companies announce projects before factories become operational. A new plant may require years of permits, construction, utilities, workforce recruitment and supplier qualification. Analysts should therefore separate announced projects, committed spending and actual export shipments.
The UNCTAD World Investment Report 2026 found that global FDI rose to $1.6 trillion in 2025, but was concentrated. Strategic sectors represented 44% of announced greenfield project values, compared with 16% in 2020. This measure tracks the announced value of new projects, not proof that 44% of operating global factories have moved.
The report underscores an uncomfortable problem for smaller economies: courting a strategic investor can require large infrastructure commitments and incentives, while the future employment and technology spillovers remain uncertain. Governments should publish transparent project evaluations rather than compete blindly in subsidy auctions.
Asia is a network, not a single destination
Asian economies occupy different positions in the trade system. Some supply highly specialized chips and equipment. Others offer large-scale assembly, raw materials, logistics or business services. Supply-chain diversification may benefit a secondary production location without displacing the original supplier, because firms often need both sites.
There is also a misconception that supply-chain relocation always means lower-cost labour replacing higher-cost labour. Today, electricity reliability, supplier density, customs efficiency, quality control and geopolitical access can matter as much as hourly wages. Automation can further lower labour’s share of production costs while raising the importance of engineering and maintenance skills.
The WTO’s trade analysis provides a useful check on sweeping narratives: adaptive global supply chains have contributed to stronger-than-anticipated merchandise trade even during the year’s disruption. A more regional structure may coexist with rising worldwide flows of intermediate and capital goods.
Pakistan’s opportunity—and the execution test
Pakistan has reasons to pursue export diversification, but not to assume that geopolitical shifts automatically create orders. International buyers require consistent quality, contract enforcement, dependable energy, timely delivery, predictable taxation and credible documentation. A production location wins repeat business only when the entire operating system performs.
For apparel and textiles, faster customs processing, reliable raw-material access and improvements in compliance can matter greatly. For higher-value engineering exports, testing facilities, supplier certification and technical training are essential. For digital services, payment access, security and customer trust form a different kind of supply chain.
The IMF’s October 2026 Pakistan assessment calls for stronger competition, fewer trade barriers, improved public-sector governance and more cost-efficient energy. These reforms directly influence whether Pakistan can become a viable alternative supplier.
A realistic programme should begin with the sectors in which firms already have export relationships and can upgrade quality or delivery. Public policy then needs to remove obstacles that are common across many firms: unstable electricity, unnecessary permits, costly logistics and low access to export finance.
How executives should stress-test their sourcing strategy
First, map suppliers beyond the first tier. A company can have three direct vendors that all rely on the same factory upstream. Second, identify single points of failure in ports, energy, communications and financing. Third, quantify the working-capital cost of larger inventories. Fourth, model how tariffs and exchange rates change final delivered cost. Fifth, test alternative suppliers before an emergency rather than during one.
The objective is not to eliminate all exposure; that is usually impossible. It is to build enough visibility and flexibility that a temporary interruption does not trigger an expensive production shutdown. Companies should also avoid imposing excessive diversification costs on low-risk items when bottlenecks elsewhere would be more damaging.
Why resilience has a price—but also a payoff
Resilience spending should not be confused with inefficiency. Maintaining a qualified secondary supplier costs money even when the primary supplier operates normally. The economic benefit appears only when a disruption occurs and orders can continue. Governments and firms therefore need to weigh the cost of redundancy against losses from shutdowns, not insist that the lowest invoice price is always optimal.
The opposite mistake is equally serious. A blanket domestic-content rule can force firms to buy expensive inputs without meaningfully reducing exposure, especially where the local supplier still relies on imported components or fuel. The IMF’s October global outlook identifies trade tensions as a potential downside risk; it is not an argument for indiscriminate barriers. Policy should focus on the specific weakness it is designed to address.
Energy infrastructure offers a useful case study. The IEA’s October ASEAN review shows that the region relies on a diverse mix of domestic resources, cross-border supplies and imported fuels. Even a factory producing entirely for a nearby market is exposed if its electricity supply depends on a fragile gas-import route. Trade and energy security therefore need to be planned together.
There is also a development-finance dimension. The UN DESA discussion of the Middle East conflict’s effects highlights how shocks can squeeze financing and investment in lower-income economies. A supplier moving production to a new country does not automatically overcome those financing constraints. Ports, power, quality assurance and working capital need investment before export orders can scale.
Finally, track realized results. UNCTAD’s investment overview demonstrates how strategic investment has become concentrated; the question for recipients is how much translates into operating capacity and domestic supplier development. Governments should publish completed project milestones and the extent of local procurement, rather than count memoranda of understanding as finished factories.
Risks and uncertainties
Trade forecasts can be revised. Supply-chain projects may be delayed or cancelled, and political preferences can change after elections or negotiations. More local production may reduce certain transport risks but increase consumer costs. Friend-shoring can strengthen trust within blocs while fragmenting markets between them. Trade-flow data cannot, on their own, establish the motives behind a company’s sourcing decisions.
What deserves close monitoring is the share of intermediate goods traded, supplier concentration, customs performance, announced versus completed projects, logistics reliability and whether new locations develop an ecosystem of supporting firms. Those measures reveal more than the headline count of relocated factories.
Frequently asked questions
What is nearshoring?
Nearshoring is the movement of production or service activity closer to the customer or final market, often to shorten lead times and reduce transportation exposure.
What is friend-shoring?
It describes sourcing or investment preferences influenced by geopolitical alignment and the desire for dependable international relationships.
Is globalization ending in 2026?
No simple evidence supports that claim. WTO forecasts still show expanding goods trade, but its composition and geography are shifting.
Why is AI relevant to global trade?
AI infrastructure increases demand for semiconductors, servers, electrical equipment and related components, influencing international goods flows.
Do shorter supply chains always reduce costs?
No. A shorter route can reduce delay risk but may increase production prices, capital spending or supplier concentration.
How can Pakistan attract more supply-chain investment?
By improving energy reliability, customs speed, quality assurance, logistics, technical skills and the consistency of trade rules.
Conclusion
The new geography of trade is being defined less by the end of globalization than by the price businesses are willing to pay for reliability. The winners will not necessarily be those closest to customers or those offering the lowest wages. They will be countries and suppliers that combine credible delivery, competitive costs, diversified inputs and predictable policy. That is a demanding agenda—but a useful one for Asia and Pakistan.
Discover more from The Economy
Subscribe to get the latest posts sent to your email.

The WTO sees expanding goods trade but an uneven recovery in services. Pakistan needs to distinguish rising global transaction volumes from guaranteed demand for its own export mix. This feature explains the mechanisms, risks and practical decisions that matter through 2027, with particular attention to Pakistan’s different exposure to energy prices, external financing, global trade and AI investment.
At a glance
- World output is forecast to rise, but opportunities and costs are uneven across countries.
- Global inflation forecasts do not predict household prices in Pakistan.
- The AI capital expenditure cycle lifts trade in electronics but may not translate into productivity gains everywhere.
- Pakistan’s IMF staff-level agreement is a milestone, not final Board approval.
- Stronger exports, competitive energy, fiscal credibility and skills are essential to durable growth.
The verified starting point: what the numbers actually say
The IMF October 2026 World Economic Outlook projects global growth of 3.1% in calendar 2026 and 3.4% in calendar 2027, alongside global headline inflation of 4.7% and 4.1%, respectively. Its statistical cutoff is 1 October 2026. The WTO October 2026 trade outlook projects merchandise trade volume growth of 3.9% in 2026 and 4.1% in 2027, versus commercial-services trade volume growth of 3.3% and 6.4%. These are forecasts from different statistical systems, not interchangeable growth measures.
For Pakistan, the IMF Pakistan October 7 staff-level agreement estimated FY2026 growth of 3.6%, September headline inflation of approximately 10.3%, and gross reserves near $21.5 billion at end-September. The fourth EFF review and third RSF review had reached staff-level agreement only, pending IMF Executive Board approval as of the release. Pakistan’s fiscal years run July–June; IMF global growth figures refer to calendar years.
| Indicator | 2026 | 2027 | Important distinction |
|---|---|---|---|
| IMF world GDP growth | 3.1% | 3.4% | Calendar-year projection |
| IMF world headline inflation | 4.7% | 4.1% | Global estimate, not Pakistan CPI |
| WTO goods trade volume growth | 3.9% | 4.1% | Real volume, not nominal trade value |
| WTO commercial services volume growth | 3.3% | 6.4% | Conditional rebound, not guaranteed |
The World Bank June 2026 Global Economic Prospects provides an earlier comparison framework, but its publication date and methodology differ from the October IMF and WTO releases. A thoughtful analysis should compare like with like and should never treat projections as realized outcomes. For a Pakistan-focused story, the crucial question is how global conditions enter domestic economic life.
Why this story matters now
The WTO October 2026 executive summary says AI-enabling goods accounted for 47% of year-on-year growth in the value of world merchandise trade during the first half of 2026. That does not mean 47% of all merchandise trade was AI-related. It identifies a contribution to growth, and in nominal value terms. The same source notes that AI-enabling goods trade rose 67% year-on-year in that period. These figures show how a narrow technology cycle can make global trade appear stronger even as other sectors struggle.
Meanwhile the Reuters October 2026 IMF annual meetings reports persistent concern about global financial risks, geopolitical disruptions and the uneven sharing of AI gains. The Reuters October 2026 Asian growth describes a region where technology investment supports some exporters while energy costs and higher yields challenge others. Pakistan is therefore exposed simultaneously to a potential technology opportunity and to more conventional fuel, financing and trade vulnerabilities.
Why the WTO raised its goods forecast
For why the wto raised its goods forecast, Trade resilience is not evenly shared. Diversion can reward suppliers with dependable shipping, certifications and capacity, while uncompetitive producers may see no benefit at all. The relevance of a global rebound depends on what a country makes and whether buyers can switch suppliers.
This matters for economic decision-making because firms and households cannot adjust instantaneously when conditions shift. Prices, contracts, worker skills and financial obligations move on different schedules. Analysts should identify the timetable, who bears the immediate cost, and who may capture the longer-term benefit.
A credible implementation plan requires named institutions, measurable indicators and regular public reporting. The point is not to promise an effortless transition; it is to make policy options concrete enough to compare their benefits and trade-offs.
Pakistan-specific decision test. For why the wto raised its goods forecast, ask four questions: (1) Which import cost, export opportunity, credit channel or productivity constraint is affected? (2) Which groups face the first-round effects? (3) What could policymakers or firms change within six months? (4) Which published indicator would demonstrate improvement rather than merely announce activity?
What to monitor: (i) official monthly or quarterly data; (ii) movements in export receipts and import bills; (iii) price changes versus changes in physical volumes; (iv) borrowing and working-capital costs; and (v) job quality and household purchasing power. A single monthly reading can be noisy. Comparing several releases helps distinguish a trend from a short-lived disturbance.
Services are a different story
For services are a different story, Pakistan must distinguish nominal export revenue, which can rise because of price changes, from real production volume and domestic value added. A stronger textile invoice is less meaningful if expensive imported energy and materials absorb the gain.
This matters for economic decision-making because firms and households cannot adjust instantaneously when conditions shift. Prices, contracts, worker skills and financial obligations move on different schedules. Analysts should identify the timetable, who bears the immediate cost, and who may capture the longer-term benefit.
A credible implementation plan requires named institutions, measurable indicators and regular public reporting. The point is not to promise an effortless transition; it is to make policy options concrete enough to compare their benefits and trade-offs.
Pakistan-specific decision test. For services are a different story, ask four questions: (1) Which import cost, export opportunity, credit channel or productivity constraint is affected? (2) Which groups face the first-round effects? (3) What could policymakers or firms change within six months? (4) Which published indicator would demonstrate improvement rather than merely announce activity?
What to monitor: (i) official monthly or quarterly data; (ii) movements in export receipts and import bills; (iii) price changes versus changes in physical volumes; (iv) borrowing and working-capital costs; and (v) job quality and household purchasing power. A single monthly reading can be noisy. Comparing several releases helps distinguish a trend from a short-lived disturbance.
Trade diversion versus real competitiveness
For trade diversion versus real competitiveness, Frequent data on delivery times, rejected shipments and repeat orders can help policymakers determine whether export incentives translate into durable commercial relationships rather than short-lived volume spikes.
This matters for economic decision-making because firms and households cannot adjust instantaneously when conditions shift. Prices, contracts, worker skills and financial obligations move on different schedules. Analysts should identify the timetable, who bears the immediate cost, and who may capture the longer-term benefit.
A credible implementation plan requires named institutions, measurable indicators and regular public reporting. The point is not to promise an effortless transition; it is to make policy options concrete enough to compare their benefits and trade-offs.
Pakistan-specific decision test. For trade diversion versus real competitiveness, ask four questions: (1) Which import cost, export opportunity, credit channel or productivity constraint is affected? (2) Which groups face the first-round effects? (3) What could policymakers or firms change within six months? (4) Which published indicator would demonstrate improvement rather than merely announce activity?
What to monitor: (i) official monthly or quarterly data; (ii) movements in export receipts and import bills; (iii) price changes versus changes in physical volumes; (iv) borrowing and working-capital costs; and (v) job quality and household purchasing power. A single monthly reading can be noisy. Comparing several releases helps distinguish a trend from a short-lived disturbance.
Tariffs and the limits of headline access
For tariffs and the limits of headline access, Trade resilience is not evenly shared. Diversion can reward suppliers with dependable shipping, certifications and capacity, while uncompetitive producers may see no benefit at all. The relevance of a global rebound depends on what a country makes and whether buyers can switch suppliers.
This matters for economic decision-making because firms and households cannot adjust instantaneously when conditions shift. Prices, contracts, worker skills and financial obligations move on different schedules. Analysts should identify the timetable, who bears the immediate cost, and who may capture the longer-term benefit.
A credible implementation plan requires named institutions, measurable indicators and regular public reporting. The point is not to promise an effortless transition; it is to make policy options concrete enough to compare their benefits and trade-offs.
Pakistan-specific decision test. For tariffs and the limits of headline access, ask four questions: (1) Which import cost, export opportunity, credit channel or productivity constraint is affected? (2) Which groups face the first-round effects? (3) What could policymakers or firms change within six months? (4) Which published indicator would demonstrate improvement rather than merely announce activity?
What to monitor: (i) official monthly or quarterly data; (ii) movements in export receipts and import bills; (iii) price changes versus changes in physical volumes; (iv) borrowing and working-capital costs; and (v) job quality and household purchasing power. A single monthly reading can be noisy. Comparing several releases helps distinguish a trend from a short-lived disturbance.
Trade reform priorities through 2027
For trade reform priorities through 2027, Pakistan must distinguish nominal export revenue, which can rise because of price changes, from real production volume and domestic value added. A stronger textile invoice is less meaningful if expensive imported energy and materials absorb the gain.
This matters for economic decision-making because firms and households cannot adjust instantaneously when conditions shift. Prices, contracts, worker skills and financial obligations move on different schedules. Analysts should identify the timetable, who bears the immediate cost, and who may capture the longer-term benefit.
A credible implementation plan requires named institutions, measurable indicators and regular public reporting. The point is not to promise an effortless transition; it is to make policy options concrete enough to compare their benefits and trade-offs.
Pakistan-specific decision test. For trade reform priorities through 2027, ask four questions: (1) Which import cost, export opportunity, credit channel or productivity constraint is affected? (2) Which groups face the first-round effects? (3) What could policymakers or firms change within six months? (4) Which published indicator would demonstrate improvement rather than merely announce activity?
What to monitor: (i) official monthly or quarterly data; (ii) movements in export receipts and import bills; (iii) price changes versus changes in physical volumes; (iv) borrowing and working-capital costs; and (v) job quality and household purchasing power. A single monthly reading can be noisy. Comparing several releases helps distinguish a trend from a short-lived disturbance.
Policy options: three alternative paths, not numerical forecasts
| Scenario | Assumptions | Implications for Pakistan | Early warning or confirmation |
|---|---|---|---|
| More favorable | Energy costs stabilize; export markets remain open; AI use generates measurable efficiency | Space for investment, steadier purchasing power and stronger services exports | Export orders, real income and private investment improve together |
| Central case | Global growth follows the broad institutional outlook; commodity and funding pressures fluctuate | Gradual recovery with uneven gains across sectors | Stable external balances without a broad productivity surge |
| Adverse | Energy disruptions persist; financing costs rise; AI investment is repriced | Imports become more costly, credit tighter and fiscal choices harder | Reserves, inflation expectations and financing costs weaken at once |
These are qualitative editorial scenarios, not probabilities assigned by an econometric model. Their value lies in clarifying which evidence would require an updated judgment. The IMF October 2026 World Economic Outlook explicitly emphasizes downside risks involving conflict, trade tension, debt and reassessment of AI expectations.
A practical action agenda
For policymakers, the first responsibility is to protect hard-won macroeconomic stability while removing barriers to productivity. Regulatory predictability, tax administration, targeted social protection and transparent energy decisions are more useful than shifting incentives that are impossible for businesses to plan around. The IMF Pakistan 2026 country report identifies revenue mobilization, reform of state enterprises, energy-sector viability and improvements in human capital as linked policy priorities.
For exporters, resilience means identifying where demand is growing, investing in reliable delivery and obtaining credible certifications. Export strategies should track volumes, domestic value added and customer retention; gross receipts alone do not disclose profitability. For small businesses, the practical priority is to map exposure to fuel, electricity, imports and foreign-exchange requirements and to stress-test cash flows before making expansion commitments.
For households, risk management begins with an affordable budget, attention to debt servicing and a realistic distinction between nominal wage gains and purchasing power. For workers, portable skills and credible training can expand options across changing industries. None of this makes external shocks harmless; it simply offers concrete ways to be less exposed.
How this analysis differs from generic global coverage
Major international reporting is indispensable for establishing what happened. The Reuters October 2026 WTO briefing emphasizes the boost from AI to merchandise trade and the pressure of geopolitical disruption. Institutional releases provide detailed projections. This article goes a step further by asking how those macroeconomic signals might translate into local import costs, export competitiveness, employment, household budgets and reform choices. It is an interpretation of attributed evidence, not a claim of exclusive interviews or original field reporting.
The difference is particularly relevant for Pakistan because a global technology boom may coincide with higher costs for countries that import fuel but do not manufacture the equipment in highest demand. No serious strategy should assume that a worldwide headline rate automatically delivers the same benefits locally.
Frequently asked questions
What is the IMF’s global growth forecast for 2027?
The IMF’s October 2026 World Economic Outlook projects 3.4% global GDP growth in 2027, following 3.1% in 2026. These are calendar-year forecasts and may be revised as new data becomes available. See the IMF October 2026 World Economic Outlook.
Is global inflation expected to fall in 2027?
Yes, the October IMF forecast projects global headline inflation easing from 4.7% in 2026 to 4.1% in 2027. That describes the world aggregate and does not imply that prices in Pakistan will fall in absolute terms.
Is Pakistan’s latest IMF financing already approved?
The 7 October 2026 IMF release announced staff-level agreement for the fourth EFF and third RSF reviews, subject to Executive Board approval. The release should not be described as a completed Board decision. See the IMF Pakistan October 7 staff-level agreement.
Will AI investment create jobs in Pakistan?
It could create demand for implementation, software services and specialist support, while also changing tasks in existing occupations. The result depends on skills, investment, electricity reliability and competitive access to customers. No credible source guarantees a particular employment gain.
Does the WTO predict rapid growth in all kinds of trade?
No. Its October outlook differentiates merchandise volume growth from commercial-services volume growth and notes uneven performance by sector and region. Read the WTO October 2026 executive summary.
What should Pakistani companies monitor through 2027?
Export order books, input costs, electricity reliability, financing terms, exchange-rate conditions and customer demand are more operationally useful than a single global growth figure. Businesses should compare these against their own cash flows and margins.
Conclusion: the decisive issue is transmission, not the headline
The WTO sees expanding goods trade but an uneven recovery in services. Pakistan needs to distinguish rising global transaction volumes from guaranteed demand for its own export mix. The balance of risks is mixed: advanced technology can expand world production and trade, but it does not neutralize an energy shock or a financing squeeze. For Pakistan, policy credibility, internationally competitive exports and productivity-enhancing investment will determine how much of a fragile global expansion becomes better living standards at home.
Discover more from The Economy
Subscribe to get the latest posts sent to your email.

Global growth is not the same as broad prosperity. Pakistan’s outcomes will depend less on the global average than on the channels through which external demand, energy, financing, and technology influence local firms. This feature explains the mechanisms, risks and practical decisions that matter through 2027, with particular attention to Pakistan’s different exposure to energy prices, external financing, global trade and AI investment.
At a glance
- World output is forecast to rise, but opportunities and costs are uneven across countries.
- Global inflation forecasts do not predict household prices in Pakistan.
- The AI capital expenditure cycle lifts trade in electronics but may not translate into productivity gains everywhere.
- Pakistan’s IMF staff-level agreement is a milestone, not final Board approval.
- Stronger exports, competitive energy, fiscal credibility and skills are essential to durable growth.
The verified starting point: what the numbers actually say
The IMF October 2026 World Economic Outlook projects global growth of 3.1% in calendar 2026 and 3.4% in calendar 2027, alongside global headline inflation of 4.7% and 4.1%, respectively. Its statistical cutoff is 1 October 2026. The WTO October 2026 trade outlook projects merchandise trade volume growth of 3.9% in 2026 and 4.1% in 2027, versus commercial-services trade volume growth of 3.3% and 6.4%. These are forecasts from different statistical systems, not interchangeable growth measures.
For Pakistan, the IMF Pakistan October 7 staff-level agreement estimated FY2026 growth of 3.6%, September headline inflation of approximately 10.3%, and gross reserves near $21.5 billion at end-September. The fourth EFF review and third RSF review had reached staff-level agreement only, pending IMF Executive Board approval as of the release. Pakistan’s fiscal years run July–June; IMF global growth figures refer to calendar years.
| Indicator | 2026 | 2027 | Important distinction |
|---|---|---|---|
| IMF world GDP growth | 3.1% | 3.4% | Calendar-year projection |
| IMF world headline inflation | 4.7% | 4.1% | Global estimate, not Pakistan CPI |
| WTO goods trade volume growth | 3.9% | 4.1% | Real volume, not nominal trade value |
| WTO commercial services volume growth | 3.3% | 6.4% | Conditional rebound, not guaranteed |
The World Bank June 2026 Global Economic Prospects provides an earlier comparison framework, but its publication date and methodology differ from the October IMF and WTO releases. A thoughtful analysis should compare like with like and should never treat projections as realized outcomes. For a Pakistan-focused story, the crucial question is how global conditions enter domestic economic life.
Why this story matters now
The WTO October 2026 executive summary says AI-enabling goods accounted for 47% of year-on-year growth in the value of world merchandise trade during the first half of 2026. That does not mean 47% of all merchandise trade was AI-related. It identifies a contribution to growth, and in nominal value terms. The same source notes that AI-enabling goods trade rose 67% year-on-year in that period. These figures show how a narrow technology cycle can make global trade appear stronger even as other sectors struggle.
Meanwhile the Reuters October 2026 IMF annual meetings reports persistent concern about global financial risks, geopolitical disruptions and the uneven sharing of AI gains. The Reuters October 2026 Asian growth describes a region where technology investment supports some exporters while energy costs and higher yields challenge others. Pakistan is therefore exposed simultaneously to a potential technology opportunity and to more conventional fuel, financing and trade vulnerabilities.
Why the headline growth rate hides divergence
For why the headline growth rate hides divergence, Growth averages blur distribution. A country manufacturing sought-after electronics can gain from a technology upcycle while an energy importer faces a larger fuel invoice. That contrast explains why Pakistan needs an exposure-weighted reading of international forecasts rather than simply celebrating a higher headline GDP projection.
This matters for economic decision-making because firms and households cannot adjust instantaneously when conditions shift. Prices, contracts, worker skills and financial obligations move on different schedules. Analysts should identify the timetable, who bears the immediate cost, and who may capture the longer-term benefit.
A credible implementation plan requires named institutions, measurable indicators and regular public reporting. The point is not to promise an effortless transition; it is to make policy options concrete enough to compare their benefits and trade-offs.
Pakistan-specific decision test. For why the headline growth rate hides divergence, ask four questions: (1) Which import cost, export opportunity, credit channel or productivity constraint is affected? (2) Which groups face the first-round effects? (3) What could policymakers or firms change within six months? (4) Which published indicator would demonstrate improvement rather than merely announce activity?
What to monitor: (i) official monthly or quarterly data; (ii) movements in export receipts and import bills; (iii) price changes versus changes in physical volumes; (iv) borrowing and working-capital costs; and (v) job quality and household purchasing power. A single monthly reading can be noisy. Comparing several releases helps distinguish a trend from a short-lived disturbance.
Pakistan’s four exposure channels
For pakistan’s four exposure channels, The most useful indicator is not one number but a sequence: orders received by exporters, import bills, financial inflows, electricity charges and jobs created. These measures reach families at different speeds, which is why apparently stable GDP figures can coexist with a sense of economic pressure.
This matters for economic decision-making because firms and households cannot adjust instantaneously when conditions shift. Prices, contracts, worker skills and financial obligations move on different schedules. Analysts should identify the timetable, who bears the immediate cost, and who may capture the longer-term benefit.
A credible implementation plan requires named institutions, measurable indicators and regular public reporting. The point is not to promise an effortless transition; it is to make policy options concrete enough to compare their benefits and trade-offs.
Pakistan-specific decision test. For pakistan’s four exposure channels, ask four questions: (1) Which import cost, export opportunity, credit channel or productivity constraint is affected? (2) Which groups face the first-round effects? (3) What could policymakers or firms change within six months? (4) Which published indicator would demonstrate improvement rather than merely announce activity?
What to monitor: (i) official monthly or quarterly data; (ii) movements in export receipts and import bills; (iii) price changes versus changes in physical volumes; (iv) borrowing and working-capital costs; and (v) job quality and household purchasing power. A single monthly reading can be noisy. Comparing several releases helps distinguish a trend from a short-lived disturbance.
What the latest IMF agreement does and does not mean
For what the latest imf agreement does and does not mean, Economic resilience is the capacity to manage adverse shocks without repeatedly disrupting investment and consumption. Predictable policy, transparent fiscal choices and adequate external liquidity matter alongside short-term growth acceleration.
This matters for economic decision-making because firms and households cannot adjust instantaneously when conditions shift. Prices, contracts, worker skills and financial obligations move on different schedules. Analysts should identify the timetable, who bears the immediate cost, and who may capture the longer-term benefit.
A credible implementation plan requires named institutions, measurable indicators and regular public reporting. The point is not to promise an effortless transition; it is to make policy options concrete enough to compare their benefits and trade-offs.
Pakistan-specific decision test. For what the latest imf agreement does and does not mean, ask four questions: (1) Which import cost, export opportunity, credit channel or productivity constraint is affected? (2) Which groups face the first-round effects? (3) What could policymakers or firms change within six months? (4) Which published indicator would demonstrate improvement rather than merely announce activity?
What to monitor: (i) official monthly or quarterly data; (ii) movements in export receipts and import bills; (iii) price changes versus changes in physical volumes; (iv) borrowing and working-capital costs; and (v) job quality and household purchasing power. A single monthly reading can be noisy. Comparing several releases helps distinguish a trend from a short-lived disturbance.
What businesses should prepare for
For what businesses should prepare for, Growth averages blur distribution. A country manufacturing sought-after electronics can gain from a technology upcycle while an energy importer faces a larger fuel invoice. That contrast explains why Pakistan needs an exposure-weighted reading of international forecasts rather than simply celebrating a higher headline GDP projection.
This matters for economic decision-making because firms and households cannot adjust instantaneously when conditions shift. Prices, contracts, worker skills and financial obligations move on different schedules. Analysts should identify the timetable, who bears the immediate cost, and who may capture the longer-term benefit.
A credible implementation plan requires named institutions, measurable indicators and regular public reporting. The point is not to promise an effortless transition; it is to make policy options concrete enough to compare their benefits and trade-offs.
Pakistan-specific decision test. For what businesses should prepare for, ask four questions: (1) Which import cost, export opportunity, credit channel or productivity constraint is affected? (2) Which groups face the first-round effects? (3) What could policymakers or firms change within six months? (4) Which published indicator would demonstrate improvement rather than merely announce activity?
What to monitor: (i) official monthly or quarterly data; (ii) movements in export receipts and import bills; (iii) price changes versus changes in physical volumes; (iv) borrowing and working-capital costs; and (v) job quality and household purchasing power. A single monthly reading can be noisy. Comparing several releases helps distinguish a trend from a short-lived disturbance.
The policy choices that determine resilience
For the policy choices that determine resilience, The most useful indicator is not one number but a sequence: orders received by exporters, import bills, financial inflows, electricity charges and jobs created. These measures reach families at different speeds, which is why apparently stable GDP figures can coexist with a sense of economic pressure.
This matters for economic decision-making because firms and households cannot adjust instantaneously when conditions shift. Prices, contracts, worker skills and financial obligations move on different schedules. Analysts should identify the timetable, who bears the immediate cost, and who may capture the longer-term benefit.
A credible implementation plan requires named institutions, measurable indicators and regular public reporting. The point is not to promise an effortless transition; it is to make policy options concrete enough to compare their benefits and trade-offs.
Pakistan-specific decision test. For the policy choices that determine resilience, ask four questions: (1) Which import cost, export opportunity, credit channel or productivity constraint is affected? (2) Which groups face the first-round effects? (3) What could policymakers or firms change within six months? (4) Which published indicator would demonstrate improvement rather than merely announce activity?
What to monitor: (i) official monthly or quarterly data; (ii) movements in export receipts and import bills; (iii) price changes versus changes in physical volumes; (iv) borrowing and working-capital costs; and (v) job quality and household purchasing power. A single monthly reading can be noisy. Comparing several releases helps distinguish a trend from a short-lived disturbance.
Policy options: three alternative paths, not numerical forecasts
| Scenario | Assumptions | Implications for Pakistan | Early warning or confirmation |
|---|---|---|---|
| More favorable | Energy costs stabilize; export markets remain open; AI use generates measurable efficiency | Space for investment, steadier purchasing power and stronger services exports | Export orders, real income and private investment improve together |
| Central case | Global growth follows the broad institutional outlook; commodity and funding pressures fluctuate | Gradual recovery with uneven gains across sectors | Stable external balances without a broad productivity surge |
| Adverse | Energy disruptions persist; financing costs rise; AI investment is repriced | Imports become more costly, credit tighter and fiscal choices harder | Reserves, inflation expectations and financing costs weaken at once |
These are qualitative editorial scenarios, not probabilities assigned by an econometric model. Their value lies in clarifying which evidence would require an updated judgment. The IMF October 2026 World Economic Outlook explicitly emphasizes downside risks involving conflict, trade tension, debt and reassessment of AI expectations.
A practical action agenda
For policymakers, the first responsibility is to protect hard-won macroeconomic stability while removing barriers to productivity. Regulatory predictability, tax administration, targeted social protection and transparent energy decisions are more useful than shifting incentives that are impossible for businesses to plan around. The IMF Pakistan 2026 country report identifies revenue mobilization, reform of state enterprises, energy-sector viability and improvements in human capital as linked policy priorities.
For exporters, resilience means identifying where demand is growing, investing in reliable delivery and obtaining credible certifications. Export strategies should track volumes, domestic value added and customer retention; gross receipts alone do not disclose profitability. For small businesses, the practical priority is to map exposure to fuel, electricity, imports and foreign-exchange requirements and to stress-test cash flows before making expansion commitments.
For households, risk management begins with an affordable budget, attention to debt servicing and a realistic distinction between nominal wage gains and purchasing power. For workers, portable skills and credible training can expand options across changing industries. None of this makes external shocks harmless; it simply offers concrete ways to be less exposed.
How this analysis differs from generic global coverage
Major international reporting is indispensable for establishing what happened. The Reuters October 2026 WTO briefing emphasizes the boost from AI to merchandise trade and the pressure of geopolitical disruption. Institutional releases provide detailed projections. This article goes a step further by asking how those macroeconomic signals might translate into local import costs, export competitiveness, employment, household budgets and reform choices. It is an interpretation of attributed evidence, not a claim of exclusive interviews or original field reporting.
The difference is particularly relevant for Pakistan because a global technology boom may coincide with higher costs for countries that import fuel but do not manufacture the equipment in highest demand. No serious strategy should assume that a worldwide headline rate automatically delivers the same benefits locally.
Frequently asked questions
What is the IMF’s global growth forecast for 2027?
The IMF’s October 2026 World Economic Outlook projects 3.4% global GDP growth in 2027, following 3.1% in 2026. These are calendar-year forecasts and may be revised as new data becomes available. See the IMF October 2026 World Economic Outlook.
Is global inflation expected to fall in 2027?
Yes, the October IMF forecast projects global headline inflation easing from 4.7% in 2026 to 4.1% in 2027. That describes the world aggregate and does not imply that prices in Pakistan will fall in absolute terms.
Is Pakistan’s latest IMF financing already approved?
The 7 October 2026 IMF release announced staff-level agreement for the fourth EFF and third RSF reviews, subject to Executive Board approval. The release should not be described as a completed Board decision. See the IMF Pakistan October 7 staff-level agreement.
Will AI investment create jobs in Pakistan?
It could create demand for implementation, software services and specialist support, while also changing tasks in existing occupations. The result depends on skills, investment, electricity reliability and competitive access to customers. No credible source guarantees a particular employment gain.
Does the WTO predict rapid growth in all kinds of trade?
No. Its October outlook differentiates merchandise volume growth from commercial-services volume growth and notes uneven performance by sector and region. Read the WTO October 2026 executive summary.
What should Pakistani companies monitor through 2027?
Export order books, input costs, electricity reliability, financing terms, exchange-rate conditions and customer demand are more operationally useful than a single global growth figure. Businesses should compare these against their own cash flows and margins.
Conclusion: the decisive issue is transmission, not the headline
Global growth is not the same as broad prosperity. Pakistan’s outcomes will depend less on the global average than on the channels through which external demand, energy, financing, and technology influence local firms. The balance of risks is mixed: advanced technology can expand world production and trade, but it does not neutralize an energy shock or a financing squeeze. For Pakistan, policy credibility, internationally competitive exports and productivity-enhancing investment will determine how much of a fragile global expansion becomes better living standards at home.
Discover more from The Economy
Subscribe to get the latest posts sent to your email.

Neocloud Economics in 2026: GPU Debt, Utilization and Power

What Is a Neocloud? How AI GPU Clouds Work and Compare

Lula Re-elected in 2026: What Changes for the Dollar, Brazilian Stocks, and Interest Rates?

Lula Wins Brazil’s 2026 Election: Five Economic Tests for 2027

SSI November 2026 Payment: Why Benefits Arrive October 30

Russia Sanctions Waiver: What Asian Oil Buyers Gain

Asia Markets Weekly: How Oil, US Yields and the Fed Reach Tokyo, Kuala Lumpur and Karachi

Gold Near $4,000: Buy, Hold or Wait? A Pakistan Tola Price Guide

US 10-Year Treasury Yield Near 5%: The Hidden Cost for Pakistani Investors

Fed Meeting on October 28: Hike or Hold—and Why Pakistan Investors Should Care

Can Pakistan Turn US–Iran Mediation Into an Economic Dividend?

Oil Above $100: How Higher Crude Prices Reach Pakistan’s Rupee, Petrol and Imports

SBP Interest Rate at 11.5%: What Will Decide Pakistan’s Next Policy Move?

The Global South: Debt, Climate Finance and Investment in 2026

Crude Oil & Petroleum Market Analysis: OPEC+ Decisions and Price Forecasts

Top US Convenience Store Chains: Store Counts, EV Charging, and Sales Trends

Algorithmic Dogfights: Why the U.S. and China Must Establish Rules of Engagement for Autonomous Air Power

Who Is Shivon Zilis? The Neuralink Executive at the Center of the Musk–OpenAI Trial

Social Security Extra $90 Deposit: Who Qualifies for the October 2026 Medicare Rebate?

Corporate America Faces a New Debt Test as US Borrowing Costs Surge

Global Economic Outlook 2026: 7 Forces Reshaping Markets, Trade and Business

Gold Price Outlook 2026: The Forces Behind the Forecasts—and What Could Reverse Them

Gold Falls 3.7% as Yields Surge: Is Gold Still a Safe Haven in 2026?

MAS Allocates S$1.45 Billion to Five Asset Managers in Third EQDP Batch: Total Deployment Reaches S$5.4 Billion

Stock Market Today: Dow, S&P 500, and Nasdaq Retreat as Treasury Yields

Anthropic Bans Sustained Abuse of Claude AI Under New Usage Policy Effective November 12, 2026

Geopolitics and Your Portfolio: How International Affairs Move Global Markets

US 10-Year Yield Hits 5.24%: What the Historic Bond Market Sell off Means for Mortgages and Investors
-

 Markets & Finance10 months ago
Top 15 Stocks for Investment in 2026 in PSX: Your Complete Guide to Pakistan’s Best Investment Opportunities
-

 Analysis8 months ago
Johor’s Investment Boom: The Hidden Costs Behind Malaysia’s Most Ambitious Economic Surge
-

 Analysis8 months ago
Top 10 Stocks for Investment in PSX for Quick Returns in 2026
-

 Banks9 months ago
Best Investments in Pakistan 2026: Top 10 Low-Price Shares and Long-Term Picks for the PSX
-

 Analysis9 months ago
Brazil’s Rare Earth Race: US, EU, and China Compete for Critical Minerals as Tensions Rise
-

 Investment10 months ago
Top 10 Mutual Fund Managers in Pakistan for Investment in 2026: A Comprehensive Guide for Optimal Returns
-

 Global Economy10 months ago
15 Most Lucrative Sectors for Investment in Pakistan: A 2025 Data-Driven Analysis
-

 Global Economy10 months ago
Pakistan’s Export Goldmine: 10 Game-Changing Markets Where Pakistani Businesses Are Winning Big in 2025