
Opinion
Singapore Needs a Japan-Korea Value-Up Program to Sustain Market Rally


Singapore’s S$5 billion EQDP has sparked a 27% market rally. Now, a Japan-Korea inspired value-up program could unlock deeper shareholder value and sustain the STI’s momentum into 2027 and beyond.
You might recall the buzz when Singapore’s Monetary Authority unveiled its audacious S$5 billion Equity Market Development Programme in February 2025. With hindsight, it was inevitable—a bold bet on liquidity and local fund management to revive a market that had languished in the shadows of Hong Kong and Tokyo for too long. Fast forward to February 2026, and the Straits Times Index (STI) is trading near record highs around 4,975 points, up 27.79% year-over-year. The EQDP has delivered, at least in its first chapter. Yet as Singapore’s equity market basks in this newfound vibrancy, a crucial question looms: what’s next?
The answer may lie not in more capital injections, but in a complementary reform playbook borrowed from Asia’s recent success stories—Japan’s corporate governance revolution and South Korea’s Value-Up Program. These frameworks have unlocked billions in shareholder value by compelling companies to focus on capital efficiency, return on equity (ROE), and transparent communication with investors. For Singapore, introducing a similar value-up initiative could be the catalyst to sustain the STI’s momentum, deepen institutional investor engagement, and address the structural inefficiencies that have kept valuations subdued despite strong fundamentals.
The EQDP: Audacious, But Not Sufficient
Singapore’s Equity Market Development Programme deserves credit for its ambition and execution. Launched by the Monetary Authority of Singapore (MAS) and Financial Sector Development Fund, the S$5 billion EQDP channels government capital into funds managed by asset managers with proven track records in Singapore equities, particularly small and mid-caps. By late 2025, S$3.95 billion had been allocated across nine managers, including heavyweights like BlackRock, JPMorgan Asset Management, and local champions Fullerton Fund Management.
The program’s ripple effects have been tangible. Daily trading volumes have picked up, IPO activity shows signs of life, and the STI’s 27% gain in 2025 outpaced most regional peers. In November 2025, MAS also unveiled a S$30 million “Value Unlock” package to help listed companies strengthen investor engagement—a positive nod toward shareholder-centric reforms.
Yet for all its merits, the EQDP is fundamentally a demand-side intervention. It pumps liquidity into the market and incentivizes fund managers to deploy capital, but it stops short of addressing the supply-side challenge: how do you get Singapore-listed companies to unlock latent value, improve capital allocation, and prioritize shareholder returns? This is where Japan and Korea’s experiences become instructive.
Japan’s Playbook: From Malaise to Market Resurgence
Japan’s equity market was the poster child for stagnation for decades. The Nikkei 225 languished below its 1989 peak until recently, weighed down by cross-shareholdings, low ROE, and a corporate culture that hoarded cash rather than returning it to shareholders. Then came the Tokyo Stock Exchange’s March 2023 directive—a watershed moment that urged over 3,000 listed companies to disclose plans for raising capital efficiency above their weighted average cost of capital (WACC).
The results have been remarkable. Japan’s Nikkei 225 surged more than 25% in 2023, breaking multi-decade records, and continued its rally into 2024. By late 2024, 86% of companies in the TSE’s Prime market had submitted improvement plans—up from just 49% in December 2023. Japanese firms collectively bought back approximately ¥960 billion (US$65 billion) of stock in 2023, a record for the fourth consecutive year, while dividend increases hit their second-highest level since 1985.
Crucially, the reforms weren’t punitive—they were principle-based. Companies with price-to-book (P/B) ratios below 1.0x were publicly named and encouraged to explain their strategies for value creation. The TSE created incentives for disclosure and penalized laggards through reputational pressure and potential delisting from the Prime market. Institutional investors, emboldened by stewardship codes, began withholding votes from directors at companies with poor governance—a sharp departure from Japan’s historically passive shareholder culture.
The lesson? Government-led nudges, combined with exchange-driven accountability and transparent benchmarking, can reshape corporate behavior and reignite investor confidence.
Korea’s Value-Up Gambit: Tackling the Discount Head-On
South Korea faced a similar conundrum—chronic undervaluation despite hosting world-class companies like Samsung, Hyundai, and SK Hynix. The so-called “Korea Discount” saw the KOSPI trading at a P/B ratio below 1.0x, lagging Japan’s 1.5x and Taiwan’s 3.4x. Family-controlled conglomerates (chaebols) prioritized control and cash hoarding over shareholder returns, partly due to punitive inheritance taxes calculated on company valuations.
In February 2024, South Korea’s Financial Services Commission launched the Corporate Value-Up Program, inspired directly by Japan’s reforms. The program encourages listed companies to voluntarily disclose multi-year plans targeting ROE improvement, capital efficiency, and enhanced shareholder returns. Tax incentives, a dedicated “Korea Value-Up Index” launched in September 2024, and revised stewardship codes provide carrots; reputational pressure and exclusion from benchmarks serve as sticks.
Early results are mixed but promising. By February 2025, 114 companies had participated, and treasury stock cancellations surged 33% from 2022 to 2023 in response to activist pressure. The KOSPI’s performance improved, though political headwinds and chaebol resistance have slowed momentum. Still, the program signals a long-term commitment to aligning corporate behavior with global governance standards.
Singapore’s Case: Strong Fundamentals, Persistent Valuation Gap
Singapore’s equity market shares some structural similarities with pre-reform Japan and Korea, but with unique nuances. The STI trades at a P/B ratio around 1.1x—lower than Japan’s post-reform 1.4x and far below markets like the U.S. or India. Many Singapore-listed firms, particularly government-linked companies (GLCs) and family-controlled entities, exhibit conservative capital allocation, modest dividend payouts, and limited share buybacks despite strong cash flows.
Take DBS Group Holdings, Singapore’s largest bank. It generates robust returns and pays steady dividends (yielding around 5-6%), yet its valuation multiples remain subdued compared to regional banking peers. Similarly, Singapore Technologies Engineering, Keppel, and CapitaLand Investment—all quality franchises—trade at discounts that don’t fully reflect their strategic positioning or balance sheet strength.
Why the disconnect? Part of it is liquidity—Singapore’s market capitalization is dwarfed by Hong Kong and Tokyo, and foreign institutional participation has historically been muted. But another factor is governance: many companies lack explicit shareholder return frameworks, transparent capital allocation policies, or engagement mechanisms that activate investor interest.
The EQDP addresses liquidity by seeding capital into funds focused on Singapore equities, especially small and mid-caps. Fullerton Fund Management’s Singapore Value-Up fund, launched in October 2025 as the first retail offering under EQDP, is a positive step. Yet without a systemic push to improve corporate governance and capital efficiency across the broader market, the gains may plateau.
What a Singapore Value-Up Program Could Look Like
Drawing from Japan and Korea, a Singapore-style value-up program could include the following pillars:
1. Disclosure Requirements for Capital Efficiency
The SGX could mandate that all companies with a P/B ratio below 1.0x (or those in the bottom quartile for ROE) disclose multi-year plans to improve capital efficiency. This isn’t about shaming—it’s about transparency. Companies would outline specific targets (e.g., ROE above cost of equity within three years) and annual progress updates, similar to Japan’s TSE approach.
2. Tax Incentives for Shareholder Returns
Singapore already offers tax rebates for new listings under the EQDP framework. Extending this to companies that commit to sustained dividend growth or share buybacks could incentivize action. Korea’s model of offering enhanced corporate tax deductions for value-up participants could be adapted.
3. Creation of a Singapore Value-Up Index
Mirroring Korea’s September 2024 launch of the Korea Value-Up Index, Singapore could establish a benchmark tracking companies demonstrating strong capital discipline, consistent shareholder returns, and improving ROE. Pension funds, including the Central Provident Fund, could be encouraged to allocate portions of their portfolios to this index, creating a virtuous cycle of capital flowing to well-governed firms.
4. Strengthened Stewardship and Proxy Engagement
Singapore’s institutional investors—sovereign wealth funds, government-linked entities, and asset managers—should play a more active stewardship role. Japan’s success owed much to investor activism and proxy battles, where activists successfully placed directors on boards and pushed for cash repatriation. Singapore could revise its stewardship code to explicitly encourage voting against directors at companies with poor governance or stagnant shareholder returns.
5. Annual “Value Creation Forum”
MAS and SGX could host an annual forum where listed companies present their capital allocation strategies to institutional investors, modeled on Japan’s Corporate Governance Forum. Public recognition for leaders—and scrutiny for laggards—would create reputational incentives.
Risks and Pushback: Learning from Korea’s Struggles
Korea’s experience offers cautionary lessons. Despite the Value-Up Program’s ambition, political uncertainty and chaebol resistance have dampened momentum. The left-leaning opposition’s parliamentary victory in 2024 raised doubts about tax incentives, while family-controlled conglomerates remain wary of reforms that could dilute control or trigger higher inheritance taxes.
Singapore faces analogous challenges. Government-linked companies (GLCs) account for a significant share of the STI’s market cap, and some may resist external pressure to alter long-standing capital allocation practices. Family-controlled firms, particularly those in real estate and commodities, may view enhanced disclosure as intrusive. Regulators must strike a balance—nudging without coercing, incentivizing without penalizing unduly.
Moreover, not all companies need to “unlock value” in the same way. REITs, for instance, already distribute most of their cash flows by mandate. For growth companies reinvesting for scale, lower dividend payouts may be justified. A one-size-fits-all approach risks stifling legitimate corporate strategies.
The Timing Is Right
Singapore’s equity market is at an inflection point. The EQDP has injected momentum, the STI is near record highs, and GDP growth of 4.8% in 2025 underscores economic resilience. Yet without a second-order reform targeting corporate behavior, the rally could stall. Global investors, spoiled for choice amid recovering U.S. tech valuations and China’s reopening narrative, need more than liquidity—they need confidence that Singapore-listed companies will actively work to enhance shareholder value.
Japan’s experience shows that coordinated, principle-based reforms can catalyze a multi-year bull market. Korea’s journey, though incomplete, demonstrates that even imperfect programs can shift corporate culture. For Singapore, the opportunity lies in crafting a value-up program that reflects local realities—respecting the role of GLCs, accommodating diverse ownership structures, and leveraging the city-state’s reputation for regulatory clarity and execution.
MAS’s December 2025 announcement of the “Value Unlock” package, including grants to strengthen investor communications, hints at this direction. But grants alone won’t suffice. What Singapore needs is a comprehensive framework—exchange-driven disclosure mandates, tax incentives, a benchmark index, and empowered institutional stewardship—that aligns the interests of companies, investors, and regulators around a shared goal: sustainable value creation.
Conclusion: From Liquidity to Legacy
The EQDP was a shot in the arm—necessary, timely, and effective. But as any seasoned investor knows, momentum without fundamentals is fleeting. To ensure the STI’s gains are durable and that Singapore’s equity market evolves into a genuine destination for global capital, policymakers must tackle the harder question: how do we get companies to consistently prioritize shareholder value?
Japan and Korea have shown the way. Their value-up programs aren’t perfect, but they’ve catalyzed meaningful change—higher ROE, increased buybacks, better governance, and ultimately, higher valuations. Singapore has the institutional capacity, regulatory credibility, and market sophistication to design an even more effective version.
The next leg-up for Singapore’s market won’t come from more EQDP allocations alone. It will come from companies embracing transparency, improving capital efficiency, and rewarding shareholders—not because they’re forced to, but because the incentives and reputational stakes make it the rational choice. That’s the promise of a Singapore Value-Up Program. And with the STI already surging, the time to act is now.
Sources:
- Monetary Authority of Singapore – EQDP
- MAS Media Release – Review Group Completes Equities Market Review
- MSCI – Have Corporate Reforms in Japan Unlocked Shareholder Value?
- CNBC – Japan’s Nikkei hits all-time high on reforms
- ClearBridge Investments – Governance Reforms Power Japan Forward
- South Korea FSC – Corporate Value-Up Program
- T. Rowe Price – South Korea value-up: Lessons from Japan
- Trading Economics – Singapore Stock Market
- Fullerton Fund Management – Fullerton Singapore Value-Up Launch
- Glass Lewis – Navigating South Korea’s Corporate Value-Up Program
Discover more from The Economy
Subscribe to get the latest posts sent to your email.


Insurance renewal season is landing on households at the worst possible moment: auto insurance quotes are climbing again after a brief 2025 reprieve, health insurance plans on the ACA marketplace are seeing the steepest premium jump since 2018, and inflation in medical, repair, and litigation costs is compounding across every line of coverage simultaneously. This is not a single-cause story. It is three distinct inflationary engines — repair-cost inflation, medical-cost inflation, and legal/regulatory disruption — converging on the same renewal notices at the same time.
Key Takeaways
- Auto insurance premiums are projected to rise in 32 states by the end of 2026, reversing 2025’s national 6% decline, with the average full-coverage premium reaching approximately $2,158–$2,256 annually.
- ACA marketplace health insurance plans show a 26% average premium increase for 2026 — the largest since 2018 — driven by rising hospital costs, GLP-1 weight-management drug spending, and the expiration of enhanced premium tax credits.
- If enhanced subsidies are not extended, marketplace enrollees could see net premium payments more than double, with some households spending over half their income on coverage.
- Employer-sponsored health coverage costs are projected to rise another 6–7% in 2026 after already increasing 5.6% in 2025.
- High-risk driver categories (DUI history, low credit, teen drivers) are seeing disproportionately large increases even in states where average premiums are stabilizing.
Auto Insurance: The 2025 Relief Was Temporary
After auto insurance quotes fell nationally by about 6% in 2025 — with 39 states seeing declines and several cutting rates by more than 20% — 2026 has reversed that trend. Insurify’s midyear data shows 27 states already recording increases in the first half of the year, with 32 states projected to see higher rates by year-end. The average full-coverage premium is tracking toward $2,158–$2,256 annually, a modest 1–3% increase depending on the data source, but the state-level variance tells the real story.
| State Trend | Example States | Driver |
|---|---|---|
| Largest projected increases | Connecticut (+4%), West Virginia (+3%) | Rate “normalization” after historically low pricing |
| Largest historical 3-year increases | Illinois (+41% over 3 years) | Nearly double the national average pace |
| States still seeing relief | New York (-13% past 12 months) | Falling fatal crash rates, improved loss ratios |
| Highest absolute premiums | Washington D.C. (~$4,017/year in 2025) | Density, litigation costs, claims frequency |
Three structural forces are driving the reversal:
- Repair-cost inflation tied to tariffs. Auto insurers have publicly flagged that tariff-driven increases in parts costs have not yet been fully passed through to consumers — meaning 2026 premium filings are likely understating the eventual impact.
- Rising medical/bodily-injury claim costs. Medical inflation has pushed up the cost of bodily injury liability claims substantially through 2024–2026, with higher ER visits and long-term treatment costs flowing directly into liability coverage pricing.
- “Social inflation.” Rising jury awards and legal settlement costs, particularly concentrated in states like Louisiana and Florida, are pushing insurers to reprice risk more aggressively regardless of an individual driver’s claims history.
A Widening Risk-Based Pricing Gap
The most important trend for consumers shopping auto insurance quotes in Q4 2026 is the divergence between low-risk and high-risk pricing. While full-coverage premiums for clean-record drivers dipped modestly, DUI-related premiums jumped roughly 35% and teen driver premiums rose about 17% in the same period. Insurers are moving away from broad, blanket rate hikes toward sharply targeted, risk-based pricing — meaning the “average premium” figure increasingly understates what any specific household will actually pay.
Health Insurance: The Subsidy Cliff Returns
The health insurance plans story for 2026 is dominated by one policy event: the expiration of enhanced Affordable Care Act premium tax credits that have kept marketplace coverage affordable since 2021. The numbers are stark:
| Metric | 2026 Figure |
|---|---|
| Average ACA marketplace premium increase | 26% (30% in federal Healthcare.gov states, 17% in state-run exchanges) |
| Median proposed insurer rate increase | 18% |
| Portion of increase attributable to subsidy-expiration assumptions | ~4 percentage points |
| Potential net premium increase for subsidized enrollees if credits expire fully | 114%+ (more than double) |
| Subsidy eligibility cliff | 400% of Federal Poverty Level ($62,600 individual / $128,600 family of four) |
| Marketplace enrollees currently receiving subsidies | ~87–92% |
This is the largest ACA rate increase since 2018, the last time comparable federal policy uncertainty disrupted the market. The mechanism is a textbook “adverse selection” spiral: as premiums rise for those losing subsidies, healthier enrollees are expected to exit the marketplace at a disproportionately higher rate than sicker enrollees, which pushes insurers to price in an even less healthy risk pool — a dynamic insurers and policy experts have explicitly warned could become a “death spiral” without legislative intervention.
Illustrative case: A 40-year-old in Indianapolis earning $65,000 on a mid-tier Silver plan saw their subsidized monthly premium of $316 (versus an unsubsidized $388) climb sharply once the enhanced credits expired — with some households above the 400% FPL threshold facing bronze-plan costs exceeding half their household income.
Employer-Sponsored Coverage Is Not Immune
While ACA marketplace changes dominate headlines, employer-sponsored health insurance plans are compounding the same underlying cost pressures. Average annual premiums reached roughly $9,300 for single coverage and $27,000 for family coverage in 2025 — up 5.6% — with a further 6–7% increase projected for 2026, driven by specialty drug costs (notably GLP-1 medications), higher utilization, and healthcare wage inflation. Employers passing along even a portion of that increase means higher payroll deductions, higher deductibles, and narrower networks for millions of covered workers who never touch the ACA marketplace at all.
Life Insurance: The Quiet Line in an Inflationary Environment
Term life insurance has been less volatile than auto or health coverage in 2026, but it is not immune to the same underlying cost pressures. Underwriting costs tied to medical examination and actuarial mortality assumptions are gradually reflecting the same medical-cost inflation hitting health insurers, while insurers’ own investment portfolios — sensitive to the same Treasury yield volatility driving mortgage rates — affect how aggressively term life products are priced and how competitively insurers can guarantee long-duration rate locks. For consumers, the practical implication is straightforward: locking in a term life policy sooner rather than later insulates against future underwriting-cost inflation, particularly for buyers over 50, where premiums are most sensitive to medical-cost trends.
A Household Insurance Cost-Management Framework for Q4 2026
| Coverage Type | Primary 2026 Risk | Recommended Action |
|---|---|---|
| Auto insurance | Risk-based repricing; state-level variance | Shop annually; ask specifically about DUI/teen-driver surcharges |
| ACA health insurance | Subsidy-cliff exposure above 400% FPL | Model both subsidized and full-price scenarios before open enrollment |
| Employer health insurance | Passthrough of 6–7% cost growth | Review HSA/FSA contribution levels; evaluate high-deductible tradeoffs |
| Term life insurance | Gradual underwriting-cost inflation | Lock in coverage now rather than deferring to a later renewal cycle |
FAQ
Why are auto insurance quotes rising again in 2026 after falling in 2025? 2025’s rate declines were largely a correction after insurers had already repriced for pandemic-era claims inflation. In 2026, rising repair costs (partly tariff-driven), medical-cost inflation on bodily injury claims, and “social inflation” from rising legal settlements are pushing rates back up in most states.
How much will my ACA health insurance plan premium increase in 2026? The average marketplace premium increase is 26%, but the actual impact depends heavily on your income relative to 400% of the federal poverty level. Enrollees below that threshold retain some subsidy protection; those above it face the full, unsubsidized rate increase.
Is now a good time to buy term life insurance? Yes — underwriting costs are gradually rising alongside broader medical-cost inflation, so locking in a term life policy now generally secures a more favorable long-term rate than waiting for a future renewal cycle.
Which drivers are seeing the biggest auto insurance increases? High-risk categories are seeing disproportionate increases: DUI-related premiums rose roughly 35% and teen driver premiums rose roughly 17% in the most recent reporting period, even in states where average premiums for low-risk drivers were flat or falling.
Discover more from The Economy
Subscribe to get the latest posts sent to your email.

The gap between the best- and worst-monetized content on the same platform, with the same traffic, is not a rounding error — it’s a 10x to 40x multiplier. A finance or insurance page earning $50–$80 RPM from 1,000 visitors sits next to an entertainment page earning $2–$5 from the identical traffic volume. For publishers building in wealth management, macroeconomics, and adjacent financial verticals, understanding — and deliberately engineering for — that gap is the single highest-leverage decision in the monetization stack.
The 2026 CPM Landscape, By Channel
| Channel | Finance-Niche CPM/RPM (2026) | Comparison Baseline |
|---|---|---|
| Display/AdSense (insurance) | $40–$80 RPM (US traffic) | Entertainment: $1–$4 RPM |
| Display/AdSense (finance, broad) | High-tier, comparable band | Recipe/cooking: $2–$5 RPM |
| YouTube (finance/credit cards) | $20–$50 CPM, $10–$25 RPM | Gaming/entertainment: $1–$8 CPM |
| Newsletter — Finance/Investing | $80–$180 CPM (direct), $30–$65 CPM (programmatic) | General-interest newsletters: materially lower |
| Newsletter — Legal | $55–$130 CPM | — |
| Newsletter — B2B SaaS | $50–$120 CPM | — |
The pattern holds across every channel: finance, insurance, legal, and B2B/SaaS content consistently occupies the top CPM tier, while entertainment, gossip, and general lifestyle content sits at the bottom, regardless of which ad platform or format is measured.
Why Financial Content Commands This Premium
Three structural factors explain the gap, and understanding them is what allows a publisher to deliberately position content to capture it rather than stumbling into it:
- High customer lifetime value on the advertiser side. Financial services, software, and B2B companies can justify significantly higher acquisition costs per click or impression because each converted customer is worth thousands of dollars in lifetime revenue — a fundamentally different unit economics than a consumer-goods or entertainment advertiser is working with.
- Purchase-intent signals embedded in the content itself. A reader consuming an article on “best high-yield savings accounts” or “how to open a Roth IRA” is, by definition, closer to a purchase decision than a reader consuming general entertainment content — and programmatic ad systems price that intent signal directly into the CPM.
- Affluent, professionally-engaged demographics. Content targeting professionals, business decision-makers, and active investors delivers an audience composition advertisers will pay a structural premium to reach, independent of the specific article topic.
Sub-Niche Stratification: Not All Finance Content Is Equal
The highest-leverage insight for publishers already operating in finance is that the finance vertical itself is not monolithic — sub-niche selection produces meaningful CPM variance:
- Specificity beats breadth. “Best credit cards for travel rewards 2026” attracts materially more advertiser competition than “general money tips” — the more precisely a piece of content maps to a specific purchase decision, the more advertisers bid to appear against it.
- Audience precision beats audience size. A newsletter serving 3,000 active options traders can command a higher CPM than a general personal-finance newsletter with 30,000 subscribers, because options-trading advertisers (brokerages, trading platforms, specialized data services) will pay a premium for a small, precisely-qualified audience over a large, diffuse one.
- High-value sub-niches within finance include independent registered investment advisors, high-net-worth investors, cryptocurrency traders, options traders, and real estate investors — each representing a distinct advertiser pool with its own premium pricing dynamics.
The Format and Length Lever
Content format materially affects realized CPM independent of topic:
- Longer-form content (8+ minutes on video; substantial word count on text) enables more ad placements per unit of content — on YouTube specifically, videos over 8–10 minutes qualify for mid-roll placements, and a 10-minute video can carry 3–4 mid-roll ad breaks versus a single pre-roll on shorter content.
- Short-form content dramatically underperforms in finance specifically. YouTube Shorts RPM in the finance niche runs 50–100x lower than long-form content — meaning a content strategy overly weighted toward short-form for audience-building purposes can actively suppress realized revenue if not balanced against long-form monetization content.
- This dynamic favors exactly the kind of deep, analytical, long-form content this publication produces — a genuine structural advantage for publishers investing in comprehensive rather than surface-level financial content.
Seasonal Timing: Q4 Concentration
Advertiser spending in financial verticals is not evenly distributed across the year:
- Q4 (October–December) represents the highest-CPM period, driven by advertiser budget cycles and year-end financial-decision content (tax planning, open enrollment, year-end investment moves).
- January consistently registers as the lowest-CPM month — publishers who concentrate their highest-effort content releases in Q1 rather than Q4 are systematically leaving realized revenue on the table.
- The optimal strategy publishes evergreen, audience-building content in Q1–Q3 while reserving peak-performing, highest-investment content for Q4 release, when the same traffic converts to meaningfully higher realized CPM.
E-E-A-T Signals for Financial Content Specifically
Google’s Experience, Expertise, Authoritativeness, and Trustworthiness framework carries outsized weight for financial content under the “Your Money or Your Life” (YMYL) content classification, which subjects financial publishing to stricter quality signals than general content categories:
- Author credentials and bylines matter more for financial content than almost any other vertical — content should be attributed to identifiable authors with relevant background, not published anonymously or under generic “Editorial Team” bylines where genuine expertise can be demonstrated.
- Sourcing to primary institutions — the IMF, World Bank, Federal Reserve, SEC, SSA — carries direct SEO and trust benefit for financial content specifically, both for search ranking and for advertiser brand-safety screening.
- Currency and update cadence matter disproportionately for financial content, since stale financial data (outdated interest rates, superseded tax brackets, old market data) both damages user trust and can trigger content-freshness penalties in search ranking.
Programmatic vs. Direct: The Allocation Decision
The newsletter-CPM data illustrates a broader principle applicable across channels: direct sponsorship deals consistently command 2–3x the CPM of programmatic fill in premium financial verticals ($80–$180 direct vs. $30–$65 programmatic for finance newsletters). The optimal monetization stack for a financial publisher therefore layers:
- Direct advertiser relationships for the highest-value inventory (top placements, dedicated sends, sponsored deep-dives), capturing the premium direct CPM.
- Programmatic/real-time bidding as a fill layer beneath direct sales, ensuring no inventory goes unmonetized while direct relationships are being built or between direct campaign flights.
- Affiliate and product-referral revenue stacked on top of ad revenue — particularly for content around specific financial products (credit cards, brokerages, savings accounts) where affiliate commissions can meaningfully exceed pure ad-impression revenue on high-intent content.
Finance and insurance content commands the highest CPMs of any digital publishing niche in 2026, with display RPMs of $40-80, YouTube CPMs of $20-50, and direct newsletter sponsorships reaching $80-180 CPM — a 10 to 40x premium over general-interest content, driven by high advertiser customer lifetime value and strong purchase-intent signals.”
Financial publishers who treat CPM optimization as a deliberate content-strategy input — not an afterthought handled purely by the ad-tech stack — can realistically capture a 10–40x revenue multiple over general-interest content with comparable traffic. The concrete levers are sub-niche specificity, long-form format (particularly given finance’s uniquely poor short-form monetization), Q4-weighted publishing calendars, direct-sales allocation for premium inventory, and E-E-A-T-aligned authorship and sourcing — all of which compound rather than operate independently.
Discover more from The Economy
Subscribe to get the latest posts sent to your email.
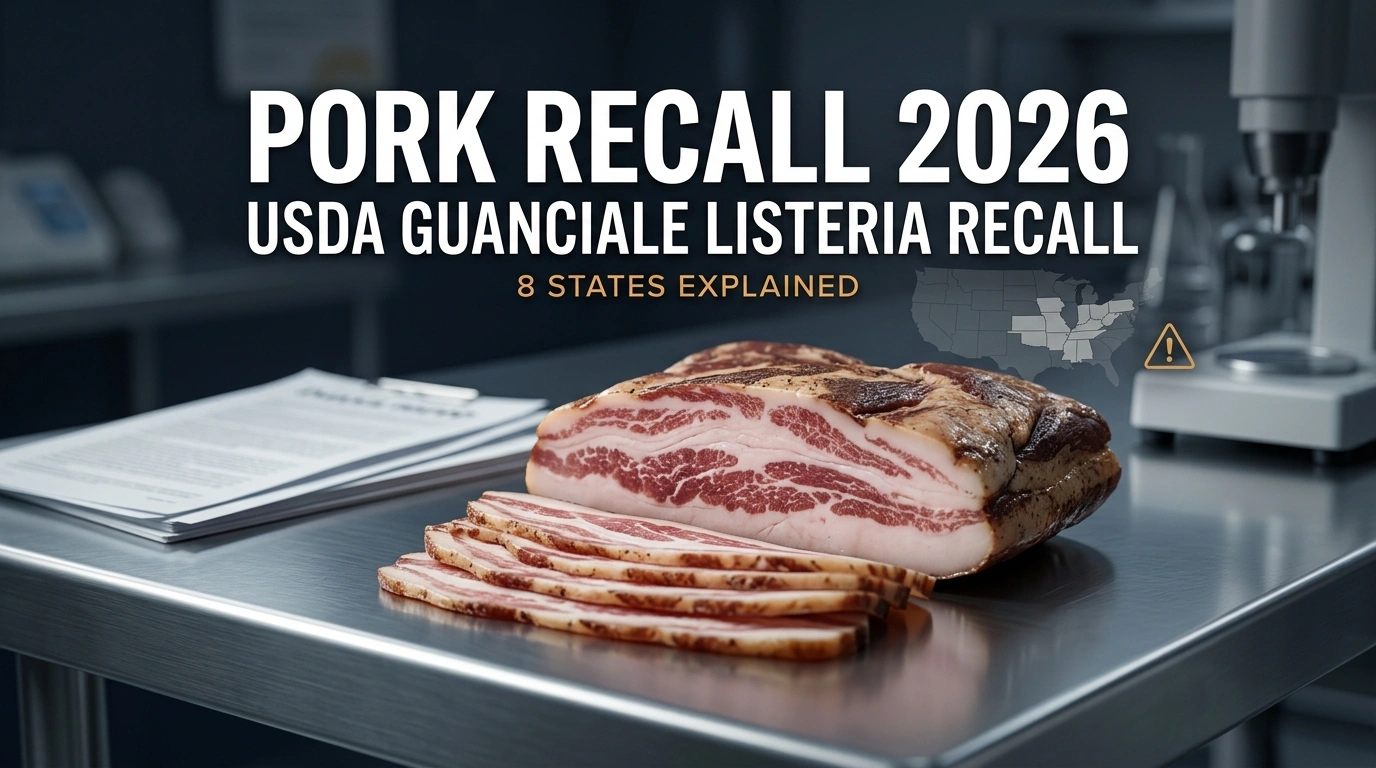
The USDA’s Food Safety and Inspection Service (FSIS) issued a Class I recall — its most serious classification — on September 6, 2026, covering roughly 1,513 pounds of imported ready-to-eat pork guanciale after routine import reinspection testing detected possible Listeria monocytogenes contamination. While the recall’s raw volume is modest, its timing amid a broader 2026 surge in foodborne-illness recalls has amplified its visibility well beyond the affected product line.
The Recall, By the Numbers
| Detail | Data |
|---|---|
| Classification | Class I (most serious FSIS category) |
| Product | Imported ready-to-eat (RTE) dry-cured pork jowl (“guanciale”) |
| Volume | ~1,513 pounds |
| Pathogen | Listeria monocytogenes |
| Lot Number | 263311US |
| Best-By Date | May 16, 2027 |
| Establishment Number | IT 1937 L CE (Bome SRL, Italy) |
| Production Date | May 21, 2026 |
| Import Date | Various dates in July 2026 |
| Announcement Date | September 6, 2026 |
| Reported Illnesses | None, as of the recall announcement |
Companies and Distribution Channels Involved
Two importers/distributors are named in the FSIS recall notice:
- Prime Line Distributors, Inc., based in Fort Lauderdale, Florida.
- Ferrarini USA, Inc., based in Hoboken, New Jersey.
The affected guanciale — a specialty dry-cured pork jowl product widely used in Italian cuisine (notably carbonara and amatriciana preparations) — was distributed to food service, retail, and distributor locations across eight states: California, Florida, Idaho, Illinois, Michigan, New Jersey, New York, and Texas. The multi-channel distribution pattern (restaurants and retail simultaneously) is a standard risk factor FSIS weighs in Class I classifications, since it multiplies the number of potential consumer touchpoints relative to a single-channel recall.
How the Contamination Was Detected
FSIS identified the issue through routine import reinspection testing, not through consumer illness reports or a triggered investigation — a detection pathway that reflects the U.S. import-safety system’s standard practice of sampling foreign-produced ready-to-eat products at the point of entry, prior to widespread distribution. A product sample from the Italian-produced lot tested positive for Listeria monocytogenes, prompting the recall despite the product having already moved through the supply chain to eight states by the time of detection.
Why Listeria in RTE Products Warrants the Highest Classification
Class I recalls are reserved for situations where there is a reasonable probability that use of the product will cause serious adverse health consequences or death. Listeria monocytogenes carries particular risk in ready-to-eat products specifically because:
- Unlike many pathogens, Listeria can grow at refrigeration temperatures, meaning standard cold storage does not neutralize the contamination risk the way it does for many other bacteria.
- RTE products, by definition, are not cooked by the consumer before eating — removing the kill-step that would otherwise eliminate the pathogen in a raw product intended for cooking.
- The resulting infection, listeriosis, disproportionately threatens older adults, pregnant women, newborns, and immunocompromised individuals, with symptoms ranging from fever, muscle aches, and headache to severe outcomes including confusion, loss of balance, and convulsions in serious cases.
Consumer Safety Guidance
- Do not eat any guanciale product matching lot number 263311US, establishment number IT 1937 L CE, or the May 16, 2027 best-by date.
- Discard the product or return it to the point of purchase.
- Consumers who purchased the affected product through food-service channels (restaurants, delis) rather than direct retail should contact FSIS or check the establishment’s own recall notices, since food-service distribution is harder for individual consumers to trace than a retail purchase.
- Anyone in a high-risk group (pregnant, elderly, immunocompromised) who consumed the product and develops fever, muscle aches, or gastrointestinal symptoms should contact a healthcare provider and mention potential Listeria exposure specifically, since diagnosis and treatment protocols differ from typical foodborne illness.
The Broader 2026 Recall Environment
This pork recall did not occur in isolation. It landed amid what several outlets have characterized as a genuine surge in 2026 foodborne-illness recalls, including:
- A large multistate Cyclospora outbreak with over 18,000 reported cases.
- Multiple August 2026 recalls spanning frozen berries, pistachio butter, sprouts, jalapeño peppers, and other produce items, tied to Salmonella, E. coli, and Listeria contamination across different supply chains.
The clustering of recalls across such varied product categories — imported cured meats, frozen produce, fresh produce — suggests the elevated 2026 recall count reflects a combination of genuinely increased contamination incidents and heightened import/domestic reinspection activity, rather than a single supply-chain failure point.
Economic Impact on Producers and Distributors
While a 1,513-pound recall is financially modest in isolation for the companies directly involved, Class I recalls carry costs that extend beyond the recalled volume itself:
- Reputational and retail-relationship costs for Prime Line Distributors and Ferrarini USA, both of which specialize in imported Italian specialty products — a category where consumer and buyer trust in provenance and safety is a core part of the value proposition.
- Downstream costs to retail and food-service partners across the eight affected states, who must audit inventory, remove product, and in some cases notify their own customers — costs that are typically absorbed by the distributor/importer but still create friction in the retail relationship.
- Broader import-scrutiny implications: incidents like this reinforce FSIS’s ongoing emphasis on import reinspection testing as a control point, which can translate into extended inspection timelines for other shipments from the same or similar foreign establishments, indirectly raising compliance costs across the imported specialty-foods supply chain.
The September 2026 guanciale recall is a textbook Class I action: a relatively small volume of product, caught before any reported illnesses, but carrying the pathogen (Listeria) and product type (ready-to-eat) combination that FSIS treats with maximum urgency. Its significance for the broader supply chain lies less in its own scale and more in what it represents — one data point in a wider 2026 pattern of elevated food-safety recalls spanning imported cured meats, frozen produce, and fresh produce, underscoring active reinspection vigilance across both domestic and import food-safety channels.
Discover more from The Economy
Subscribe to get the latest posts sent to your email.

Balance of Payments (BOP)

The Falkland Islands Dispute: Sovereign Wealth, Offshore Drilling, and Market Impacts

Gross Domestic Product (GDP): Nominal vs. Real

What is Inflation and the Consumer Price Index (CPI)?

US-China Trade Competition 2026: Supply Chain Relocation Guide

Oil Prices Break $100 in 2026: Middle East Conflict & Energy Markets

South-South Trade Expansion: Digital Integration and Emerging Market Growth

$166B Tariff Refund Tapering Fast: Is Your Business Missing Out?

Stock Market Today: Dow Climbs 500 Points as Markets Shake Off Inflation Jitters

14th WTO Conference 2026: Tariffs & Global Supply Chain Impact

Swish Secures $24M Funding to Disrupt India’s $100B Food Market

Physical AI and Driverless Tech: The Next Trillion-Dollar Industrial Revolution

Enterprise AI Platforms Disrupting B2B SaaS in 2026: Full Analysis

Crypto vs. Safe Haven Assets 2026: Where Institutions Are Hedging

State Farm’s $5B Dividend 2026: Who Qualifies & Payout Dates

US-China Relations in Q3 2026: Trade Tariffs and Supply Chain Risks

Gold’s Wild 2026: From a Record $5,600 Peak to a 24% Crash and Back Toward $4,500

Oil Surges as Strait of Hormuz Traffic Collapses Again

The Rocket That Won’t Quit: Inside SpaceX’s Falcon 9 Launch Machine

Bank of England Set to Hold Rates Through Year-End, Reuters Poll Shows

SpaceX Starship Flight 14: First Orbital Attempt & Starlink V3 Launch Explained

The 2026 Crypto Regulatory Shift: What It Means for Institutional Investors

AI Chip Stocks 2026: The Best Semiconductor Investments Beyond Marvell

Retail Earnings Week: What Home Depot, Target & Walmart Reveal

AI-Powered Training: The Next Multi-Billion Dollar Ecosystem in Fitness

Russia’s Black Sea Oil Exports Fall for a Fifth Straight Week

Global Chip Selloff Deepens: What’s Driving the Aug. 19 Semiconductor Rout

Tween Back-to-School Trends 2026: What’s Driving the $85B Season
-

 Markets & Finance8 months ago
Top 15 Stocks for Investment in 2026 in PSX: Your Complete Guide to Pakistan’s Best Investment Opportunities
-

 Analysis7 months ago
Johor’s Investment Boom: The Hidden Costs Behind Malaysia’s Most Ambitious Economic Surge
-

 Analysis7 months ago
Top 10 Stocks for Investment in PSX for Quick Returns in 2026
-

 Analysis7 months ago
Brazil’s Rare Earth Race: US, EU, and China Compete for Critical Minerals as Tensions Rise
-

 Banks8 months ago
Best Investments in Pakistan 2026: Top 10 Low-Price Shares and Long-Term Picks for the PSX
-

 Investment8 months ago
Top 10 Mutual Fund Managers in Pakistan for Investment in 2026: A Comprehensive Guide for Optimal Returns
-

 Global Economy9 months ago
15 Most Lucrative Sectors for Investment in Pakistan: A 2025 Data-Driven Analysis
-

 Global Economy9 months ago
Pakistan’s Export Goldmine: 10 Game-Changing Markets Where Pakistani Businesses Are Winning Big in 2025