
Treasury
10-Year Treasury Yield Outlook for 2027 After the Democratic Sweep

The 10-year U.S. Treasury yield fell after the Democratic sweep of Congress in the November 3, 2026 midterms, but analysts are not agreeing on what comes next. WisdomTree’s rates team expects the 10-year to trade within a 4.50% to 5.25% range, while Bloomberg-compiled historical data suggest yields have tended to be lower on average in the year after comparable midterms. The 2027 outlook depends less on the election itself than on Federal Reserve policy, inflation, and how much debt the Treasury must sell.
Key Takeaways
- WisdomTree’s central expectation is a 10-year range of 4.50% to 5.25%, according to its November 2026 rates commentary.
- The 10-year yield dropped from around 4.95% to about 4.89% on election-week trading, per Morningstar/Dow Jones reporting.
- Bloomberg-compiled data show yields have tended to be lower one and 12 months after comparable midterm results, though that is a weak predictor.
- Fed policy is the largest single driver heading into 2027, with markets discussing a possible December rate hike.
- Deficit financing remains a long-run upward risk even under divided government.
Start With the Current Level
Yields moved sharply in the weeks before the election. Early October brought multi-decade highs, and WisdomTree noted that the benchmark later fell roughly 50 basis points as the market repriced. Trading Economics reported the 10-year near 4.83% on November 5, its lowest level since September, before a partial rebound to about 4.9%.
These moves matter because a 2027 outlook is built from a starting point. A yield near 4.9% sits in the upper part of the range that prevailed for much of the past two years, which means small shifts in inflation or policy expectations can produce large moves.
Readers should verify the current level on the Treasury Department’s daily par yield curve before making decisions, since quotes vary by source and time of day.
Three Scenarios for 2027
Forecasting Treasury yields is notoriously difficult, so a scenario framework is more useful than a single number.
Scenario 1: Sticky inflation keeps yields high. If price pressures remain firm and the Fed continues tightening or holds at restrictive levels, the 10-year could test the upper end of WisdomTree’s range. Persistent energy-driven inflation, which has repeatedly shaped yield moves in 2026, is the main trigger.
Scenario 2: Growth slows and yields drift lower. If employment weakens or equity markets correct sharply, investors typically move into Treasuries, pushing yields down. Equity weakness in early November briefly supported bonds, illustrating this dynamic.
Scenario 3: Fiscal worries dominate. If deficits widen faster than expected, or if bipartisan spending deals add to borrowing, investors may demand higher term premiums. In this case, yields can rise even if the Fed is on hold.
Most analysts think the outcome will be a mix of these forces rather than one clean path.
Why Divided Government May Not Lower Borrowing
The market’s initial reaction assumed that a Congress split or constrained by Democratic control would slow new spending and reduce Treasury supply. WisdomTree challenges that assumption. Its analysis argues that bipartisan spending agreements and existing fiscal commitments can sustain high borrowing needs regardless of which party controls Congress.
That view matters for 2027 because much of federal spending is locked in by existing law, including interest payments, Social Security, Medicare, and defense commitments. Interest costs have also grown as the stock of debt has increased and newer debt is issued at higher rates.
If the deficit does not narrow, the Treasury must keep auctioning large amounts of debt. Weak auction demand, particularly at longer maturities, would be an early warning that investors require more compensation for holding duration risk.
The Fed Is the Bigger Variable
For 2027, the Fed’s path will probably matter more than the midterm outcome. Through September, Federal Reserve officials had signaled that further increases might be needed to bring inflation back to target, and at that point markets priced at least one more hike for 2026. WisdomTree suggests the election should have only limited direct effect on that policy path, with a December move still on the table after the October jobs report.
For bond investors, the relevant question is not simply whether the Fed hikes or holds. It is how long policy stays restrictive and whether markets believe the Fed will cut when inflation eases. A slow, credible path to lower rates tends to anchor long yields. An abrupt policy reversal can cause sharp repricing in either direction.
Signals to monitor:
- The December FOMC decision and dot plot, which shape expectations for the rate path into 2027.
- Monthly inflation releases, particularly core measures, which are the clearest test of whether price pressures are fading.
- Labor market data, since sharp weakening tends to push yields down quickly.
- Treasury auction results, especially for 10-year and 30-year notes.
- Energy prices, which have swung inflation expectations throughout 2026.
What the Historical Record Does and Does Not Show
Historical comparisons are often cited to forecast midterm effects, but the evidence is weak. Analysis compiled by Capital Group and others found no reliable election-year signal in 10-year yields from the mid-1950s through 2022. In roughly half of the midterm-year windows, yields rose over the 12 months ending in November; in the other half, they fell.
Two examples show why. In 1983, under a similar political configuration to 2026, the 10-year yield rose by about 129 basis points. In 2019, it fell about 97 basis points. Inflation, growth, and central bank policy explain far more of the difference than party control does.
Bloomberg-compiled data suggest yields were lower on average one and 12 months after comparable midterms. Treat that as an interesting pattern, not a forecast, because the sample is small and the economic backdrop changes from cycle to cycle.
Practical Implications for 2027
For mortgage shoppers. Mortgage rates track the 10-year yield closely, though the spread between them varies. A move toward the lower part of the expected range would ease borrowing costs, while a sustained move above 5% would keep affordability constrained.
For savers. Short-term Treasury yields remain attractive if the Fed holds policy steady, but reinvestment risk rises if rates fall later. Laddering maturities can reduce the need to predict rate moves.
For bond investors. Duration is the main risk. A portfolio with longer maturities will gain if yields fall and lose if they rise. Matching duration to your time horizon is more reliable than trying to time the election-driven swings.
For businesses. Corporate borrowing costs usually move with Treasury yields plus a credit spread. Companies planning debt issuance in 2027 should model several yield scenarios rather than a single base case.
Frequently Asked Questions
Where will the 10-year Treasury yield be in 2027?
No one knows with confidence. WisdomTree’s stated expectation is a range of 4.50% to 5.25%. Treat that as a planning band, not a precise forecast.
Did the Democratic sweep push Treasury yields lower?
Yields fell after the election, as investors interpreted divided or constrained government as a potential limit on new borrowing. Other factors, including oil prices and Fed commentary, also influenced the move.
Will the Fed raise rates before 2027?
A December hike remains possible, according to WisdomTree’s analysis, particularly if inflation data stay firm. The outcome depends on incoming economic data.
Does a divided Congress reduce the deficit?
Not necessarily. Bipartisan deals and existing spending commitments can sustain high borrowing regardless of who controls Congress.
Are midterm elections a reliable signal for bond yields?
No. Historical examples such as 1983 and 2019 show that yields can move in opposite directions under similar political setups.
How do Treasury yields affect mortgage rates?
Mortgage rates are linked to the 10-year yield but include a spread that changes with lender pricing, credit conditions, and market volatility. A lower 10-year yield does not guarantee a proportionate drop in mortgage rates.
What should bond investors do now?
Focus on duration that matches your time horizon, diversify across maturities, and avoid large directional bets based on election headlines. Consult a licensed financial adviser for decisions tied to your situation.
Conclusion: Plan for a Range, Not a Forecast
The 2027 Treasury outlook depends on the Federal Reserve, inflation, and the size of federal borrowing, with the election playing a smaller role than headlines suggest. A realistic planning range is WisdomTree’s 4.50% to 5.25%, and investors should prepare for both sticky-inflation and slowdown scenarios. Watch the December Fed decision, monthly inflation data, and auction demand as the clearest guides to where the 10-year is heading.
Discover more from The Economy
Subscribe to get the latest posts sent to your email.



A US government bond can change the required return on a Pakistani investment without a single dollar physically crossing the border. The link runs through a basic idea: when a benchmark asset yields more, investors demand a stronger reason to take additional currency, liquidity and credit risks elsewhere.
The yield on the US 10-year Treasury stood near 5.00% on October 23, 2026, after reaching about 5.24% on October 9, according to historical Treasury-yield data. The user-friendly phrase above 5% should therefore be treated as a description of much of October, not a guaranteed quote for every moment of the latest trading day.
A bond yield is not a savings-account rate
A government-bond yield is the return implied by its market price and promised cash flows, assuming the relevant payment and holding assumptions. When investors sell an existing fixed-coupon bond and its price falls, its yield typically rises. That inverse relationship is central to interpreting the US Treasury market.
The 10-year yield reflects a mixture of expected short-term policy rates, expected inflation and a term premium for holding longer-dated debt. It can fall even while central-bank inflation concerns persist, for example if growth fears rise or investor demand for safe securities strengthens. Reading any single yield move as a pure Fed forecast is a mistake.
Four ways it reaches Pakistan
1. Dollar funding becomes a tougher benchmark. Investors weighing dollar-denominated assets may compare emerging-market returns with those available in US government debt. Pakistani external bonds must compensate for additional sovereign and market risk, although observed spreads change independently of benchmark yields.
2. Currency calculations shift. A domestic bond offering a high rupee yield can still disappoint a foreign investor if depreciation erodes converted returns. For Pakistani investors with future dollar obligations, currency exposure is similarly relevant.
3. Valuations face a higher discount rate. Equity valuations are sensitive to the interest rate used to discount expected future earnings. Companies promising distant profits may be more exposed than businesses generating cash immediately, but there is no perfect sector rule.
4. Sovereign refinancing risk draws scrutiny. Global debt investors assess not only current yields but also how costly it will be for governments to refinance existing obligations. Local T-bills and PIBs are nevertheless priced mainly by Pakistan-specific inflation, liquidity, central-bank policy and credit conditions; US yields do not mechanically set auction cutoffs.
The price-risk example
Imagine a fixed-coupon bond with a duration of seven years. A one-percentage-point increase in yields would imply an approximate 7% price decline, all else equal, using the basic duration approximation. That is not a prediction and not an exact valuation; convexity, yield-curve changes and cash-flow structure matter. It illustrates why holding a bond fund is different from locking in a bank deposit.
Duration risk also works in reverse: bond prices can rise when market yields fall. An investor buying only because the quoted coupon looks attractive may discover later that the resale price has moved against them.
What the latest global backdrop adds
The Federal Reserve raised its policy range to 3.75%–4.00% in September, amid persistent inflation concerns. At the same time, oil-market instability has made imported inflation a more acute concern for Pakistan. The IMF’s October World Economic Outlook forecasts 3.1% world growth for 2026 and highlights downside risks from conflict and financing strains.
This combination means bond yields may be high for reasons that are not benign. A superficially attractive yield could reflect inflation anxiety, fiscal uncertainty or a global risk premium. Investors need to ask why the yield is high, not just how high it is.
A useful comparison table
| Asset | Return quoted in | Main extra risk to examine |
|---|---|---|
| US 10-year Treasury | USD | Duration, inflation, reinvestment |
| Pakistan T-bill | PKR | Domestic rate/inflation, reinvestment |
| Pakistan Investment Bond | PKR | Duration, inflation, liquidity |
| Pakistan dollar bond | USD | Sovereign credit spread, liquidity, duration |
| PSX equity | PKR | Earnings, valuation, currency and market risk |
Currency hedging is not a free lunch
A Pakistani saver comparing foreign-currency investments with domestic government paper must think about more than headline yield. Converting rupees to dollars and back can involve spreads, banking charges, legal requirements and foreign-exchange movement. A hedging instrument, where available and suitable, usually embeds a cost related to interest-rate differences and market conditions. It cannot simply erase currency risk without consequence.
Tax treatment also matters. A quoted yield before withholding tax, custody expense or fund fees is not comparable with an after-tax return from another product. Similarly, a dollar asset can generate a positive dollar return but a different return in rupees. The investor should calculate both if future expenses are split between currencies.
For institutional portfolios, bond duration and liquidity become central. A long-maturity bond may have an attractive yield to maturity but be unsuitable for liabilities due next month. For individuals, the ability to meet an emergency expense without selling at a loss may be worth more than an extra percentage point of advertised return.
The sound comparison is liability-matched, not headline-driven: decide when the money is needed, in what currency and how much market-price movement is tolerable before selecting an asset.
Does a 5% US yield mean Pakistan must offer 5% plus a fixed margin?
No. Each instrument differs in currency, maturity, credit, liquidity and taxation; spreads vary with markets and policy.
Are US Treasuries risk-free?
They are commonly treated as a benchmark for dollar credit risk, but their market prices are not risk-free. Inflation and interest-rate changes can erode purchasing power and resale value.
What should a Pakistani retail investor do first?
List liabilities by currency and timing, then compare instruments on an after-tax, after-inflation and liquidity-adjusted basis. Seek licensed guidance where suitable.
The takeaway: a 5% US benchmark changes the world’s price of patience. Pakistani investors should respond by measuring real cash flows and risks, not by chasing whichever country advertises the biggest nominal yield.
Discover more from The Economy
Subscribe to get the latest posts sent to your email.
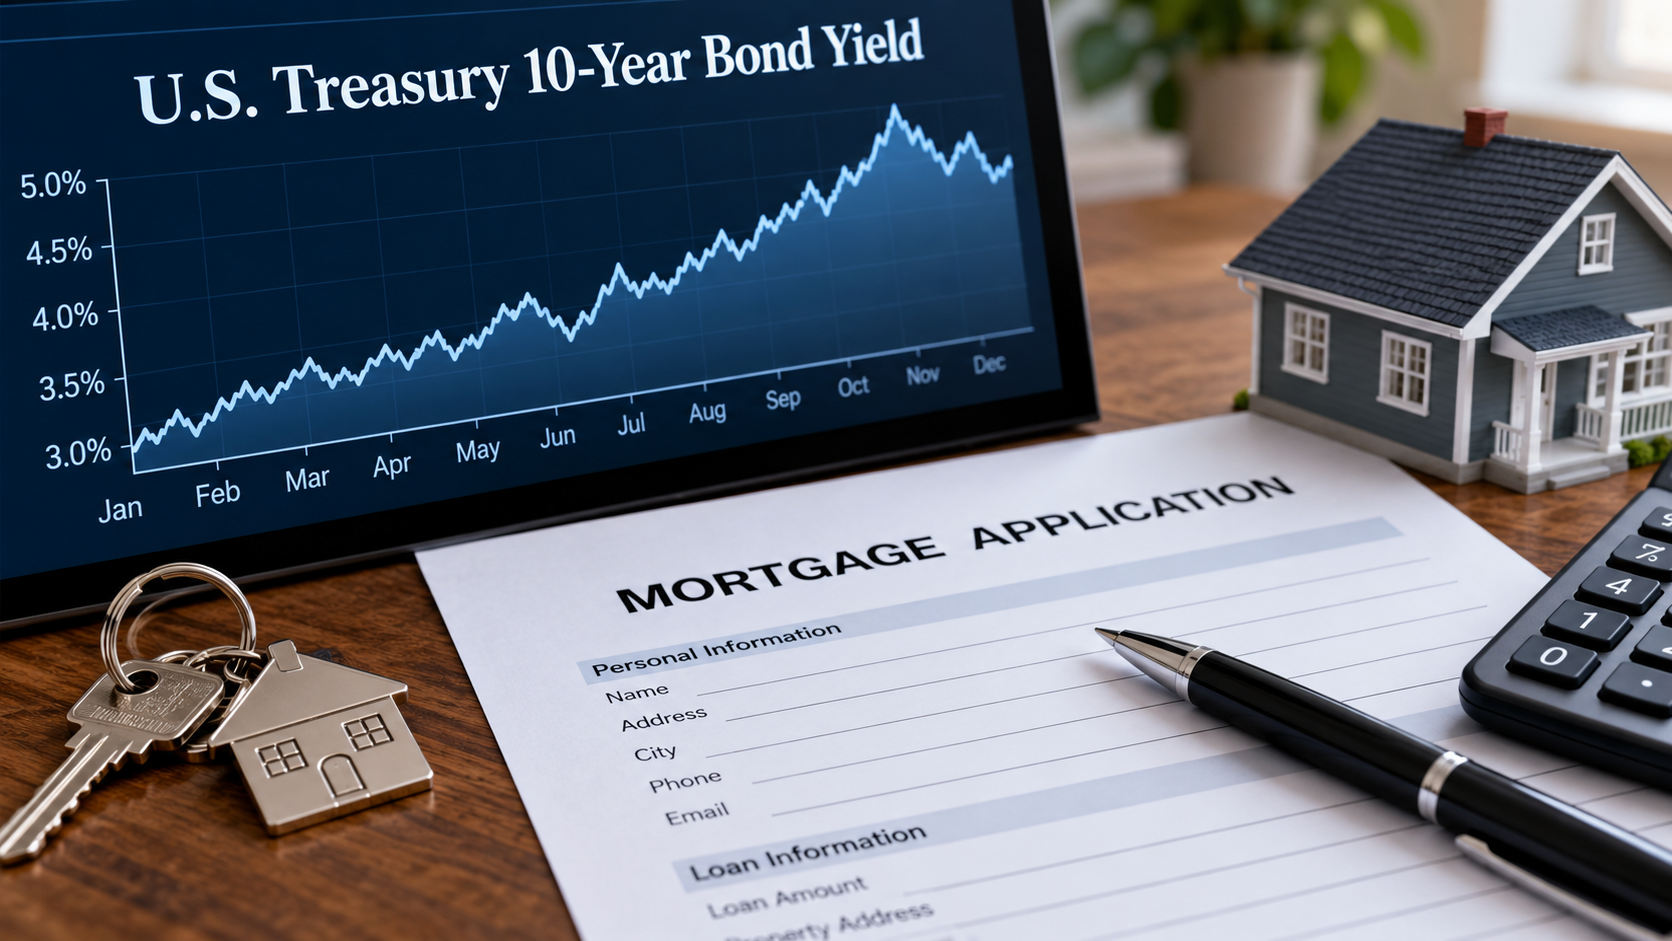
Long-term Treasury yields connect bond markets to household borrowing and asset values. Higher yields can benefit new savers while hurting some borrowers and existing bondholders. Original research October 12; updated October 15, 2026. Verify newer developments before publication.
Unexpected inflation can raise the expected interest-rate path and alter equity valuations and borrowing costs. Yield changes and bond-price changes move in opposite directions for an otherwise similar fixed-rate bond. Source. Historical material further below is contextual and must not be mistaken for a live quotation or price.
What changed since the original research cutoff
Unexpected inflation can raise the expected interest-rate path and alter equity valuations and borrowing costs. Yield changes and bond-price changes move in opposite directions for an otherwise similar fixed-rate bond. The publication date and observation time are crucial: market prices, competition results and government announcements cannot be extrapolated from an earlier snapshot. A more useful reader question is what remains current today and what requires verification at the moment of a financial or travel decision. The new development should be checked against the primary or contemporary reference rather than assumed from an older headline.
What is happening and why readers are searching
Long-term Treasury yields are the price signal linking government borrowing, mortgages, growth-stock valuations and the return available on safer assets. Reuters has highlighted an unusual 2026 divergence: shares near highs while longer-term bond yields have climbed. A bond yield is not the same as the Federal Reserve policy rate, and a large move in either can affect people differently depending on whether they borrow, save or invest. Sources: Reuters bond market analysis and Reuters market breadth.
The important context competitors can overlook
Bond prices generally fall when market yields rise. That inverse relationship explains why holders of long-duration bond funds can suffer losses even as the yields offered to new buyers become more attractive. Mortgage rates also reflect lending spreads, credit risk and other factors, so a single Treasury number cannot predict a specific home-loan offer. Companies with distant expected cash flows may be particularly sensitive to higher discount rates. For primary-source checks and current reporting, see Reuters bond market analysis and Investor.gov. The key distinction is translate bond math into household decisions.
A practical way to use this information
Compare yields at consistent maturities rather than mixing two-year and ten-year readings. A homebuyer should assess monthly payment affordability at an actual lender quote. A saver choosing between a short-term bill and a long-term fund should consider liquidity needs and interest-rate risk. For an investor, the useful question is what rate assumptions are embedded in a company valuation, not whether “6%” makes a dramatic headline.
A simple rate-shock example
Imagine an existing long-duration bond fund whose duration is eight years. A simplified duration approximation suggests a one-percentage-point increase in yield could mean about an 8% price decline, before convexity, income and other effects. This is illustrative, not a forecast for a named fund. A short-term Treasury instrument with far lower duration usually reacts less to the same yield shock.
That distinction makes a practical difference for readers considering an emergency fund versus retirement money they can invest for a decade. The current market narrative described by Reuters should prompt a discussion of time horizon, not a blanket instruction to abandon bonds.
What to verify before making a decision
The right next step is to identify the source, timestamp and applicable market or jurisdiction. Check whether a number is a historical observation, official announcement, target, forecast or scenario. If you intend to act financially, legally or commercially, use the relevant provider’s current terms and obtain professional advice where appropriate. The sources cited here establish context; they are not a substitute for live prices, individual eligibility checks or binding agreements.
Reader questions
Are higher Treasury yields always bad? No. New fixed-income savers may earn more, while existing long-duration bond prices can decline.
Does the Fed set the ten-year Treasury yield? No. It influences conditions, but market expectations and term premiums also matter.
Why the ten-year yield influences everyday borrowing
The 10-year U.S. Treasury yield is an important benchmark for longer-term financing because it reflects the return investors require to hold government debt with that maturity. Mortgage rates do not equal the 10-year yield, but lenders consider Treasury markets, mortgage-backed securities, credit risk, servicing costs and competition when setting offers. If investors demand a higher return across long-term bonds, mortgage borrowing can become more expensive even without an immediate increase in the Federal Reserve’s short-term policy rate.
Suppose a buyer finances $300,000 over 30 years with a fixed-rate mortgage. At an illustrative 6% annual interest rate, principal and interest are roughly $1,799 per month; at 7%, they are roughly $1,996. The difference of about $197 per month excludes taxes, insurance, fees and other ownership costs. It demonstrates why a change in borrowing conditions can outweigh a modest change in a home’s asking price. Real quotes depend on the borrower’s circumstances and market conditions, not merely the Treasury yield reported in a news article.
Why bond prices and bond yields move in opposite directions
A conventional fixed-coupon bond promises specified payments. When newly issued securities offer higher yields, an existing bond with a lower coupon generally must trade at a lower price to attract buyers. The opposite happens when market yields fall. Duration measures a bond’s sensitivity to interest-rate changes. As an approximate illustration, a portfolio with an effective duration of seven years could lose about 7% in price if relevant yields rise by one percentage point, before other effects. The relationship is approximate and can vary with convexity, changing spreads and portfolio holdings.
For savers, a higher yield can be welcome if they are buying newly issued securities and can hold them under suitable circumstances. For owners of existing long-duration bonds, the same move can produce mark-to-market losses. Investors seeking near-term stability should understand the distinction between a bond’s redemption terms and the market price they might receive if they must sell before maturity. Credit risk also differs between Treasury securities and corporate or municipal bonds.
The yield curve tells a story, but not one prediction
The yield curve plots interest rates across maturities. Its shape can reflect expectations for growth, inflation, monetary policy and compensation for holding longer bonds. An inverted curve has often been studied as a recession signal, yet neither inversion nor steepening guarantees a specific economic outcome. A steepening curve may arise because investors expect stronger future activity, higher inflation or greater long-term borrowing supply. The underlying cause matters more than the shape alone.
Distinguish nominal yields from real yields after expected inflation. If a nominal Treasury yield rises because inflation expectations rise, the investor’s purchasing-power return may not improve nearly as much as the headline suggests. Treasury Inflation-Protected Securities provide another reference point, though their market prices and practical suitability also require care. Useful analysis compares inflation expectations, real yields and nominal yields rather than describing all higher rates as a sign of healthy growth.
A decision framework for households
Borrowers should compare multiple complete loan offers, including interest rate, annual percentage rate, closing costs and applicable points. A lower headline rate with very large upfront fees may not be cheaper for someone planning to move or refinance. Depositors should distinguish variable savings-account APYs from yields locked by certain fixed-term products. Bond-fund investors should review duration, credit quality, expenses and possible withdrawals. Stock investors should consider how higher discount rates affect the value assigned to future profits, particularly where profits are expected many years ahead.
No single financial product becomes universally best because yields reach a round number. A retiree seeking predictable cash flow, a first-time homebuyer and a technology-company investor face different tradeoffs. Their financial decisions are better guided by time horizon, liquidity and risk tolerance than by a prediction of where the yield will be next week.
The key variables to monitor
For a coherent market story, compare the 2-year and 10-year Treasury yields, current Fed communications, the latest inflation data and changes in bond-market liquidity. Track the time at which each observation was made. Also distinguish a policy announcement from a market-implied forecast; futures pricing can change significantly with new information. Where a report cites a historic high, specify the exact maturity and comparison period. Generalized phrases such as “rates hit their highest level” can conceal important differences.
Relevant data and explanations are available from the U.S. Treasury and Federal Reserve. Those are appropriate baselines for an article readers may use to understand mortgages, bonds and savings decisions.
Discover more from The Economy
Subscribe to get the latest posts sent to your email.
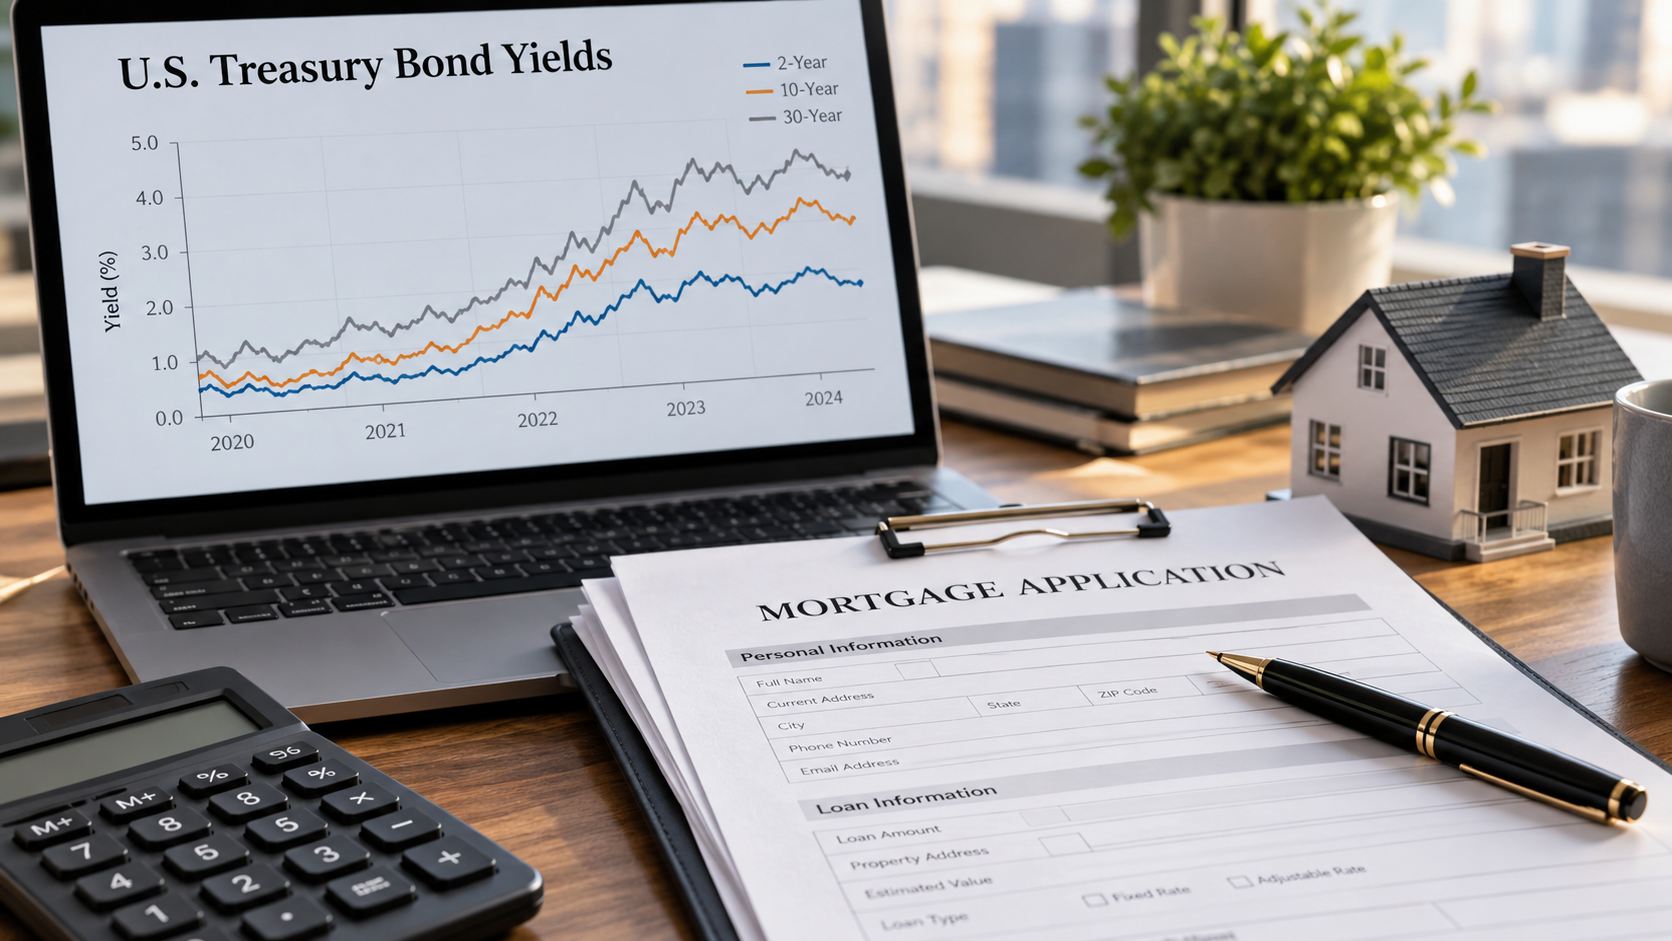
Long-term Treasury yields are the price signal linking government borrowing, mortgages, growth-stock valuations and the return available on safer assets. Reuters has highlighted an unusual 2026 divergence: shares near highs while longer-term bond yields have climbed. A bond yield is not the same as the Federal Reserve policy rate, and a large move in either can affect people differently depending on whether they borrow, save or invest. Sources: Reuters bond market analysis and Reuters market breadth.
The important context competitors can overlook
Bond prices generally fall when market yields rise. That inverse relationship explains why holders of long-duration bond funds can suffer losses even as the yields offered to new buyers become more attractive. Mortgage rates also reflect lending spreads, credit risk and other factors, so a single Treasury number cannot predict a specific home-loan offer. Companies with distant expected cash flows may be particularly sensitive to higher discount rates. For primary-source checks and current reporting, see Reuters bond market analysis and Investor.gov. The key distinction is translate bond math into household decisions.
Long-term Treasury yields connect bond markets to household borrowing and asset values. Higher yields can benefit new savers while hurting some borrowers and existing bondholders. Research cutoff: October 12, 2026; confirm developing facts before publication.
A practical way to use this information
Compare yields at consistent maturities rather than mixing two-year and ten-year readings. A homebuyer should assess monthly payment affordability at an actual lender quote. A saver choosing between a short-term bill and a long-term fund should consider liquidity needs and interest-rate risk. For an investor, the useful question is what rate assumptions are embedded in a company valuation, not whether “6%” makes a dramatic headline.
A simple rate-shock example
Imagine an existing long-duration bond fund whose duration is eight years. A simplified duration approximation suggests a one-percentage-point increase in yield could mean about an 8% price decline, before convexity, income and other effects. This is illustrative, not a forecast for a named fund. A short-term Treasury instrument with far lower duration usually reacts less to the same yield shock.
That distinction makes a practical difference for readers considering an emergency fund versus retirement money they can invest for a decade. The current market narrative described by Reuters should prompt a discussion of time horizon, not a blanket instruction to abandon bonds.
What to verify before making a decision
The right next step is to identify the source, timestamp and applicable market or jurisdiction. Check whether a number is a historical observation, official announcement, target, forecast or scenario. If you intend to act financially, legally or commercially, use the relevant provider’s current terms and obtain professional advice where appropriate. The sources cited here establish context; they are not a substitute for live prices, individual eligibility checks or binding agreements.
Reader questions
Are higher Treasury yields always bad?
No. New fixed-income savers may earn more, while existing long-duration bond prices can decline.
Does the Fed set the ten-year Treasury yield?
No. It influences conditions, but market expectations and term premiums also matter.
Why the ten-year yield influences everyday borrowing
The 10-year U.S. Treasury yield is an important benchmark for longer-term financing because it reflects the return investors require to hold government debt with that maturity. Mortgage rates do not equal the 10-year yield, but lenders consider Treasury markets, mortgage-backed securities, credit risk, servicing costs and competition when setting offers. If investors demand a higher return across long-term bonds, mortgage borrowing can become more expensive even without an immediate increase in the Federal Reserve’s short-term policy rate.
Suppose a buyer finances $300,000 over 30 years with a fixed-rate mortgage. At an illustrative 6% annual interest rate, principal and interest are roughly $1,799 per month; at 7%, they are roughly $1,996. The difference of about $197 per month excludes taxes, insurance, fees and other ownership costs. It demonstrates why a change in borrowing conditions can outweigh a modest change in a home’s asking price. Real quotes depend on the borrower’s circumstances and market conditions, not merely the Treasury yield reported in a news article.
Why bond prices and bond yields move in opposite directions
A conventional fixed-coupon bond promises specified payments. When newly issued securities offer higher yields, an existing bond with a lower coupon generally must trade at a lower price to attract buyers. The opposite happens when market yields fall. Duration measures a bond’s sensitivity to interest-rate changes. As an approximate illustration, a portfolio with an effective duration of seven years could lose about 7% in price if relevant yields rise by one percentage point, before other effects. The relationship is approximate and can vary with convexity, changing spreads and portfolio holdings.
For savers, a higher yield can be welcome if they are buying newly issued securities and can hold them under suitable circumstances. For owners of existing long-duration bonds, the same move can produce mark-to-market losses. Investors seeking near-term stability should understand the distinction between a bond’s redemption terms and the market price they might receive if they must sell before maturity. Credit risk also differs between Treasury securities and corporate or municipal bonds.
The yield curve tells a story, but not one prediction
The yield curve plots interest rates across maturities. Its shape can reflect expectations for growth, inflation, monetary policy and compensation for holding longer bonds. An inverted curve has often been studied as a recession signal, yet neither inversion nor steepening guarantees a specific economic outcome. A steepening curve may arise because investors expect stronger future activity, higher inflation or greater long-term borrowing supply. The underlying cause matters more than the shape alone.
Distinguish nominal yields from real yields after expected inflation. If a nominal Treasury yield rises because inflation expectations rise, the investor’s purchasing-power return may not improve nearly as much as the headline suggests. Treasury Inflation-Protected Securities provide another reference point, though their market prices and practical suitability also require care. Useful analysis compares inflation expectations, real yields and nominal yields rather than describing all higher rates as a sign of healthy growth.
A decision framework for households
Borrowers should compare multiple complete loan offers, including interest rate, annual percentage rate, closing costs and applicable points. A lower headline rate with very large upfront fees may not be cheaper for someone planning to move or refinance. Depositors should distinguish variable savings-account APYs from yields locked by certain fixed-term products. Bond-fund investors should review duration, credit quality, expenses and possible withdrawals. Stock investors should consider how higher discount rates affect the value assigned to future profits, particularly where profits are expected many years ahead.
No single financial product becomes universally best because yields reach a round number. A retiree seeking predictable cash flow, a first-time homebuyer and a technology-company investor face different tradeoffs. Their financial decisions are better guided by time horizon, liquidity and risk tolerance than by a prediction of where the yield will be next week.
The key variables to monitor
For a coherent market story, compare the 2-year and 10-year Treasury yields, current Fed communications, the latest inflation data and changes in bond-market liquidity. Track the time at which each observation was made. Also distinguish a policy announcement from a market-implied forecast; futures pricing can change significantly with new information. Where a report cites a historic high, specify the exact maturity and comparison period. Generalized phrases such as “rates hit their highest level” can conceal important differences.
Relevant data and explanations are available from the U.S. Treasury and Federal Reserve. Those are appropriate baselines for an article readers may use to understand mortgages, bonds and savings decisions.
Discover more from The Economy
Subscribe to get the latest posts sent to your email.

Open Banking Trends 2026: What Consumers Should Know

Nvidia After the Selloff: What to Watch Before Earnings

Black Friday 2026 Early Deals: A Data-Driven Shopping Guide

Fed Policy Path 2027: Rate Expectations After the Hold

Asia’s Economic Resilience in 2026: The Strategic Blueprint for Sustaining the Global Growth Engine

Credit Scoring Changes 2026: What Mortgage Buyers Need to Know

10-Year Treasury Yield Outlook for 2027 After the Democratic Sweep

Is the AI Infrastructure Boom Sustainable? A Reality Check

Disability Insurance Demand in 2026: Who’s Buying and Why

What the 2026 Midterms Mean for Treasury Yields and Bond Markets

Payroll Outlook After the Midterms: 2027 Tax Changes, Compliance Risks and AI Trends

Lisa Su: AMD Is Now a “Data Center First Company” – 2027 Outlook

Reasons for Falling US Gas Prices in November 2026: A Seasonal Shift

SoftBank’s $3.7 Billion Turbine Loss: What the AI Power Bet Reveals

Dow Jones Today: Dow Slips 237 Points After the Worst Day Since April 2025

US–Iran Conflict in October 2026: Hormuz, Oil Prices and Diplomacy

Pakistan IMF Programme 2026: Why Bailouts Keep Returning

SSI November 2026 Payment: Why Benefits Arrive October 30

Singapore Stock Market Outlook 2027: The STI’s Bank-and-Yield Test

2027 Federal Tax Brackets: New IRS Rates and Standard Deductions Explained

IMF Global Outlook 2027: The Recovery Is Real, but the Divide Is Growing

World Bank Debt Report 2026: The $9.4 Trillion Burden Behind the Recovery

Stock Market Crash 2026? What the November Rout Actually Tells Us

KSE-100 Index 2026: Is Pakistan’s Stock-Market Recovery Sustainable?

Germany–France ‘Made in Europe’ Deal Could Reshape China’s EV Ambitions

Global Markets Today: The AI Sell-Off Has Become a Test of Liquidity

Zhuhai Airshow 2026: How China’s Stealth Jets, Drones and Missiles Are Redrawing Global Air Power

Singapore’s Bank Sell-Off Is Really a Test of What Stability Is Worth
-

 Markets & Finance10 months ago
Top 15 Stocks for Investment in 2026 in PSX: Your Complete Guide to Pakistan’s Best Investment Opportunities
-

 Analysis9 months ago
Johor’s Investment Boom: The Hidden Costs Behind Malaysia’s Most Ambitious Economic Surge
-

 Analysis9 months ago
Top 10 Stocks for Investment in PSX for Quick Returns in 2026
-

 Banks10 months ago
Best Investments in Pakistan 2026: Top 10 Low-Price Shares and Long-Term Picks for the PSX
-

 Analysis9 months ago
Brazil’s Rare Earth Race: US, EU, and China Compete for Critical Minerals as Tensions Rise
-

 Investment10 months ago
Top 10 Mutual Fund Managers in Pakistan for Investment in 2026: A Comprehensive Guide for Optimal Returns
-

 Global Economy11 months ago
15 Most Lucrative Sectors for Investment in Pakistan: A 2025 Data-Driven Analysis
-

 Global Economy11 months ago
Pakistan’s Export Goldmine: 10 Game-Changing Markets Where Pakistani Businesses Are Winning Big in 2025