
Opinion
What Companies that Excel at Strategic Foresight Do Differently: The 2025 Competitive Intelligence Report

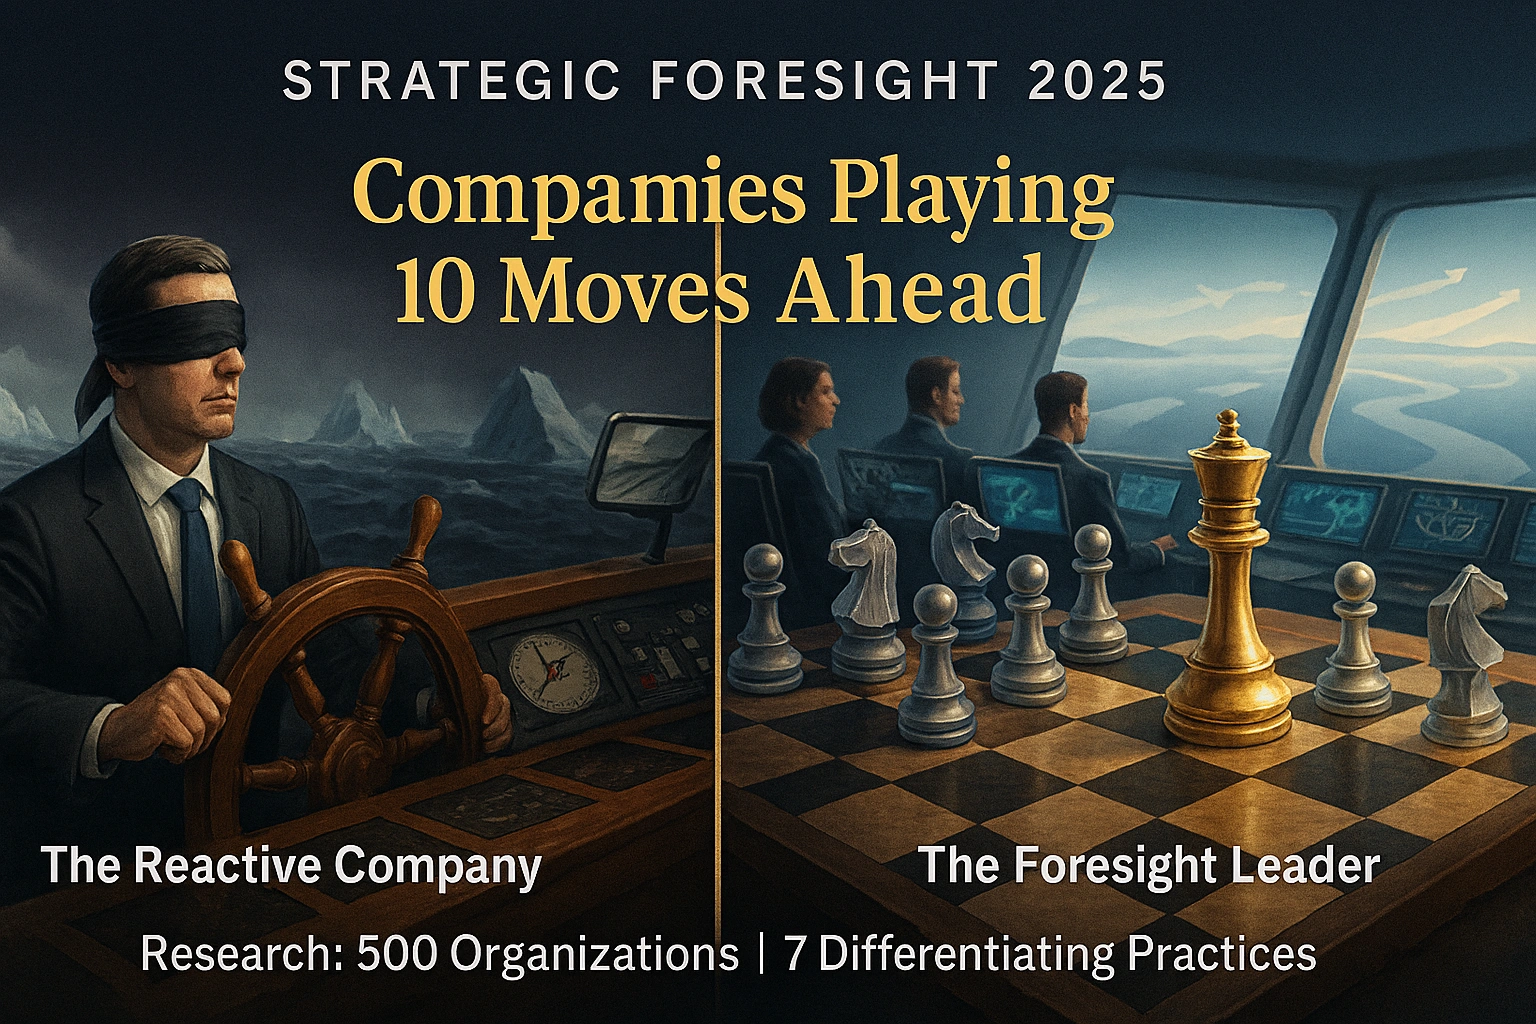
500-company survey reveals how top firms track predictable futures and unknowns. Learn the strategic foresight framework driving competitive advantage.
When The Body Shop shuttered its US operations in 2024, it wasn’t because executives lacked market data. The cosmetics retailer had access to the same consumer trend reports, sales analytics, and competitive intelligence as everyone else. What it lacked was something more fundamental: the ability to systematically scan multiple time horizons for both predictable shifts and genuine wildcards. While competitors like Sephora and Ulta Beauty were reimagining retail experiences around sustainability and digital engagement years earlier, The Body Shop remained anchored to strategies that worked in the past.
This isn’t an isolated failure. Based on analysis of earnings calls, discussions about uncertainty among CEOs spiked dramatically in 2025, with global uncertainty measures nearly double where they stood in the mid-1990s. Yet here’s the paradox: while executives universally acknowledge rising volatility, most organizations still approach the future reactively rather than systematically.
A groundbreaking survey of 500 organizations by Boston Consulting Group reveals a stark divide. Companies with advanced strategic foresight capabilities report meaningful performance advantages over peers—not through crystal balls, but through disciplined practices that track both knowable trends and true uncertainties across multiple time horizons. These firms don’t just survive disruption; they engineer competitive advantage from it.
This isn’t theory. It’s a quantifiable edge backed by data, and it’s available to any organization willing to build foresight as an embedded capability rather than a one-off planning exercise. Here’s exactly how they do it.
What Is Strategic Foresight? [Definition]
Strategic foresight is the systematic practice of exploring multiple plausible futures to anticipate challenges, identify opportunities, and make better decisions today. Unlike traditional forecasting that attempts to predict a single future, foresight acknowledges irreducible uncertainty and prepares organizations to thrive across various scenarios.
The core components include:
- Horizon scanning: Continuously monitoring signals of change across political, economic, social, technological, ecological, and legal domains
- Trend analysis: Distinguishing between temporary fluctuations and enduring shifts that will reshape industries
- Scenario planning: Developing multiple plausible future narratives that stress-test strategies against different conditions
- Strategic implications: Translating future insights into actionable decisions and resource allocation today
What makes strategic foresight different from strategic planning? Planning assumes a relatively stable future and optimizes for efficiency. Foresight assumes an uncertain future and optimizes for adaptability. According to the OECD, strategic foresight cultivates the capacity to anticipate alternative futures and imagine multiple non-linear consequences—capabilities increasingly vital as business environments grow more volatile.
The Strategic Foresight Maturity Model
The BCG survey of 500 organizations identified four distinct capability levels, with dramatic performance gaps between tiers. Understanding where your organization falls on this spectrum is the first step toward improvement.
STRATEGIC FORESIGHT MATURITY FRAMEWORK
| Maturity Level | Characteristics | Performance Impact | % of Organizations |
|---|---|---|---|
| Basic | Ad-hoc scanning, annual planning cycle, single forecast, executive intuition drives decisions | Frequently surprised by disruption, reactive strategy adjustments | 42% |
| Intermediate | Quarterly trend reviews, some scenario exercises, foresight team exists but operates in silo | Occasional early warnings, mixed response capability | 33% |
| Advanced | Continuous signal detection, integrated with strategy process, multiple scenarios inform decisions | Proactive adaptation, fewer blind spots, moderate performance edge | 18% |
| Elite | Systematic dual-track monitoring (knowns + unknowns), embedded throughout organization, explicit upside focus | Engineer competitive advantage from uncertainty, significant outperformance | 7% |
Only seven percent of companies qualify as foresight leaders, yet these organizations report substantially better financial performance and strategic resilience. The gap isn’t about spending—it’s about systematic practice.
Organizations with mature foresight capabilities, according to McKinsey research, achieve 33% higher profitability and 200% greater growth than peers. They accomplish this not through lucky predictions but through structured processes that expand strategic optionality.
7 Practices That Separate Leaders from Laggards
The 500-company survey revealed specific behaviors that distinguish foresight leaders. These aren’t generic platitudes about “being innovative” or “thinking long-term.” They’re concrete, replicable practices.
1. Systematic Horizon Scanning Across Multiple Time Frames
Elite foresight organizations don’t just monitor trends—they operate what Shell pioneered decades ago: simultaneous tracking across near-term (1-2 years), medium-term (3-5 years), and long-term (10+ years) horizons.
This tri-focal approach prevents the “next quarter trap” while maintaining operational relevance. When Amazon invested billions in AWS infrastructure in the early 2000s despite intense retail competition, executives were operating on a 10-year horizon that recognized cloud computing’s inevitability—even when quarterly investors questioned the spending.
The Atlantic Council’s Global Foresight 2025 survey of 357 global strategists demonstrates this multi-horizon necessity. Respondents tracking only near-term signals missed critical shifts in geopolitical tensions, AI trajectory, and climate impacts that unfolded across longer timescales.
Leaders establish formal scanning rhythms: daily for breaking developments, weekly for emerging patterns, monthly for trend synthesis, and annually for major scenario updates. This isn’t information overload—it’s disciplined intelligence gathering.
2. Dedicated Futures Teams With Strategic Influence
Seventy-three percent of elite foresight companies maintain permanent foresight functions, compared to just 19% of basic-level organizations. But mere existence isn’t enough. What matters is structural power.
At the European Commission, strategic foresight operates under direct political leadership with coordination across all directorates-general. This institutional design ensures futures insights shape policy rather than gathering dust in reports.
Microsoft CEO Satya Nadella exemplifies leadership commitment to foresight. His 2014 decision to pivot Microsoft toward cloud-first computing wasn’t based on current market dominance but on scenario analysis showing inevitable cloud migration across all business software. The company unified around this future before competitors recognized its arrival, creating years of competitive advantage.
Effective foresight teams blend diverse skills: data scientists who detect weak signals in noise, scenario planners who craft compelling narratives, and strategists who translate implications into action. They report directly to C-suite and present regularly to boards.
3. Integration of Quantitative and Qualitative Signals
Basic organizations rely primarily on hard data—market research, financial metrics, technology adoption curves. Elite organizations combine this with qualitative intelligence: expert interviews, ethnographic research, speculative prototyping, and systematic collection of “strange” observations that don’t fit existing mental models.
World Economic Forum research emphasizes this blended approach, combining primary research, expert insights, and AI-driven pattern recognition to detect early signals of change. The goal is bypassing traditional horizon scanning for continuous, data-rich approaches that catch what purely quantitative methods miss.
When Pierre Wack developed Shell’s scenario planning methodology in the 1970s, his breakthrough came from interviewing Saudi oil ministers and Middle Eastern power brokers—qualitative intelligence that revealed the political will for oil price shocks before econometric models showed possibility. Shell prepared; competitors were blindsided.
Today’s leaders apply similar principles with modern tools. They monitor academic preprints, patent filings, startup funding patterns, regulatory commentary periods, and social media sentiment shifts—mixing structured and unstructured data to form early warning systems.
4. Scenario Planning With Wildcard Provisions
Eighty percent of surveyed companies that practice scenario planning limit themselves to 2-3 relatively conservative scenarios, usually clustered around “base case,” “upside,” and “downside” variations of existing trajectories. Elite foresight organizations develop 4-5 scenarios that explicitly include wildcards—low probability, high impact events that would fundamentally alter the playing field.
The European Commission’s 2025 Strategic Foresight Report emphasizes this “Resilience 2.0” approach: scanning not only for emerging risks but for unfamiliar or hard-to-imagine scenarios. The erosion of international rules-based orders, faster-than-expected climate impacts, and novel security challenges all require considering futures that seem implausible by today’s standards.
Effective scenarios must be relevant to decision-makers, challenging enough to stretch thinking, and plausible despite differing from conventional expectations. They become shared mental models that prepare organizations for various possibilities rather than optimizing for a single forecast.
5. Cross-Functional Collaboration Rituals
Foresight cannot be the exclusive domain of a centralized team. Leading organizations establish regular “strategic conversation” forums that bring together operations, R&D, marketing, finance, and external advisors to collectively make sense of signals and implications.
At Singapore’s government agencies, which assisted by Shell’s scenario team in the 1990s, cross-ministry foresight councils ensure that futures thinking shapes everything from education policy to infrastructure investment. This prevents siloed planning where each department optimizes for different assumed futures.
McKinsey’s Design x Foresight approach democratizes futures thinking by involving employees at all levels in scenario workshops and future concepting exercises. This builds organizational “futures literacy”—the capacity to use anticipation more effectively across all decisions, not just strategic ones.
These rituals must be structured yet creative, data-informed yet imaginatively open. The goal is collective intelligence that transcends individual mental models.
6. Technology-Enabled Early Warning Systems
Elite organizations leverage AI and machine learning to process signal volume that overwhelms human analysts. Sixty-five percent of foresight leaders deploy automated monitoring systems, compared to 23% of laggards.
BCG’s latest research on strategic foresight emphasizes blending powerful analytics with proven creative tools. Companies use natural language processing to scan millions of documents for emerging themes, anomaly detection algorithms to flag unexpected patterns, and network analysis to map how trends interconnect.
However, technology is enabler, not replacement. Humans still design what to monitor, interpret ambiguous signals, and make judgment calls about strategic implications. The most sophisticated systems create human-AI collaboration where machines provide breadth and speed while humans contribute contextual wisdom and ethical reasoning.
Companies deploying AI-powered foresight capabilities report 4.5 times greater likelihood of identifying significant opportunities early, according to survey data.
7. Leadership Commitment to “Looking Around Corners”
None of the above matters without genuine executive commitment. BCG survey findings reveal that while 71% of executives believe their companies manage strategic risks well, this confidence exceeds actual preparedness.
True commitment means:
- Allocating permanent budget for foresight work (not just consulting projects)
- Rewarding managers who surface uncomfortable futures (not just those who hit quarterly targets)
- Dedicating board meeting time to scenario discussion (not just financial review)
- Making strategic resource allocation decisions based on multiple futures (not just extrapolated forecasts)
When Andy Jassy leads Amazon strategy discussions, he reportedly begins with “what futures are we planning for?” rather than “what’s our forecast?” This subtle framing shift acknowledges uncertainty and invites adaptive thinking.
The Dual-Track Approach: Managing Knowns and Unknowns
The most sophisticated insight from the 500-company survey concerns how elite organizations structure their foresight work. They operate on two parallel tracks simultaneously: tracking predictable future events alongside genuine uncertainties.
Track One: Knowable Futures Some aspects of the future are essentially predetermined by current structure. Demographics, infrastructure replacement cycles, debt maturation schedules, regulatory implementation timelines, and geophysical trends all create knowable constraints and opportunities.
For example, we know with high confidence that by 2035, the working-age population in Japan will be smaller than today, that many European countries’ electrical grids will require massive upgrades, and that numerous corporate debt facilities will refinance at different rates. These aren’t predictions—they’re structural realities already set in motion.
Elite foresight organizations systematically catalog these knowable futures and identify strategic implications. What talent strategies does aging demographics require? Which infrastructure constraints will create bottlenecks? Where will refinancing pressures create acquisition opportunities?
Track Two: Genuine Uncertainties Simultaneously, leaders track true unknowns—factors that could evolve in fundamentally different directions. Will artificial intelligence development follow incremental improvement or breakthrough discontinuity? Will deglobalization accelerate or reverse? Will climate adaptation strategies prove more important than mitigation?
For these uncertainties, scenario planning creates alternative narratives. Rather than trying to predict which scenario will unfold, organizations prepare capabilities to succeed across multiple possibilities.
The power of this dual-track approach is avoiding both the trap of false precision (pretending uncertainty is predictable) and the trap of paralysis (claiming nothing is knowable). Both tracks inform strategy, but differently. Knowable futures drive commitments; uncertainties drive optionality.
Framework Visualization:
Imagine a matrix with two axes:
Vertical Axis (Predictability): HIGH (Knowable Trends) → LOW (True Uncertainties)
Horizontal Axis (Time Horizon): SHORT (1-2 years) → MEDIUM (3-5 years) → LONG (10+ years)
Elite companies populate all quadrants with specific items:
- High Predictability / Short Term: Regulatory implementation schedules, major infrastructure projects
- High Predictability / Long Term: Demographic shifts, climate trajectory, debt cycles
- Low Predictability / Short Term: Geopolitical events, technology breakthroughs, market disruptions
- Low Predictability / Long Term: AI capabilities, energy systems, geopolitical order
Technology Stack for Strategic Foresight in 2025
Modern foresight capabilities rely on integrated technology platforms. Here’s what leaders deploy:
Signal Detection and Aggregation: Companies use platforms like Contify, Recorded Future, and Strategyzer to aggregate signals from news, academic publications, patents, regulations, and social media. These tools employ machine learning to identify emerging patterns before they reach mainstream awareness.
Scenario Development and Testing: Software like Scenario360 and Ventana Systems enables teams to model complex scenarios with interdependent variables. Organizations can test how strategies perform under different future conditions before committing resources.
Competitive Intelligence: Platforms including CB Insights, PitchBook, and Owler track competitor moves, startup funding patterns, and market positioning shifts—providing early indicators of strategic direction changes.
Weak Signals Monitoring: Tools like Meltwater and Talkwalker detect sentiment shifts and nascent trends in unstructured data. They flag when fringe topics begin gaining traction, providing months of advance warning.
Collaborative Foresight: Software like Miro, MURAL, and IdeaScale facilitates distributed scenario workshops and futures conversations, essential as work becomes more remote and global.
The technology investment for mid-sized companies ranges from $100,000 to $500,000 annually, generating returns through earlier opportunity identification and risk avoidance worth millions.
ROI of Strategic Foresight: The Business Case
CFOs reasonably ask: what’s the financial return on foresight investment? The BCG survey provides quantifiable answers.
Companies with advanced foresight capabilities report:
- 33% higher profitability compared to peers with basic capabilities
- 200% greater revenue growth over five-year periods
- Meaningful valuation premiums averaging 15-20% in comparable sector analyses
The mechanisms driving these returns:
Risk Mitigation Value: Early warning of threats enables proactive response rather than crisis management. When companies detect regulatory shifts 18-24 months before implementation rather than 6 months, they can influence outcomes and optimize compliance costs. The value here is avoiding losses.
Opportunity Capture: Foresight leaders enter new markets, acquire capabilities, and launch innovations 12-18 months before competitors recognize opportunities. First-mover advantages in emerging spaces create sustained profitability.
Strategic Efficiency: Organizations that align on clear scenarios waste less energy debating which future to plan for. Strategy execution accelerates when leadership teams share mental models of plausible futures.
Resilience Premium: Companies demonstrating systematic foresight capabilities trade at valuation premiums because investors recognize preparedness for uncertainty. This matters especially during volatility when resilient companies outperform.
One BCG client in automotive manufacturing used foresight to identify supply chain vulnerabilities 18 months before the semiconductor shortage. They secured alternative suppliers and redesigned products to reduce chip dependency, maintaining production when competitors idled plants. The revenue protection exceeded $400 million.
Implementation Roadmap: Getting Started
Most organizations don’t need to immediately build Shell-level scenario capabilities. Here’s a practical 90-day path from basic to intermediate foresight maturity:
Days 1-30: Establish Foundation
- Designate a foresight champion (existing strategy team member is fine initially)
- Conduct stakeholder interviews: What future uncertainties keep executives awake?
- Create initial scanning architecture: Identify 10-15 sources across PESTLE domains (political, economic, social, technological, legal, ecological) to monitor systematically
- Set up simple tracking system (shared spreadsheet suffices at first)
Days 31-60: First Scenario Exercise
- Facilitate 2-day workshop with cross-functional leadership team
- Identify 2-3 critical uncertainties most relevant to your organization’s future
- Develop 3-4 distinct scenarios (avoid “good/bad/likely” trap)
- For each scenario, answer: What would success look like? What early indicators would signal this future emerging?
Days 61-90: Integration and Rhythms
- Present scenarios to board; incorporate into strategic planning cycle
- Establish monthly “futures pulse” meeting where team reviews signals and updates scenario likelihood
- Identify 2-3 strategic options that perform well across multiple scenarios (these become prioritized initiatives)
- Commit budget and resources for continued foresight capability building
Common Pitfalls to Avoid:
Don’t outsource completely. External consultants can facilitate initial capability building, but foresight must become internal competency. Organizations that treat it as occasional consulting projects never develop the muscle memory.
Don’t create another strategic planning layer. Foresight should enhance and inform strategy, not become parallel bureaucracy.
Don’t expect perfect predictions. Scenarios that “come true” exactly as described means you weren’t stretching thinking enough. The goal is preparedness for surprises, not prophecy.
Don’t keep it top-secret. Broader organizational awareness of scenarios creates shared context that enables faster, more aligned responses when futures begin unfolding.
Success Metrics to Track:
- Number of weak signals identified before competitors
- Strategic initiatives stress-tested against multiple scenarios
- Leadership team alignment on plausible futures (measure through surveys)
- Reduced response time when market conditions shift
- Resource allocation flexibility (ability to pivot without sunk cost paralysis)
The Foresight Dividend
In January 2025, when CEO surveys showed unprecedented uncertainty, companies with mature foresight capabilities faced the same volatile environment as everyone else. The difference? They had already pressure-tested strategies against scenarios including geopolitical fragmentation, AI acceleration, climate tipping points, and financial system stress.
Q: How do companies predict future trends?
A: Leading companies don’t predict—they prepare for multiple plausible futures simultaneously. They use systematic horizon scanning across short and long-term timeframes, develop 4-5 distinct scenarios including wildcards, deploy AI-powered signal detection systems, and establish cross-functional foresight teams with strategic influence. This dual-track approach monitors both predictable future events (demographics, infrastructure cycles) and genuine uncertainties (technology breakthroughs, geopolitical shifts), enabling proactive adaptation rather than reactive crisis management.
They weren’t paralyzed by uncertainty—they were prepared for it. Some scenarios they’d developed years earlier were unfolding. Others proved wrong. But the organizational capacity to think in multiple futures, stress-test assumptions, and maintain strategic flexibility had become embedded culture.
Strategic foresight isn’t fortune-telling. It’s structured preparation for a range of plausible futures, systematic monitoring for early signals of which futures are emerging, and organizational agility to adapt as reality unfolds. In an era where global uncertainty measures have doubled in 30 years, this capability separates winners from casualties.
The seven percent of companies operating at elite foresight maturity aren’t smarter or luckier than others. They’re simply more systematic about the future. And systematization is learnable, replicable, and surprisingly affordable relative to returns generated.
The question isn’t whether your organization needs strategic foresight—uncertainty has already answered that. The question is whether you’ll build the capability deliberately or learn its importance through painful surprise.
The companies profiled in the 500-organization survey made their choice. The performance gap between leaders and laggards will only widen as volatility accelerates. Which side of that divide will your organization occupy in 2030?
Key Takeaway: Strategic foresight delivers quantifiable competitive advantage through systematic practices that track both predictable futures and genuine uncertainties across multiple time horizons. The capability is accessible to organizations of any size willing to build it as embedded competency rather than episodic exercise. In an era of rising uncertainty, it’s no longer optional—it’s survival insurance and growth catalyst combined.
Sources Cited:
- Harvard Business Review: BCG Strategic Foresight Survey
- McKinsey: Strategy Champions Analysis
- Boston Consulting Group: Navigating the Future
- European Commission: Strategic Foresight 2025
- Atlantic Council: Global Foresight 2025
- OECD: Strategic Foresight Toolkit
- World Economic Forum: Strategic Foresight Importance
- Shell Global: Scenarios Practice
- McKinsey: Design x Foresight Approach
- BCG: Strategic Risk Preparedness
Discover more from The Economy
Subscribe to get the latest posts sent to your email.


Introduction
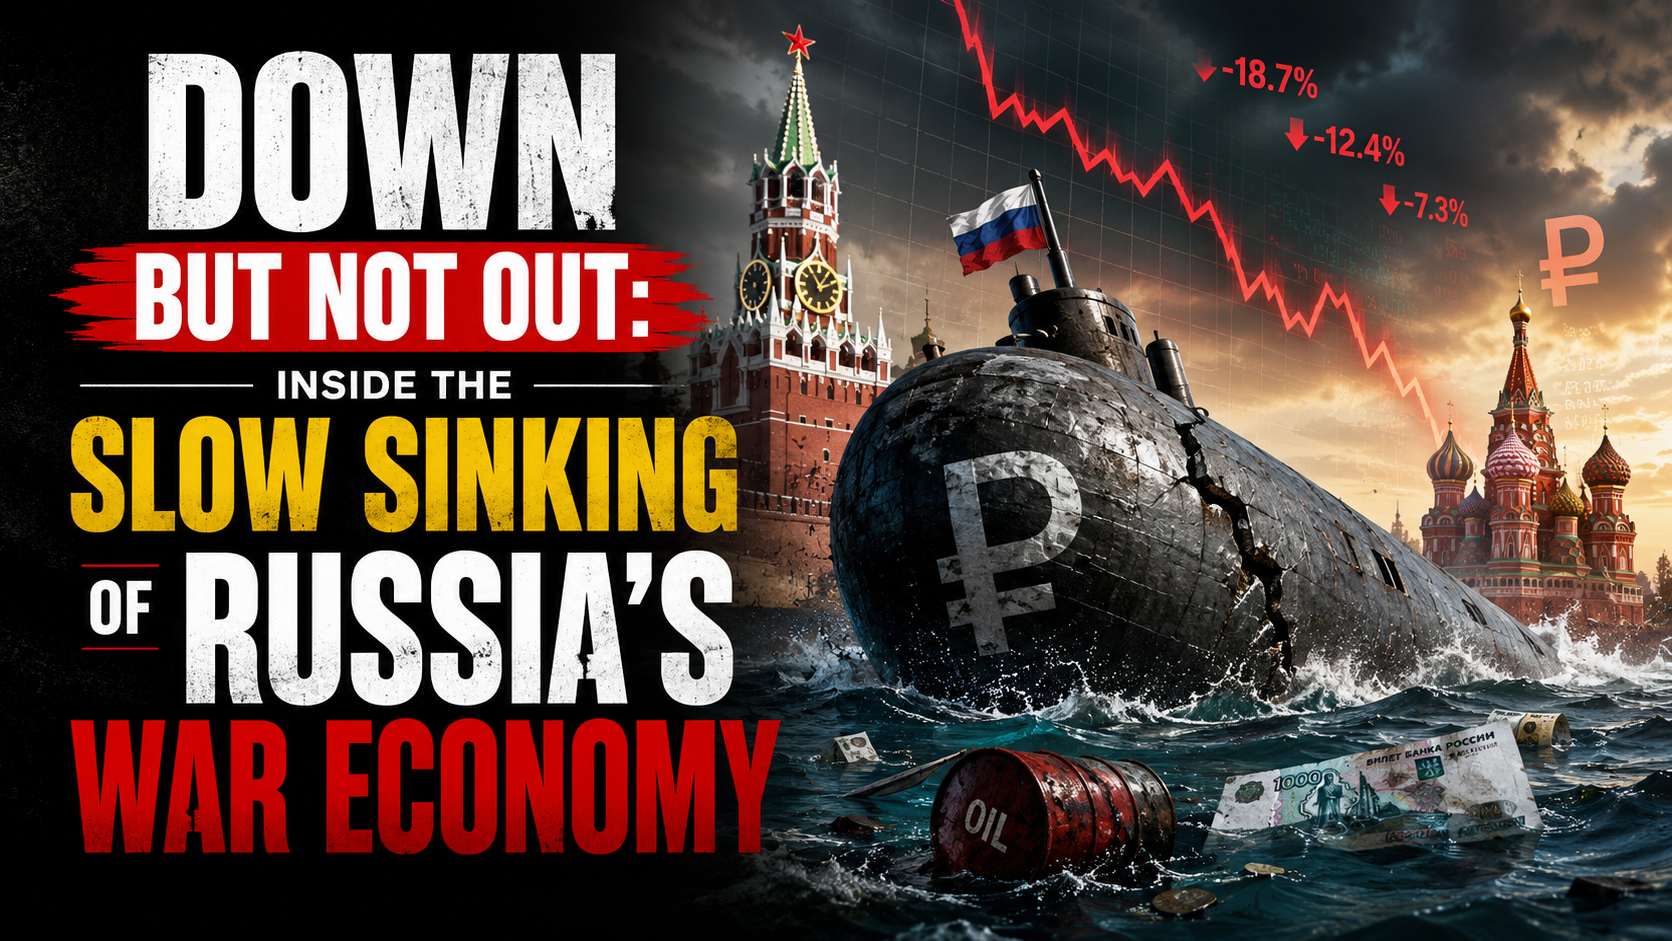
The European Council formally extended its economic sanctions against Russia for another full year on 25 June 2026, keeping restrictive measures in place until 31 July 2027 (Council of the EU). More than four years into the war, the headline story of Russia’s economy has shifted from whether sanctions would work to a more nuanced question: how much longer can the Kremlin keep financing the war before the accumulated strain becomes impossible to hide behind favorable official statistics.
The Sanctions Architecture, Renewed Again
The EU’s economic measures against Russia, first introduced in 2014 and dramatically expanded after the February 2022 full-scale invasion, now span trade, finance, energy and dual-use technology restrictions, alongside asset freezes and travel bans on a broad range of individuals and entities (Council of the EU). Since February 2022, the EU has adopted 20 separate sanctions packages, and the European Council has explicitly stated it remains determined to keep weakening Russia’s war economy by further reducing its energy revenues, curbing shadow-fleet oil shipping operations and constraining its banking system (Council of the EU). Separately, on 3 July 2026 the EU sanctioned six individuals connected to the poisoning and death of opposition figure Alexei Navalny, underscoring that the sanctions regime continues to expand on human-rights grounds as well as economic ones (Council of the EU Sanctions Timeline).
The Headline Numbers Beijing-Style Optimism Can No Longer Explain Away
Russia’s GDP is now put at roughly $2.51 trillion, the world’s eleventh-largest economy — comparable in size to South Korea despite Russia’s vastly larger landmass and resource base — with 2026 growth projected at just 1.0% and inflation running at 5.2% (Statistics of the World). More pessimistic estimates put full-year 2026 growth even lower, at around 0.4%, which would be worse than 2025’s already-weak 1% expansion and would mark a sharp deceleration from the 4.1% growth Russia posted in 2023 as it forged new trading relationships to route around initial sanctions (Forbes).
Oil and gas revenues — historically around half of Russia’s state income — have fallen to roughly a quarter, a deliberate outcome of Western sanctions strategy that targets how much Russia earns from exports rather than blocking those exports outright (Stockholm School of Economics/SITE). Russia’s oil and gas budget revenues reportedly halved in January 2026 alone, with crude prices falling below $73 a barrel before the Middle East conflict briefly reversed the trend, sending Brent surging more than 55% to near $120 a barrel at its peak (Forbes).
The Middle East War: A Temporary Lifeline With Long-Term Costs
The spike in oil prices tied to the Iran conflict, combined with a period of eased US sanctions enforcement on Russian oil under President Trump, offered Moscow unexpected fiscal breathing room in mid-2026 (Forbes). But that same conflict has undermined Russia’s longer-term energy diversification ambitions in the region: two Russian-backed power plant projects in Iran have been put on hold, along with oil and gas exploration work and plans to build new transit routes linking Russia to India via Iran (Forbes).
The Gap Between Official Statistics and Underlying Reality
Perhaps the most important analytical point from recent research is not about any single data point but about the reliability of Russian statistics themselves. Torbjörn Becker of the Stockholm Institute of Transition Economics has argued the real test of sanctions is not whether they end the war overnight, but how much they erode the Kremlin’s capacity to finance it — and by that measure, the evidence points to deeper strain than headline GDP figures suggest (Stockholm School of Economics/SITE). Becker notes that Russia’s economy grew only modestly in 2022 despite oil prices rising sharply that year — a gap between expected and actual performance that implies a considerably larger hidden economic hit than the official contraction figures showed (Stockholm School of Economics/SITE). Compounding the problem, Russian authorities have stopped publishing several key statistics since 2022, making independent assessment of inflation, consumption and real economic conditions increasingly difficult — leading Becker to conclude that “statistics have become part of the narrative” rather than a neutral measure of economic reality (Stockholm School of Economics/SITE).
The Military-Civilian Economic Split
A recurring theme across recent analysis is the growing bifurcation between Russia’s overheating military-industrial sector and a stagnating civilian economy. This imbalance has pushed interest rates higher and forced the liquidation of a striking 71% of Russia’s gold reserves to help fund continued war spending (Forbes). Russia’s total fossil fuel export revenue is estimated at roughly €734 million per day, underscoring just how central hydrocarbon income remains to the entire war financing model even as that revenue stream shrinks (Forbes).
The Counter-Narrative: Wages Still Rising
It would be inaccurate to describe Russia’s economy as in freefall. CSIS research notes that Russian salaries rose 17.8% in nominal terms and 8.7% in real terms in 2024 compared to 2023, with disposable incomes up 6.1% in 2023 and 7.3% in 2024 — growth rates not seen in Russia in almost two decades (CSIS). Government budget projections still expect real salaries to rise, albeit at a decelerating pace: 7% in 2025, 5.7% in 2026 and 4.1% in 2027 — a marked slowdown from the 2024 peak but still roughly double the pre-invasion decade average (CSIS). This wage growth, driven substantially by wartime labor shortages and military-adjacent spending, is precisely the kind of headline-stabilizing data point that has allowed Putin to argue publicly that sanctions have failed to cripple his economy (Fortune) — even as think tanks describe the broader trajectory as pushing Russia toward what one report calls an “economic, political, and military abyss” (Fortune).
What Comes Next
Renewed legislative pressure in Washington — including the Sanctioning Russia Act introduced with strong bipartisan support — signals appetite in the US for tightening the screws further, even as the loss of a key congressional champion for that effort has complicated the political path forward (TIME). Whether the EU’s renewed sanctions regime, continued oil price pressure, and constrained reserves ultimately force a shift in Kremlin calculus toward negotiation remains the central open question for 2027.
Key Takeaways
- The EU has extended Russia sanctions for a further year, through 31 July 2027, continuing a regime built from 20 separate packages since 2022.
- Russia’s 2026 GDP growth is forecast between 0.4% and 1.0%, a sharp deceleration from 2023’s 4.1% post-shock rebound.
- Oil and gas revenue’s share of Russian state income has fallen from roughly half to about a quarter as Western sanctions target export earnings specifically.
- Russia has liquidated a large share of its gold reserves to sustain war financing amid a widening split between an overheating military sector and a stagnating civilian economy.
- Official Russian statistics likely understate the true economic strain, according to independent economists who cite a widening gap between reported and expected performance.
Sources: Council of the EU, Council of the EU Sanctions Timeline, Stockholm School of Economics/SITE, Forbes, Statistics of the World, CSIS, Fortune, TIME
Discover more from The Economy
Subscribe to get the latest posts sent to your email.
The Federal Reserve’s independence faces its most serious test in decades: a Justice Department investigation into Chair Jerome Powell over building-renovation costs, a Supreme Court case over Trump’s attempt to fire Governor Lisa Cook, and an incoming chair nomination openly tied to Trump’s demand for rates cut “by a lot” — all unfolding as the Fed tries to keep monetary policy decisions separate from the White House.
An institutional crisis hiding inside a rate-cut story
Most financial coverage this year has framed the Federal Reserve story as a simple tug-of-war over interest rates. That framing understates what is actually happening: a structural challenge to the 111-year-old convention that US monetary policy sits outside presidential control — a convention every advanced economy has treated as a prerequisite for market credibility.
The three fronts of the fight
1. The Powell investigation. In January, federal prosecutors served grand jury subpoenas tied to Powell’s congressional testimony about roughly $2.5 billion in cost overruns on the Fed’s headquarters renovation. Powell called the inquiry a “pretext” for punishing the central bank for not cutting rates as quickly as the administration wants, and warned it should be viewed “in the broader context of the administration’s threats and ongoing pressure” on the institution (CNBC). Every living former Fed chair signed a joint statement calling the probe an unprecedented attempt to use prosecutorial pressure to undermine central bank independence (NBC News).
2. The Lisa Cook case. The Supreme Court has separately taken up whether Trump can remove Fed Governor Lisa Cook over mortgage-fraud allegations she denies — a case with direct bearing on whether a president can reshape the Fed’s voting board outside the normal confirmation process (Euronews).
3. The succession fight. Trump has said publicly that Powell’s replacement — due when his term as chair ends in 2026 — should be someone who “believes in lower interest rates, by a lot” (Bloomberg). Analysts note this is a break from decades of precedent in which presidents, whatever their private preferences, avoided direct pressure on the Fed’s leadership pipeline.
Why markets are watching the mechanics, not just the rhetoric
It’s worth noting a structural check that has received less attention than it deserves: the Fed chair casts only one of twelve votes on the Federal Open Market Committee. Appointing a more compliant chair does not, by itself, guarantee the rate cuts Trump wants — any change still requires majority support across the full committee (CBS/AOL).
That has not stopped the market repricing. Following Powell’s Jackson Hole remarks suggesting the Fed could act if the labour market kept weakening, traders moved to price an 85% probability of a September rate cut, sending the S&P 500, Nasdaq and Dow higher while the dollar index and Treasury yields fell — a reaction some economists read as evidence that political pressure is already bleeding into policy expectations, independent of the FOMC’s actual vote (Barchart).
At the same time, inflation data complicates the picture for anyone expecting an easy capitulation. The Fed’s preferred inflation gauge, the PCE price index, sat at 2.8% year-over-year as of November — still above the Fed’s 2% target — while the FOMC’s December dot plot showed a more cautious rate path than markets had previously expected, with the median policymaker view placing the federal funds rate in the low-to-mid 3% range by the end of 2026 (CNBC).
Why it matters beyond the US
Central bank independence is not a purely domestic US concern. The dollar’s role as the world’s reserve currency, and Treasury yields’ function as the global risk-free benchmark, mean that any erosion in perceived Fed independence has second-order effects on borrowing costs from London to Karachi. Emerging-market central banks — including the State Bank of Pakistan and Bank Indonesia — routinely calibrate their own policy against expected Fed moves; a Fed seen as politically compromised makes that calibration harder and potentially more volatile for every economy that prices debt off US Treasuries.
RSM chief economist Joe Brusuelas has predicted Powell will use his public platform to mount “an erudite but accessible defense of central bank independence” at upcoming FOMC press conferences — a sign that Fed leadership itself views the institutional question, not just the rate decision, as the story that matters (AOL/CBS).
What to watch next
- Whether the DOJ investigation into Powell produces formal charges or fizzles amid criticism of its timing
- The Supreme Court’s ruling on the Cook removal case, which could set precedent for presidential authority over independent agency officials generally
- Trump’s formal nomination for the next Fed chair, and how openly that nominee campaigns on a specific rate target
- Whether the FOMC’s committee-based voting structure continues to act as a moderating check regardless of who chairs the meetings
The rate-cut headlines will keep coming. The more consequential story is whether the institutional guardrails around the Fed — designed explicitly to keep monetary policy insulated from electoral cycles — hold through 2026.
Discover more from The Economy
Subscribe to get the latest posts sent to your email.
Most headlines on Russia’s economy in July 2026 focus on the latest sanctions package or oil price cap negotiation. The more important story is structural: the model Russia has used to fund its war for four years is showing real signs of running out of road.
The core finding
A research brief from the Center for Strategic and International Studies (CSIS) argues Putin is pushing Russia toward an “economic, political, and military abyss,” according to Fortune. While Russia’s economy remains large — roughly $2.6 trillion — growth is slowing and shrinking on a quarterly basis, with 2026 growth projected at just 0.4%, worse than 2025’s 1% growth, which itself narrowly avoided recession.
Analysts describe Russia’s approach as a form of “military Keynesianism” — the state investing heavily in militarizing the economy while extending financial support to households affected by the war. But per Fortune’s reporting, “after more than four years of war, that well is running dry.” Russia’s fiscal reserves are dwindling, and 71% of the country’s gold reserves have been liquidated to sustain spending.
The number that matters most: oil and gas budget share
The most underreported data point here: the share of oil and gas receipts in Russia’s federal budget revenue fell to just 23% in 2025 — the lowest share in two decades — according to the Oxford Institute for Energy Studies, cited by Fortune. To compensate, Russia has turned to expansive taxation, including raising VAT from 20% to 22% — a move that has proven unpopular domestically.
This matters because Russia’s economy has historically been described, correctly, as fossil-fuel dependent — with oil and gas taxation making up 44% of federal revenues in the decade before the Ukraine invasion, and still around 24.5% over the first three quarters of 2025, according to a Brookings Institution analysis. A further slide to 23% signals the sanctions and diversification pressure are compounding, even as Russia continues finding workarounds through its “shadow fleet.”
The Iran-war reprieve was temporary — and it’s over
The Iran war offered Russia a brief lifeline: Brent crude surged more than 55% at its peak, nearing $120 a barrel, after President Trump eased some sanctions on Russian oil, per Fortune. But that chaos also undermined Russia’s own long-term energy and infrastructure projects in the Middle East — two Russian-linked power plants in Iran were put on hold, along with oil and gas exploration and plans to link Russia to India via Iran through new transit routes. Since then, oil prices have normalized as demand softened and the Strait of Hormuz reopened, removing that temporary cushion.
The sanctions escalation now in motion
The pressure is intensifying on multiple fronts simultaneously. US senators unveiled a sweeping bipartisan Russia sanctions bill in mid-July, which would impose mandatory sanctions on Russian political and military leaders including President Putin, and up to a 100% tariff on the top five countries — including China and India — that purchase Russian crude oil and natural gas, according to CNN. Separately, the EU has been racing to avoid an automatic upward revision of its Russian oil price cap, which would otherwise jump from $44.10 to roughly $58 per barrel if a new sanctions package wasn’t agreed by July 15, per Euronews.
Analysis from the Center for European Policy Analysis notes the outcome depends heavily on whether India and China accept the risk of secondary sanctions: “If China stands firm, Moscow’s dependence on Beijing deepens,” per CEPA. If Russian seaborne oil exports were to fall to near-zero, the budget would lose roughly a quarter of its revenue — an extreme but non-trivial scenario given the pace of legislative and diplomatic pressure building in July 2026.
Why this matters beyond Russia
For countries positioned between Western sanctions regimes and continued Russian energy purchases — including India, and by extension trade partners like Pakistan whose remittance and trade flows intersect with Gulf and South Asian energy markets — the trajectory of Russia’s budget dependency and the secondary-sanctions risk attached to its buyers is a live variable, not a settled one. A further deterioration in Russia’s oil-and-gas revenue share would likely accelerate Moscow’s reliance on China specifically, reshaping regional energy-trade alignments well beyond the Russia-Ukraine conflict itself.
FAQ
What percentage of Russia’s federal budget comes from oil and gas? 23% in 2025 — the lowest share in two decades, according to the Oxford Institute for Energy Studies.
What is Russia’s projected GDP growth for 2026? 0.4%, according to CSIS research cited by Fortune — down from 1% growth in 2025.
What is “military Keynesianism” in the context of Russia’s economy? A term analysts use to describe Russia’s strategy of heavy state investment in militarizing the economy alongside financial support for war-affected households, functioning as a form of stimulus that is now showing signs of fiscal strain.
Discover more from The Economy
Subscribe to get the latest posts sent to your email.

Pakistan Gulf Investment Outflows 2026: Peace Deal Stakes Explained

Canada Trade Diversification 2026: China, Indonesia, UAE Deals Explained

US Forced-Labour Tariffs on 60 Countries: The Hidden Trade Shock of 2026

Global Central Banks 2026: Fed, BoE and BoJ Decisions Could Reshape Markets

Gulf Capital Retreat From Pakistan 2026: UAE Loan Freeze & What It Means

Pakistan’s Most Reliable Export Is Its People: Remittances Hit $41.6 Billion, Overtaking Total Exports

Indonesia’s Confidence Problem: Record Investment, a Sinking Rupiah, and a Widening Credibility Gap

Down But Not Out: Inside the Slow Sinking of Russia’s War Economy

China’s Growth Slips to a Four-Year Low: Why Beijing Still Won’t Pull the Stimulus Trigger

The Johor-Singapore Corridor: How Malaysia Became Southeast Asia’s AI Infrastructure Powerhouse

Canada’s Economy ‘On Pause’: Inside the CUSMA Deadline That Passed Without a Deal

Dubai’s Millionaire Magnet: How the UAE Turned Middle East Turmoil Into a Capital Safe-Haven Boom

Britain’s Sixth Prime Minister in a Decade: What Starmer’s Exit Means for Gilts, Sterling and Your Portfolio

Anthropic Offers Up to $600,000 Salary for Critical IPO Role as AI Giant Prepares for Wall Street Debut

Carry Trade Unwind 2026: How the Yen’s Snapback Triggered a Global Margin Call

AI Bubble Warning 2026: Why BIS, IMF and Bank of England Fear a Market Crash

BRICS De‑Dollarization Strategy Takes Shape with $15 Billion Local‑Currency Push

The AI Super Bubble Is Ready to Burst

Russia Bans Diesel Exports 2026: Global Fuel Market Impact Explained

Strait of Hormuz Blockade 2026: Oil Prices Surge 9% as US-Iran Conflict Reignites

Private Credit Warning: Most BDCs Turn Unprofitable in 2026, Reuters Finds

IMF Cuts Pakistan Growth Forecast, Raises Inflation to 8.4%

Bitcoin $150k Milestone Achieved as US Sovereign Crypto Pivot Looms
Gulf Capital Retreat From Pakistan 2026: UAE Loan Freeze & What It Means

India Economic Rise 2026: How the Subcontinent Toppled Japan

Strait of Hormuz 2026: Why Markets Still Don’t Trust It’s Open

Argentina Economy 2026: Milei’s Fiscal Surplus, Inflation Drop to 29%, and What Comes Next

China Housing Market Turnaround: White‑List Model Stabilises Prices
-

 Markets & Finance7 months ago
Top 15 Stocks for Investment in 2026 in PSX: Your Complete Guide to Pakistan’s Best Investment Opportunities
-

 Analysis5 months ago
Johor’s Investment Boom: The Hidden Costs Behind Malaysia’s Most Ambitious Economic Surge
-

 Analysis5 months ago
Top 10 Stocks for Investment in PSX for Quick Returns in 2026
-

 Analysis6 months ago
Brazil’s Rare Earth Race: US, EU, and China Compete for Critical Minerals as Tensions Rise
-

 Banks6 months ago
Best Investments in Pakistan 2026: Top 10 Low-Price Shares and Long-Term Picks for the PSX
-

 Investment7 months ago
Top 10 Mutual Fund Managers in Pakistan for Investment in 2026: A Comprehensive Guide for Optimal Returns
-

 Global Economy7 months ago
15 Most Lucrative Sectors for Investment in Pakistan: A 2025 Data-Driven Analysis
-

 Global Economy7 months ago
Pakistan’s Export Goldmine: 10 Game-Changing Markets Where Pakistani Businesses Are Winning Big in 2025