
Opinion
What Companies that Excel at Strategic Foresight Do Differently: The 2025 Competitive Intelligence Report

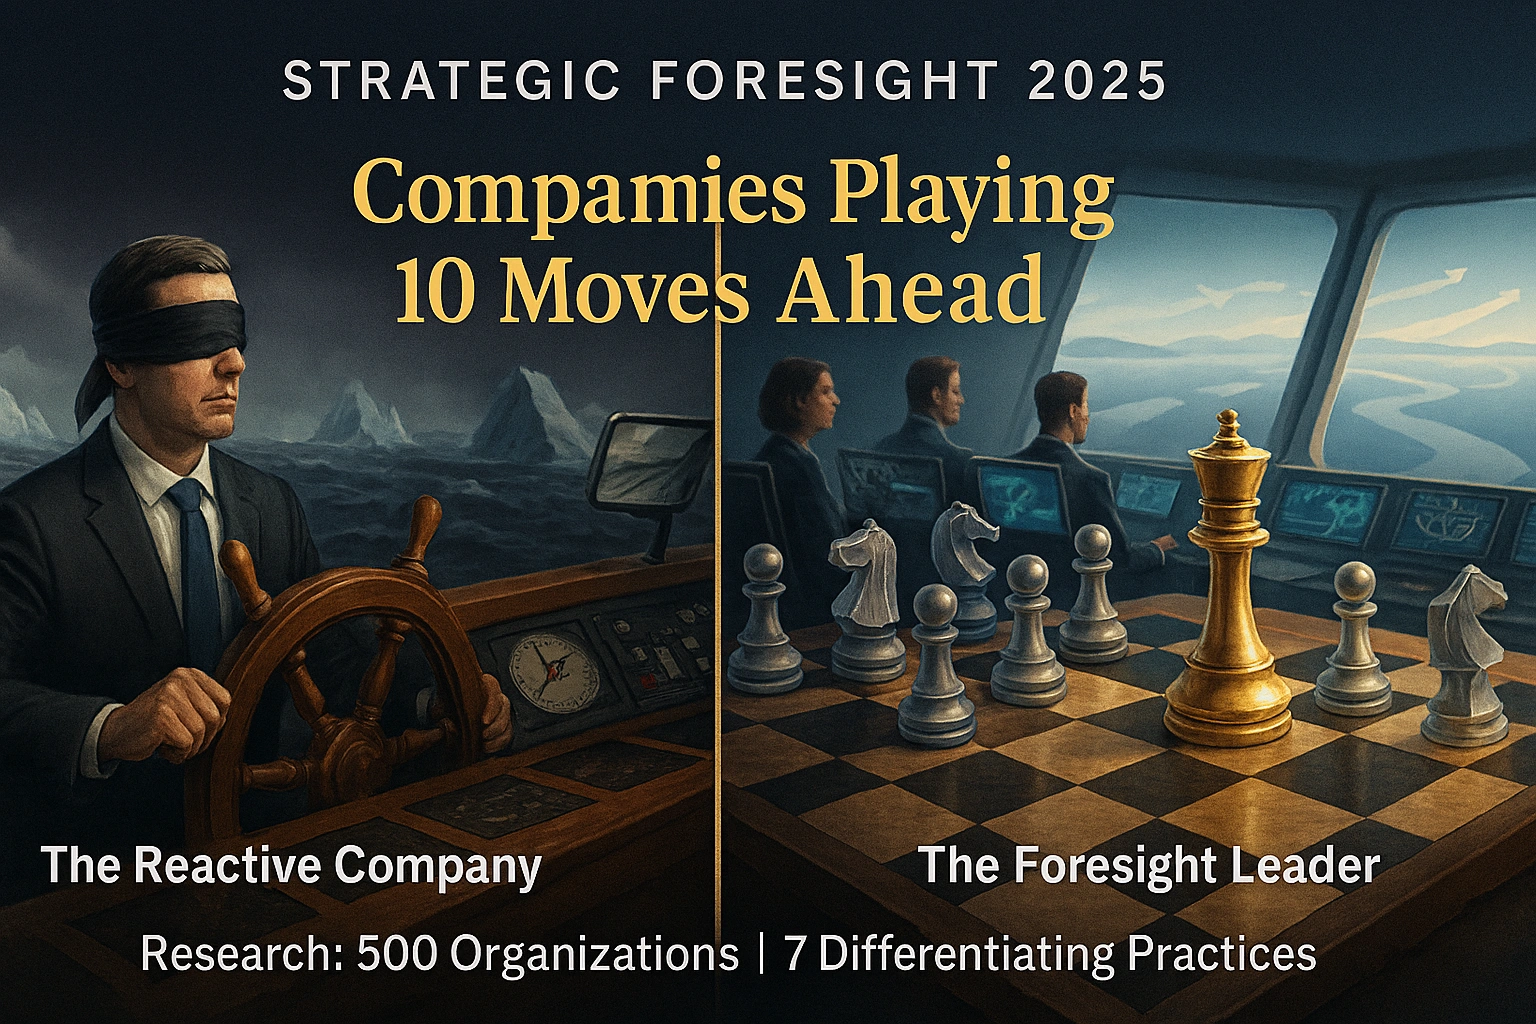
500-company survey reveals how top firms track predictable futures and unknowns. Learn the strategic foresight framework driving competitive advantage.
When The Body Shop shuttered its US operations in 2024, it wasn’t because executives lacked market data. The cosmetics retailer had access to the same consumer trend reports, sales analytics, and competitive intelligence as everyone else. What it lacked was something more fundamental: the ability to systematically scan multiple time horizons for both predictable shifts and genuine wildcards. While competitors like Sephora and Ulta Beauty were reimagining retail experiences around sustainability and digital engagement years earlier, The Body Shop remained anchored to strategies that worked in the past.
This isn’t an isolated failure. Based on analysis of earnings calls, discussions about uncertainty among CEOs spiked dramatically in 2025, with global uncertainty measures nearly double where they stood in the mid-1990s. Yet here’s the paradox: while executives universally acknowledge rising volatility, most organizations still approach the future reactively rather than systematically.
A groundbreaking survey of 500 organizations by Boston Consulting Group reveals a stark divide. Companies with advanced strategic foresight capabilities report meaningful performance advantages over peers—not through crystal balls, but through disciplined practices that track both knowable trends and true uncertainties across multiple time horizons. These firms don’t just survive disruption; they engineer competitive advantage from it.
This isn’t theory. It’s a quantifiable edge backed by data, and it’s available to any organization willing to build foresight as an embedded capability rather than a one-off planning exercise. Here’s exactly how they do it.
What Is Strategic Foresight? [Definition]
Strategic foresight is the systematic practice of exploring multiple plausible futures to anticipate challenges, identify opportunities, and make better decisions today. Unlike traditional forecasting that attempts to predict a single future, foresight acknowledges irreducible uncertainty and prepares organizations to thrive across various scenarios.
The core components include:
- Horizon scanning: Continuously monitoring signals of change across political, economic, social, technological, ecological, and legal domains
- Trend analysis: Distinguishing between temporary fluctuations and enduring shifts that will reshape industries
- Scenario planning: Developing multiple plausible future narratives that stress-test strategies against different conditions
- Strategic implications: Translating future insights into actionable decisions and resource allocation today
What makes strategic foresight different from strategic planning? Planning assumes a relatively stable future and optimizes for efficiency. Foresight assumes an uncertain future and optimizes for adaptability. According to the OECD, strategic foresight cultivates the capacity to anticipate alternative futures and imagine multiple non-linear consequences—capabilities increasingly vital as business environments grow more volatile.
The Strategic Foresight Maturity Model
The BCG survey of 500 organizations identified four distinct capability levels, with dramatic performance gaps between tiers. Understanding where your organization falls on this spectrum is the first step toward improvement.
STRATEGIC FORESIGHT MATURITY FRAMEWORK
| Maturity Level | Characteristics | Performance Impact | % of Organizations |
|---|---|---|---|
| Basic | Ad-hoc scanning, annual planning cycle, single forecast, executive intuition drives decisions | Frequently surprised by disruption, reactive strategy adjustments | 42% |
| Intermediate | Quarterly trend reviews, some scenario exercises, foresight team exists but operates in silo | Occasional early warnings, mixed response capability | 33% |
| Advanced | Continuous signal detection, integrated with strategy process, multiple scenarios inform decisions | Proactive adaptation, fewer blind spots, moderate performance edge | 18% |
| Elite | Systematic dual-track monitoring (knowns + unknowns), embedded throughout organization, explicit upside focus | Engineer competitive advantage from uncertainty, significant outperformance | 7% |
Only seven percent of companies qualify as foresight leaders, yet these organizations report substantially better financial performance and strategic resilience. The gap isn’t about spending—it’s about systematic practice.
Organizations with mature foresight capabilities, according to McKinsey research, achieve 33% higher profitability and 200% greater growth than peers. They accomplish this not through lucky predictions but through structured processes that expand strategic optionality.
7 Practices That Separate Leaders from Laggards
The 500-company survey revealed specific behaviors that distinguish foresight leaders. These aren’t generic platitudes about “being innovative” or “thinking long-term.” They’re concrete, replicable practices.
1. Systematic Horizon Scanning Across Multiple Time Frames
Elite foresight organizations don’t just monitor trends—they operate what Shell pioneered decades ago: simultaneous tracking across near-term (1-2 years), medium-term (3-5 years), and long-term (10+ years) horizons.
This tri-focal approach prevents the “next quarter trap” while maintaining operational relevance. When Amazon invested billions in AWS infrastructure in the early 2000s despite intense retail competition, executives were operating on a 10-year horizon that recognized cloud computing’s inevitability—even when quarterly investors questioned the spending.
The Atlantic Council’s Global Foresight 2025 survey of 357 global strategists demonstrates this multi-horizon necessity. Respondents tracking only near-term signals missed critical shifts in geopolitical tensions, AI trajectory, and climate impacts that unfolded across longer timescales.
Leaders establish formal scanning rhythms: daily for breaking developments, weekly for emerging patterns, monthly for trend synthesis, and annually for major scenario updates. This isn’t information overload—it’s disciplined intelligence gathering.
2. Dedicated Futures Teams With Strategic Influence
Seventy-three percent of elite foresight companies maintain permanent foresight functions, compared to just 19% of basic-level organizations. But mere existence isn’t enough. What matters is structural power.
At the European Commission, strategic foresight operates under direct political leadership with coordination across all directorates-general. This institutional design ensures futures insights shape policy rather than gathering dust in reports.
Microsoft CEO Satya Nadella exemplifies leadership commitment to foresight. His 2014 decision to pivot Microsoft toward cloud-first computing wasn’t based on current market dominance but on scenario analysis showing inevitable cloud migration across all business software. The company unified around this future before competitors recognized its arrival, creating years of competitive advantage.
Effective foresight teams blend diverse skills: data scientists who detect weak signals in noise, scenario planners who craft compelling narratives, and strategists who translate implications into action. They report directly to C-suite and present regularly to boards.
3. Integration of Quantitative and Qualitative Signals
Basic organizations rely primarily on hard data—market research, financial metrics, technology adoption curves. Elite organizations combine this with qualitative intelligence: expert interviews, ethnographic research, speculative prototyping, and systematic collection of “strange” observations that don’t fit existing mental models.
World Economic Forum research emphasizes this blended approach, combining primary research, expert insights, and AI-driven pattern recognition to detect early signals of change. The goal is bypassing traditional horizon scanning for continuous, data-rich approaches that catch what purely quantitative methods miss.
When Pierre Wack developed Shell’s scenario planning methodology in the 1970s, his breakthrough came from interviewing Saudi oil ministers and Middle Eastern power brokers—qualitative intelligence that revealed the political will for oil price shocks before econometric models showed possibility. Shell prepared; competitors were blindsided.
Today’s leaders apply similar principles with modern tools. They monitor academic preprints, patent filings, startup funding patterns, regulatory commentary periods, and social media sentiment shifts—mixing structured and unstructured data to form early warning systems.
4. Scenario Planning With Wildcard Provisions
Eighty percent of surveyed companies that practice scenario planning limit themselves to 2-3 relatively conservative scenarios, usually clustered around “base case,” “upside,” and “downside” variations of existing trajectories. Elite foresight organizations develop 4-5 scenarios that explicitly include wildcards—low probability, high impact events that would fundamentally alter the playing field.
The European Commission’s 2025 Strategic Foresight Report emphasizes this “Resilience 2.0” approach: scanning not only for emerging risks but for unfamiliar or hard-to-imagine scenarios. The erosion of international rules-based orders, faster-than-expected climate impacts, and novel security challenges all require considering futures that seem implausible by today’s standards.
Effective scenarios must be relevant to decision-makers, challenging enough to stretch thinking, and plausible despite differing from conventional expectations. They become shared mental models that prepare organizations for various possibilities rather than optimizing for a single forecast.
5. Cross-Functional Collaboration Rituals
Foresight cannot be the exclusive domain of a centralized team. Leading organizations establish regular “strategic conversation” forums that bring together operations, R&D, marketing, finance, and external advisors to collectively make sense of signals and implications.
At Singapore’s government agencies, which assisted by Shell’s scenario team in the 1990s, cross-ministry foresight councils ensure that futures thinking shapes everything from education policy to infrastructure investment. This prevents siloed planning where each department optimizes for different assumed futures.
McKinsey’s Design x Foresight approach democratizes futures thinking by involving employees at all levels in scenario workshops and future concepting exercises. This builds organizational “futures literacy”—the capacity to use anticipation more effectively across all decisions, not just strategic ones.
These rituals must be structured yet creative, data-informed yet imaginatively open. The goal is collective intelligence that transcends individual mental models.
6. Technology-Enabled Early Warning Systems
Elite organizations leverage AI and machine learning to process signal volume that overwhelms human analysts. Sixty-five percent of foresight leaders deploy automated monitoring systems, compared to 23% of laggards.
BCG’s latest research on strategic foresight emphasizes blending powerful analytics with proven creative tools. Companies use natural language processing to scan millions of documents for emerging themes, anomaly detection algorithms to flag unexpected patterns, and network analysis to map how trends interconnect.
However, technology is enabler, not replacement. Humans still design what to monitor, interpret ambiguous signals, and make judgment calls about strategic implications. The most sophisticated systems create human-AI collaboration where machines provide breadth and speed while humans contribute contextual wisdom and ethical reasoning.
Companies deploying AI-powered foresight capabilities report 4.5 times greater likelihood of identifying significant opportunities early, according to survey data.
7. Leadership Commitment to “Looking Around Corners”
None of the above matters without genuine executive commitment. BCG survey findings reveal that while 71% of executives believe their companies manage strategic risks well, this confidence exceeds actual preparedness.
True commitment means:
- Allocating permanent budget for foresight work (not just consulting projects)
- Rewarding managers who surface uncomfortable futures (not just those who hit quarterly targets)
- Dedicating board meeting time to scenario discussion (not just financial review)
- Making strategic resource allocation decisions based on multiple futures (not just extrapolated forecasts)
When Andy Jassy leads Amazon strategy discussions, he reportedly begins with “what futures are we planning for?” rather than “what’s our forecast?” This subtle framing shift acknowledges uncertainty and invites adaptive thinking.
The Dual-Track Approach: Managing Knowns and Unknowns
The most sophisticated insight from the 500-company survey concerns how elite organizations structure their foresight work. They operate on two parallel tracks simultaneously: tracking predictable future events alongside genuine uncertainties.
Track One: Knowable Futures Some aspects of the future are essentially predetermined by current structure. Demographics, infrastructure replacement cycles, debt maturation schedules, regulatory implementation timelines, and geophysical trends all create knowable constraints and opportunities.
For example, we know with high confidence that by 2035, the working-age population in Japan will be smaller than today, that many European countries’ electrical grids will require massive upgrades, and that numerous corporate debt facilities will refinance at different rates. These aren’t predictions—they’re structural realities already set in motion.
Elite foresight organizations systematically catalog these knowable futures and identify strategic implications. What talent strategies does aging demographics require? Which infrastructure constraints will create bottlenecks? Where will refinancing pressures create acquisition opportunities?
Track Two: Genuine Uncertainties Simultaneously, leaders track true unknowns—factors that could evolve in fundamentally different directions. Will artificial intelligence development follow incremental improvement or breakthrough discontinuity? Will deglobalization accelerate or reverse? Will climate adaptation strategies prove more important than mitigation?
For these uncertainties, scenario planning creates alternative narratives. Rather than trying to predict which scenario will unfold, organizations prepare capabilities to succeed across multiple possibilities.
The power of this dual-track approach is avoiding both the trap of false precision (pretending uncertainty is predictable) and the trap of paralysis (claiming nothing is knowable). Both tracks inform strategy, but differently. Knowable futures drive commitments; uncertainties drive optionality.
Framework Visualization:
Imagine a matrix with two axes:
Vertical Axis (Predictability): HIGH (Knowable Trends) → LOW (True Uncertainties)
Horizontal Axis (Time Horizon): SHORT (1-2 years) → MEDIUM (3-5 years) → LONG (10+ years)
Elite companies populate all quadrants with specific items:
- High Predictability / Short Term: Regulatory implementation schedules, major infrastructure projects
- High Predictability / Long Term: Demographic shifts, climate trajectory, debt cycles
- Low Predictability / Short Term: Geopolitical events, technology breakthroughs, market disruptions
- Low Predictability / Long Term: AI capabilities, energy systems, geopolitical order
Technology Stack for Strategic Foresight in 2025
Modern foresight capabilities rely on integrated technology platforms. Here’s what leaders deploy:
Signal Detection and Aggregation: Companies use platforms like Contify, Recorded Future, and Strategyzer to aggregate signals from news, academic publications, patents, regulations, and social media. These tools employ machine learning to identify emerging patterns before they reach mainstream awareness.
Scenario Development and Testing: Software like Scenario360 and Ventana Systems enables teams to model complex scenarios with interdependent variables. Organizations can test how strategies perform under different future conditions before committing resources.
Competitive Intelligence: Platforms including CB Insights, PitchBook, and Owler track competitor moves, startup funding patterns, and market positioning shifts—providing early indicators of strategic direction changes.
Weak Signals Monitoring: Tools like Meltwater and Talkwalker detect sentiment shifts and nascent trends in unstructured data. They flag when fringe topics begin gaining traction, providing months of advance warning.
Collaborative Foresight: Software like Miro, MURAL, and IdeaScale facilitates distributed scenario workshops and futures conversations, essential as work becomes more remote and global.
The technology investment for mid-sized companies ranges from $100,000 to $500,000 annually, generating returns through earlier opportunity identification and risk avoidance worth millions.
ROI of Strategic Foresight: The Business Case
CFOs reasonably ask: what’s the financial return on foresight investment? The BCG survey provides quantifiable answers.
Companies with advanced foresight capabilities report:
- 33% higher profitability compared to peers with basic capabilities
- 200% greater revenue growth over five-year periods
- Meaningful valuation premiums averaging 15-20% in comparable sector analyses
The mechanisms driving these returns:
Risk Mitigation Value: Early warning of threats enables proactive response rather than crisis management. When companies detect regulatory shifts 18-24 months before implementation rather than 6 months, they can influence outcomes and optimize compliance costs. The value here is avoiding losses.
Opportunity Capture: Foresight leaders enter new markets, acquire capabilities, and launch innovations 12-18 months before competitors recognize opportunities. First-mover advantages in emerging spaces create sustained profitability.
Strategic Efficiency: Organizations that align on clear scenarios waste less energy debating which future to plan for. Strategy execution accelerates when leadership teams share mental models of plausible futures.
Resilience Premium: Companies demonstrating systematic foresight capabilities trade at valuation premiums because investors recognize preparedness for uncertainty. This matters especially during volatility when resilient companies outperform.
One BCG client in automotive manufacturing used foresight to identify supply chain vulnerabilities 18 months before the semiconductor shortage. They secured alternative suppliers and redesigned products to reduce chip dependency, maintaining production when competitors idled plants. The revenue protection exceeded $400 million.
Implementation Roadmap: Getting Started
Most organizations don’t need to immediately build Shell-level scenario capabilities. Here’s a practical 90-day path from basic to intermediate foresight maturity:
Days 1-30: Establish Foundation
- Designate a foresight champion (existing strategy team member is fine initially)
- Conduct stakeholder interviews: What future uncertainties keep executives awake?
- Create initial scanning architecture: Identify 10-15 sources across PESTLE domains (political, economic, social, technological, legal, ecological) to monitor systematically
- Set up simple tracking system (shared spreadsheet suffices at first)
Days 31-60: First Scenario Exercise
- Facilitate 2-day workshop with cross-functional leadership team
- Identify 2-3 critical uncertainties most relevant to your organization’s future
- Develop 3-4 distinct scenarios (avoid “good/bad/likely” trap)
- For each scenario, answer: What would success look like? What early indicators would signal this future emerging?
Days 61-90: Integration and Rhythms
- Present scenarios to board; incorporate into strategic planning cycle
- Establish monthly “futures pulse” meeting where team reviews signals and updates scenario likelihood
- Identify 2-3 strategic options that perform well across multiple scenarios (these become prioritized initiatives)
- Commit budget and resources for continued foresight capability building
Common Pitfalls to Avoid:
Don’t outsource completely. External consultants can facilitate initial capability building, but foresight must become internal competency. Organizations that treat it as occasional consulting projects never develop the muscle memory.
Don’t create another strategic planning layer. Foresight should enhance and inform strategy, not become parallel bureaucracy.
Don’t expect perfect predictions. Scenarios that “come true” exactly as described means you weren’t stretching thinking enough. The goal is preparedness for surprises, not prophecy.
Don’t keep it top-secret. Broader organizational awareness of scenarios creates shared context that enables faster, more aligned responses when futures begin unfolding.
Success Metrics to Track:
- Number of weak signals identified before competitors
- Strategic initiatives stress-tested against multiple scenarios
- Leadership team alignment on plausible futures (measure through surveys)
- Reduced response time when market conditions shift
- Resource allocation flexibility (ability to pivot without sunk cost paralysis)
The Foresight Dividend
In January 2025, when CEO surveys showed unprecedented uncertainty, companies with mature foresight capabilities faced the same volatile environment as everyone else. The difference? They had already pressure-tested strategies against scenarios including geopolitical fragmentation, AI acceleration, climate tipping points, and financial system stress.
Q: How do companies predict future trends?
A: Leading companies don’t predict—they prepare for multiple plausible futures simultaneously. They use systematic horizon scanning across short and long-term timeframes, develop 4-5 distinct scenarios including wildcards, deploy AI-powered signal detection systems, and establish cross-functional foresight teams with strategic influence. This dual-track approach monitors both predictable future events (demographics, infrastructure cycles) and genuine uncertainties (technology breakthroughs, geopolitical shifts), enabling proactive adaptation rather than reactive crisis management.
They weren’t paralyzed by uncertainty—they were prepared for it. Some scenarios they’d developed years earlier were unfolding. Others proved wrong. But the organizational capacity to think in multiple futures, stress-test assumptions, and maintain strategic flexibility had become embedded culture.
Strategic foresight isn’t fortune-telling. It’s structured preparation for a range of plausible futures, systematic monitoring for early signals of which futures are emerging, and organizational agility to adapt as reality unfolds. In an era where global uncertainty measures have doubled in 30 years, this capability separates winners from casualties.
The seven percent of companies operating at elite foresight maturity aren’t smarter or luckier than others. They’re simply more systematic about the future. And systematization is learnable, replicable, and surprisingly affordable relative to returns generated.
The question isn’t whether your organization needs strategic foresight—uncertainty has already answered that. The question is whether you’ll build the capability deliberately or learn its importance through painful surprise.
The companies profiled in the 500-organization survey made their choice. The performance gap between leaders and laggards will only widen as volatility accelerates. Which side of that divide will your organization occupy in 2030?
Key Takeaway: Strategic foresight delivers quantifiable competitive advantage through systematic practices that track both predictable futures and genuine uncertainties across multiple time horizons. The capability is accessible to organizations of any size willing to build it as embedded competency rather than episodic exercise. In an era of rising uncertainty, it’s no longer optional—it’s survival insurance and growth catalyst combined.
Sources Cited:
- Harvard Business Review: BCG Strategic Foresight Survey
- McKinsey: Strategy Champions Analysis
- Boston Consulting Group: Navigating the Future
- European Commission: Strategic Foresight 2025
- Atlantic Council: Global Foresight 2025
- OECD: Strategic Foresight Toolkit
- World Economic Forum: Strategic Foresight Importance
- Shell Global: Scenarios Practice
- McKinsey: Design x Foresight Approach
- BCG: Strategic Risk Preparedness
Discover more from The Economy
Subscribe to get the latest posts sent to your email.



A fully loaded semi-truck can weigh 20 times more than the sedan it hits — and that single fact, more than any other, is why truck collision claims settle for dramatically more than ordinary car accident claims.
In 2024, large trucks were involved in 168,118 crashes nationwide, resulting in 74,314 injuries and 4,868 fatalities, according to Federal Motor Carrier Safety Administration data. Seventy percent of the people killed in large-truck crashes were occupants of the other vehicle — not the truck driver — which is the core reason truck collision litigation looks so different from a standard auto accident claim.
This guide explains how truck collision liability actually works, what determines settlement value, and why hiring an attorney who specializes specifically in commercial trucking — not general auto accidents — materially changes the outcome.
Why Truck Collisions Are a Different Legal Category Entirely
A car accident claim usually involves one driver, one insurance policy, and a fairly contained set of facts. A truck collision claim can involve the driver, the trucking company, the vehicle owner (if leased), a cargo loading company, a maintenance contractor, and even the truck or parts manufacturer — each potentially carrying separate insurance and separate liability exposure.
Key takeaway: Federal law requires interstate trucking companies to carry liability insurance ranging from $750,000 to $5 million depending on cargo type — far above the $25,000–$100,000 minimums typical for passenger vehicles. That’s precisely why truck collision settlements can be dramatically larger: there is simply more coverage available to draw from.
Who Can Be Held Liable in a Truck Collision
- The truck driver — for direct negligence such as speeding, fatigue, distraction, or failure to follow safety regulations.
- The trucking company — under vicarious liability (respondeat superior) for its employee-driver’s actions, and directly for negligent hiring, training, or dispatch practices.
- The vehicle/trailer owner — if the tractor or trailer was leased or owned separately from the operating carrier.
- A cargo loading or logistics company — where improper loading caused a rollover, jackknife, or load-shift event.
- A maintenance contractor — where mechanical failure (brakes, tires, steering) traces back to inadequate servicing.
- A parts or vehicle manufacturer — in cases involving defective components under product liability law.
Step-by-Step: Building a Truck Collision Claim
- Preserve the evidence immediately. Trucking companies are only required to retain electronic logging device (ELD) and dashcam data for a limited period; a specialized attorney sends a spoliation letter within days to legally compel preservation.
- Pull the driver’s qualification and safety file. This includes hours-of-service logs, drug and alcohol testing records, and prior FMCSA violations.
- Identify every layer of insurance. Commercial policies are frequently “stacked” across the motor carrier, the owner-operator, and an umbrella policy.
- Document medical damages comprehensively. Because truck collisions frequently cause catastrophic injury, future medical needs and lost earning capacity — not just current bills — drive claim value.
- Negotiate or litigate. Most claims resolve through settlement, though litigation may be necessary where a carrier disputes liability or the claim exceeds available coverage.
Financial and Strategic Implications: What Determines Settlement Value
Settlement figures for truck collisions vary enormously depending on injury severity, liability clarity, and available insurance. Federal regulations set minimum financial responsibility levels that put a practical ceiling — and, in serious cases, a starting point — on negotiations.
| Injury Category | Typical Settlement Range | Primary Cost Drivers |
|---|---|---|
| Minor injuries (soft tissue, whiplash) | Tens of thousands of dollars | Short-term medical treatment, minor lost wages |
| Moderate injuries (fractures, herniated discs) | Roughly $100,000–$500,000 | Surgery, extended recovery, moderate lost wages |
| Severe injuries (traumatic brain injury, spinal damage, amputation) | Roughly $500,000–$2 million+ | Long-term care, permanent disability, diminished earning capacity |
| Catastrophic injury or wrongful death | Seven figures and up, occasionally into the tens of millions in extreme cases | Lifetime care costs, loss of financial support, punitive damages where gross negligence is shown |
Expert insight: Insurance adjusters and defense counsel almost always cite “average” settlement figures pulled from a broad mix of minor and catastrophic cases. A specialized truck collision attorney evaluates your case against comparable injury-matched outcomes and available policy limits — not a blended national average — which is where most of the negotiating leverage actually comes from.
Why Truck Cases Move Slower Than Car Accident Claims
Because multiple defendants and layered insurance policies are frequently involved, truck collision claims typically take longer to resolve than a standard fender-bender — often 12 to 18 months for cases that proceed toward litigation, compared to a few months for straightforward auto claims. Firms that specialize in trucking litigation build in early investigation specifically to compress this timeline where possible.
Contingency Fees Remain Standard
As with most personal injury litigation, truck collision attorneys typically work on a contingency-fee basis, commonly in the 25%–40% range, meaning the client owes nothing upfront and the fee is paid only from a successful recovery.
How to Choose the Right Truck Collision Attorney
- Trucking-specific case experience — ask directly how many commercial trucking cases (not general auto claims) the firm has handled and resolved.
- In-house accident reconstruction resources — the ability to independently analyze ELD data, black-box (event data recorder) output, and skid patterns is critical in disputed-liability cases.
- Knowledge of Federal Motor Carrier Safety Regulations (FMCSRs) — hours-of-service rules, driver qualification standards, and inspection requirements are frequently the basis for proving negligence.
- Willingness to litigate, not just settle — carriers and their insurers negotiate harder when they know a firm is prepared to take a case to trial.
- Free initial consultation and contingency terms in writing — standard industry practice; confirm both before signing.
Key takeaway:The fastest-moving evidence in a truck collision case — ELD data, dashcam footage, and hours-of-service logs — can be erased or overwritten within days if not formally preserved. Speed in hiring counsel is often the single biggest factor in how strong the eventual claim turns out to be.
Future Outlook: Truck Collision Litigation Trends Heading Into 2027
- Crash volumes remain elevated relative to a decade ago. Large trucks involved in fatal crashes are up roughly 30% over the last 10 years, according to National Safety Council analysis of federal data, even as year-over-year totals have edged down slightly since 2023.
- Nuclear verdicts continue to reshape carrier risk. A small but growing number of catastrophic-injury trucking verdicts have reached eight and nine figures in recent years, prompting carriers and insurers to settle high-exposure claims earlier rather than risk a jury outcome.
- Electronic logging and telematics data are central to litigation strategy. As more fleets adopt advanced telematics, plaintiff attorneys increasingly rely on granular driving-behavior data — hard-braking events, speed logs, route deviations — to establish negligence beyond the police report.
- Regulatory scrutiny of driver qualification is intensifying. Continued FMCSA enforcement emphasis on hours-of-service compliance and driver drug/alcohol testing means violation histories are becoming an even more central piece of liability evidence.
Frequently Asked Questions
Who is liable when a truck driver causes a collision?
Liability commonly extends beyond the driver to the trucking company under vicarious liability, and potentially to a cargo loader, maintenance contractor, or parts manufacturer depending on the cause of the crash.
How much insurance do trucking companies carry?
Federal law requires interstate motor carriers to carry liability coverage ranging from $750,000 to $5 million depending on cargo type, substantially more than typical passenger-vehicle minimums.
How long does a truck collision claim take to settle?
Straightforward claims can resolve in a few months, but cases involving disputed liability, multiple defendants, or catastrophic injury commonly take 12–18 months or longer to reach resolution.
Do I need a lawyer who specializes in trucking cases specifically?
It’s strongly advisable. Truck collision cases involve federal safety regulations, electronic logging data, and layered commercial insurance that general auto-accident attorneys typically have limited experience navigating.
What percentage does a truck accident attorney take?
Most work on contingency, typically in the 25%–40% range of the final settlement or verdict, with no upfront legal fees.
Discover more from The Economy
Subscribe to get the latest posts sent to your email.
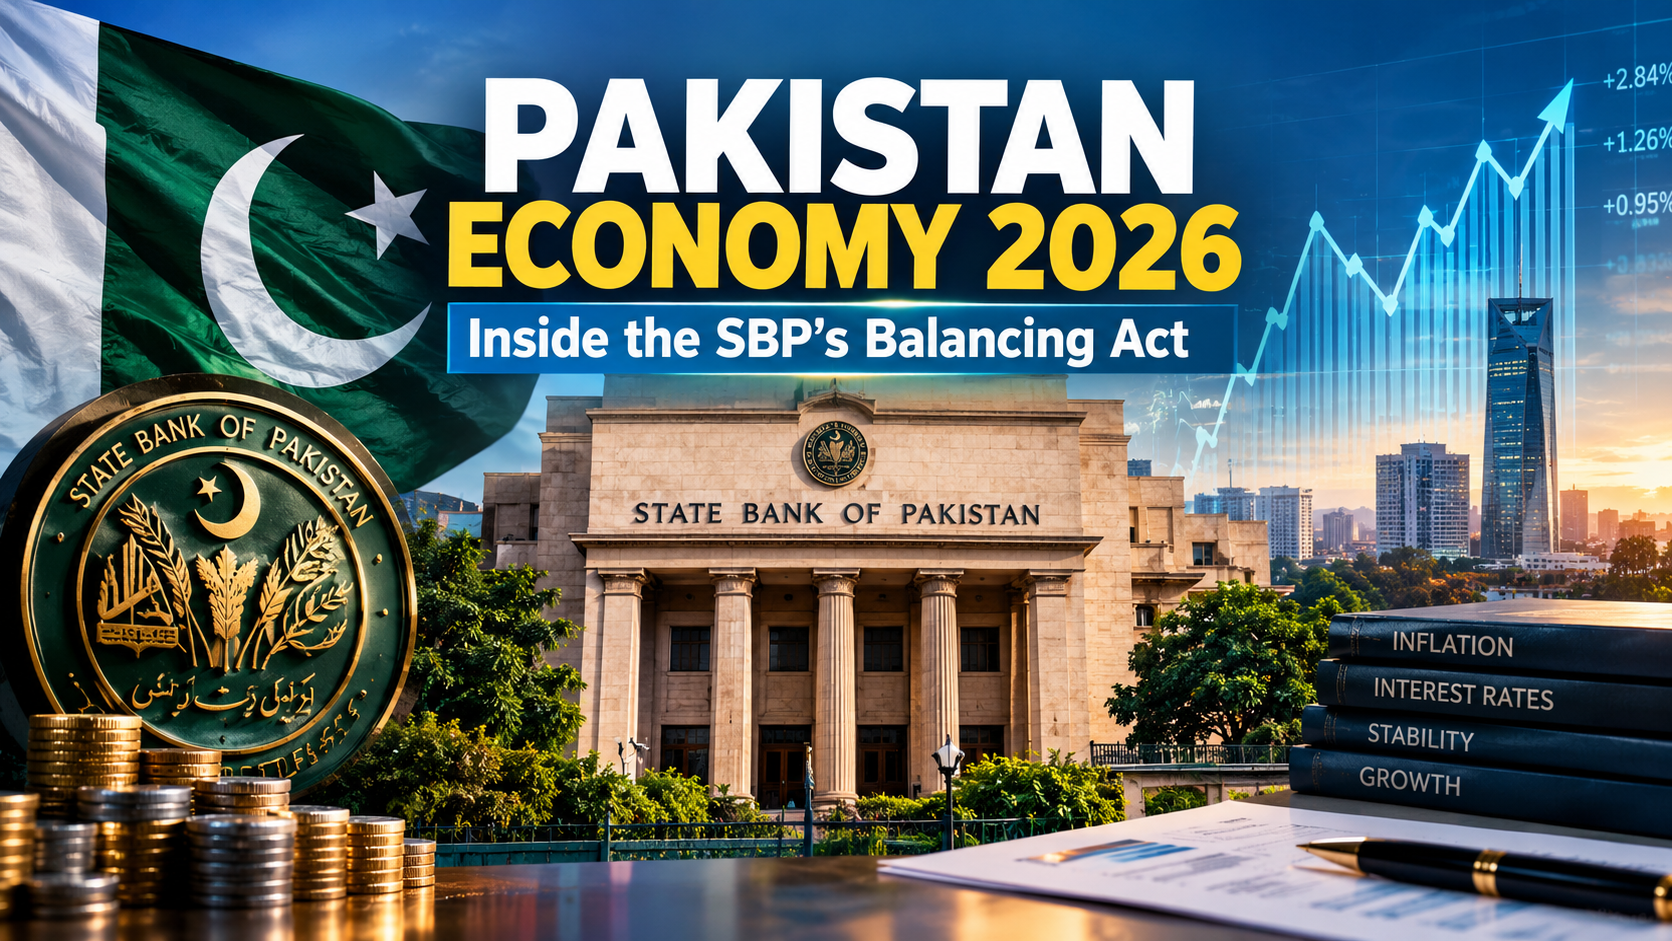
What is Pakistan’s central bank policy rate in 2026? The State Bank of Pakistan (SBP) held its policy rate unchanged at 11.5% at its September 14, 2026 meeting, according to the central bank’s official statement, even as headline inflation jumped to 11.1% year-on-year in August from 9.2% in July. The Monetary Policy Committee specifically cited the “recent intensification of the prolonged Middle East conflict” as having pushed already-elevated global commodity prices even higher, compounding persistent supply chain disruptions — a clear signal that Pakistan’s domestic inflation fight in 2026 has become inseparable from the global oil-price volatility tied to the Strait of Hormuz crisis.
That single decision captures the core tension defining Pakistan’s economy this year: a genuine, hard-won macroeconomic stabilization story running headlong into external shocks the country has no control over.
The Long Road From 22% to 11.5%
Featured Snippet Target: The State Bank of Pakistan has cut its policy rate by roughly 1,100 basis points since June 2024, when rates peaked at 22% amid inflation nearing 40% — one of the most aggressive monetary easing campaigns among emerging-market central banks in recent history — before pausing the cutting cycle in 2025 and holding steady through 2026 amid renewed inflation risk from Middle East-driven commodity price increases.
That easing campaign reflected a genuine turnaround in Pakistan’s inflation trajectory: from a peak above 38% in May 2023, inflation had fallen to single digits by late 2024, allowing the central bank room for aggressive cuts. But the pace of easing slowed and eventually paused as new pressures emerged — first flood-related agricultural disruptions in late 2025, and then, more significantly, the economic fallout from the Iran conflict that erupted in February 2026.
The Pause, Meeting by Meeting
The SBP’s rate path through 2026 has been a study in caution rather than continued easing. The central bank held rates steady at 11% in October 2025 for a fourth consecutive meeting, citing modest economic growth alongside external-sector vulnerabilities and inflation risks, with foreign exchange reserves projected to reach $15.5 billion by December 2025 and around $17.8 billion by June 2026, according to reporting from Arab News. By April 2026, with Middle East tensions escalating and oil prices surging, the SBP raised its rate by 100 basis points to 11.50%, according to ARY News — reversing its prior easing bias entirely in direct response to the geopolitical shock. The rate has been held steady at that level through subsequent meetings in June, July, and September.
The Good News Buried in the September Statement
Despite the inflation jump, the SBP’s September policy statement contained several genuinely positive developments that complicate any purely negative reading of Pakistan’s 2026 economic trajectory. The central bank’s foreign exchange reserves surpassed the end-June 2026 target of $18 billion, driven by continued FX purchases amid a small current account deficit for the fiscal year and the realization of planned official inflows. Separately, Standard & Poor’s upgraded Pakistan’s sovereign credit rating to “B” during the year — a meaningful signal of improving international investor confidence in the country’s debt sustainability. Inflation expectations among both consumers and businesses had also eased in the latest sentiment surveys, according to the SBP’s own reporting, suggesting the current inflation spike is being read by markets as externally-driven rather than a sign of a fundamental loss of policy credibility.
Growth, Floods, and a Still-Live IMF Program
Pakistan’s real GDP growth for the fiscal year was revised upward into the upper half of a previously projected 3.25%-4.25% range as of late 2025, underpinned by robust performance in agriculture and industry alongside rising domestic demand, according to Trading Economics coverage of the central bank’s own projections. That growth trajectory has had to absorb genuine shocks: flood-related crop losses drove a temporary inflation spike to 5.6% in September 2025, and border closures with Afghanistan disrupted staple food supplies including tomatoes and apples. Pakistan’s stabilization program remains anchored by its ongoing International Monetary Fund arrangement, with fiscal consolidation and the realization of planned external inflows continuing to be treated by the SBP as prerequisites for durable macroeconomic stability, consistent with the terms of the country’s 37-month, roughly $7 billion IMF Extended Fund Facility.
The Real Asset Allocation Shift Feeding Pakistan’s Stock Rally
Pakistan’s improving macro picture — falling rates through 2024-2025, easing inflation, and rising foreign reserves — has had a direct and visible knock-on effect on domestic markets: a structural shift of household savings out of fixed-income instruments and into equities, as falling returns on traditional savings vehicles pushed investors toward the stock market, according to brokerage house Topline Securities’ analysis reported by Aaj News. That reallocation has been the primary fuel behind the KSE-100’s historic rally through 2026, even as the index has periodically corrected sharply on single-session sentiment shifts.
The Bottom Line
Pakistan’s 2026 economic story is genuinely two-sided: a real, credible stabilization achieved through 1,100 basis points of rate cuts, improving foreign reserves, a credit rating upgrade, and a domestic savings shift that has fueled one of the world’s best-performing stock markets — all now being tested by an externally-driven inflation shock tied to Middle East oil-price volatility that is entirely outside the State Bank’s control. The SBP’s response so far — holding rates steady rather than resuming cuts or panicking into further hikes — suggests the central bank is treating the current inflation spike as a temporary, externally-driven disruption rather than a sign that its underlying stabilization program has failed.
Next step: Businesses and investors tracking Pakistan’s economy should watch the SBP’s October 26, 2026 Monetary Policy Committee meeting closely — a continued hold would reinforce the “temporary external shock” reading, while any additional rate hike would signal the central bank sees the Middle East-driven inflation pressure as more durable than currently assessed.
Discover more from The Economy
Subscribe to get the latest posts sent to your email.
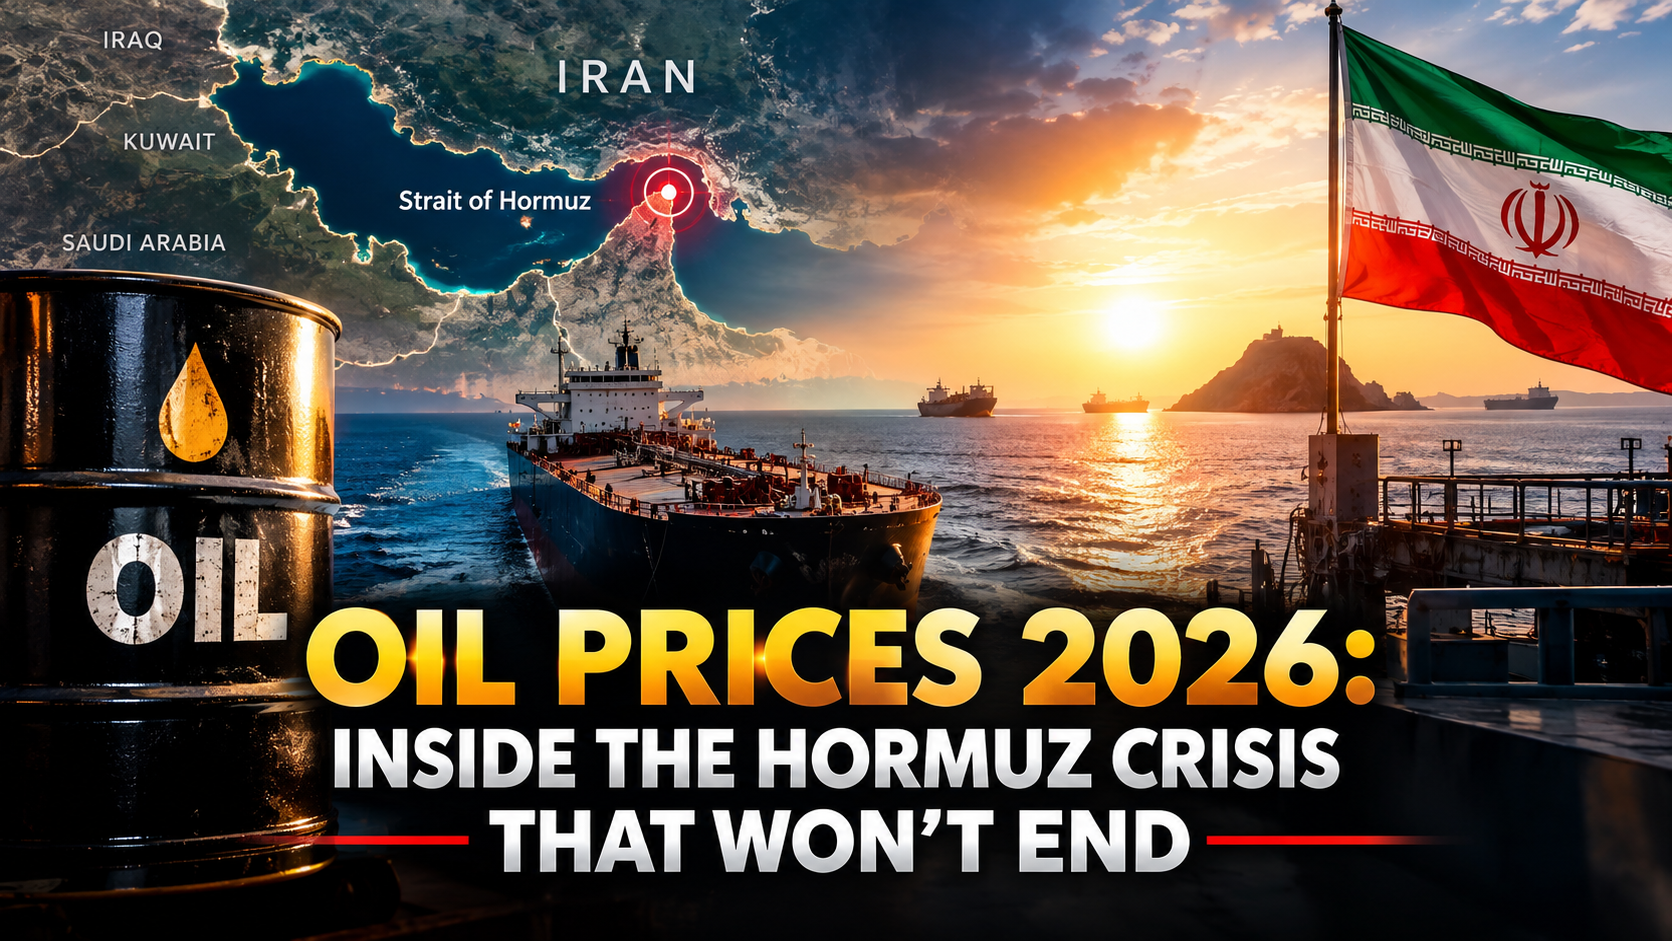
Why are oil prices so volatile in 2026? Nearly every major oil-price swing in 2026 traces back to a single chokepoint: the Strait of Hormuz, through which roughly a fifth of the world’s oil and liquefied natural gas flows, according to Reuters reporting carried by the Express Tribune. Since war broke out between the U.S., Israel, and Iran at the end of February 2026, the strait’s status — open, restricted, or effectively closed — has driven Brent crude through some of the widest swings the market has seen in years.
The Timeline: From $63 to $126 and Back
Featured Snippet Target: Brent crude averaged around $63.85 per barrel in a February 2026 analyst survey conducted just before war broke out; by March, after Iran effectively restricted Hormuz traffic, the same survey’s forecast jumped to $82.85 — a 30% increase representing the steepest one-month forecast revision in the Reuters oil poll’s history since 2005 — with prices briefly touching levels near $126 for Brent and nearly $120 for WTI at the conflict’s most acute phase.
That initial shock was followed by a genuine de-escalation. By late June, Brent fell to $73.76 a barrel — its lowest level since before the Iran war began — after reports emerged that tankers were again passing through Hormuz following a ceasefire, according to Energynomics. J.P. Morgan analysts cut their Brent forecast for the second half of 2026 to an average of $86 in the third quarter and $80 in the fourth, while a broader Reuters poll of 31 economists lowered its full-year 2026 Brent forecast to $84.50 per barrel, down from $90.44 the prior month — the first downward revision analysts had made since the conflict began, driven by the normalization of Hormuz shipping traffic.
Why the Calm Didn’t Last
That de-escalation proved temporary. By early August, oil prices were rising again on renewed concerns over Hormuz’s reopening plans, as Iran — working alongside Oman — proposed banning vessels deemed “hostile” from the strait while imposing heavy fines on rule violators, pushing Brent back up to $83.29 a barrel, according to Reuters coverage. By mid-September, tensions had escalated further still: Brent settled at $104.61 and WTI at $100.05 on September 12, having touched multi-month highs near $107-$109 earlier in the week, driven by renewed maritime security concerns spanning both the Strait of Hormuz and the Red Sea, according to PSU Connect.
That September spike also coincided with tight refining margins pushing derivative products like US diesel to historic highs — a sign that the oil-market stress has been feeding through into downstream fuel costs even during periods when crude itself wasn’t setting fresh records.
The Scenario Analysis That Kept Shifting
Throughout the year, major banks published scenario-based forecasts that essentially functioned as a real-time gauge of how seriously markets were taking the risk of a prolonged Hormuz closure. Goldman Sachs, in an April note, laid out an “adverse view” in which Brent would average above $100 a barrel through the second half of 2026 if the strait remained closed for another month, with a more extreme scenario — involving a longer closure and lost regional production — pushing Brent to $120 in the third quarter and $115 in the fourth, according to Fortune. Barclays similarly raised its 2026 Brent forecast to $100 from $85 in early May, estimating the oil market was running a supply deficit of around 6.6 million barrels per day at the time, a gap the bank warned was likely to widen the longer disruptions continued, according to Kitco.
The Knock-On Effects Across the Global Economy
Oil’s 2026 volatility hasn’t stayed contained to energy markets. Elevated and unpredictable crude prices have been cited repeatedly as a contributing factor behind mortgage-rate stickiness in the U.S. (via broader inflation pressure), the Federal Reserve’s more hawkish policy stance under new Chair Kevin Warsh, and Pakistan’s central bank holding its policy rate steady at 11.5% in September specifically because of “further increase in already elevated global commodity prices” tied to the conflict, according to the State Bank of Pakistan’s official September monetary policy statement. Fitch Ratings has separately pointed to Iran-conflict-driven oil prices as a factor pressuring global mortgage rates and building costs across its 2026 Global Housing and Mortgage Outlook.
The Bottom Line
Oil in 2026 has behaved less like a market responding to steady supply-and-demand fundamentals and more like a real-time barometer of Strait of Hormuz risk — surging past $126 at the conflict’s peak, falling to pre-war lows near $74 during the June ceasefire, and climbing back above $100 by September as tensions resurfaced. Every major bank forecast published during the year has effectively been a bet on how long Hormuz disruptions would last, and each time the strait’s status has changed, those forecasts have needed revising within weeks rather than months.
Next step: Anyone tracking oil-price exposure — whether for investment, business cost planning, or simply understanding inflation’s trajectory — should treat Strait of Hormuz shipping-traffic reports, not headline crude prices alone, as the leading indicator: traffic data has consistently moved days ahead of the price swings themselves throughout 2026.
Discover more from The Economy
Subscribe to get the latest posts sent to your email.

Truck Collision Attorney: What Your Case Is Really Worth After a Semi-Truck Crash

Beyond Petrochemicals: How Indonesia’s Chandra Asri is Constructing an Integrated ASEAN Mobility Powerhouse

Pakistan Moves From Stabilization to Recovery as IMF Review Puts Reform Momentum in Focus

Mesothelioma Attorney: How to Choose the Right Lawyer to Maximize Your 2026 Asbestos Settlement

SpaceX IPO 2026: History’s Biggest Stock Debut?

Pakistan Economy 2026: Inside the SBP’s Balancing Act

Is AI a Stock Bubble in 2026? What the Data Shows

Oil Prices 2026: Inside the Hormuz Crisis That Won’t End

Gold Price 2026: Inside the Wildest Rally in Decades

Federal Reserve 2026: Inside Kevin Warsh’s First Year

Fox Corp 2026: Record Revenue, Tubi Growth & Roku Deal

Wendy’s Stock 2026: Inside the Turnaround Plan

Technology News 2026: Inside the $1.3T AI Chip Boom

UK Stocks 2026: Inside the FTSE 100’s Record Run

Top 30 Stocks for Investment in PSX for Massive ROI in 2026

SpaceX Starship Flight 14: First Orbital Attempt & Starlink V3 Launch Explained

AI Chip Stocks 2026: The Best Semiconductor Investments Beyond Marvell

Oil Prices Break $100 in 2026: Middle East Conflict & Energy Markets

Fidelity Investments Review 2026: SPAXX Yields & Zero-Fee Funds

Tween Back-to-School Trends 2026: What’s Driving the $85B Season

The 2026 Crypto Regulatory Shift: What It Means for Institutional Investors

BRICS+ Cross-Border Payments 2026: Interoperability Explained

10-Year Treasury Yield Hits 4.80%: What It Means for Rates & Portfolios

Shein Clothes Quality & Safety in 2026: What Lab Tests Show

China’s US$10.8 Billion Trade Shortcut: Why the Pinglu Canal Matters

MRVL Earnings 2026: Why Marvell Sank Despite Beating Estimates

Leveraging Viral AI & Climate Hashtags for Brand Growth on X

IMF & World Bank 2026 Global Economic Outlook: Growth, Inflation, Debt
-

 Markets & Finance9 months ago
Top 15 Stocks for Investment in 2026 in PSX: Your Complete Guide to Pakistan’s Best Investment Opportunities
-

 Analysis7 months ago
Johor’s Investment Boom: The Hidden Costs Behind Malaysia’s Most Ambitious Economic Surge
-

 Analysis7 months ago
Top 10 Stocks for Investment in PSX for Quick Returns in 2026
-

 Banks8 months ago
Best Investments in Pakistan 2026: Top 10 Low-Price Shares and Long-Term Picks for the PSX
-

 Analysis8 months ago
Brazil’s Rare Earth Race: US, EU, and China Compete for Critical Minerals as Tensions Rise
-

 Investment9 months ago
Top 10 Mutual Fund Managers in Pakistan for Investment in 2026: A Comprehensive Guide for Optimal Returns
-

 Global Economy9 months ago
15 Most Lucrative Sectors for Investment in Pakistan: A 2025 Data-Driven Analysis
-

 Global Economy9 months ago
Pakistan’s Export Goldmine: 10 Game-Changing Markets Where Pakistani Businesses Are Winning Big in 2025