
Markets & Finance
VIX Index Explained: How to Trade Wall Street’s Fear Gauge Today

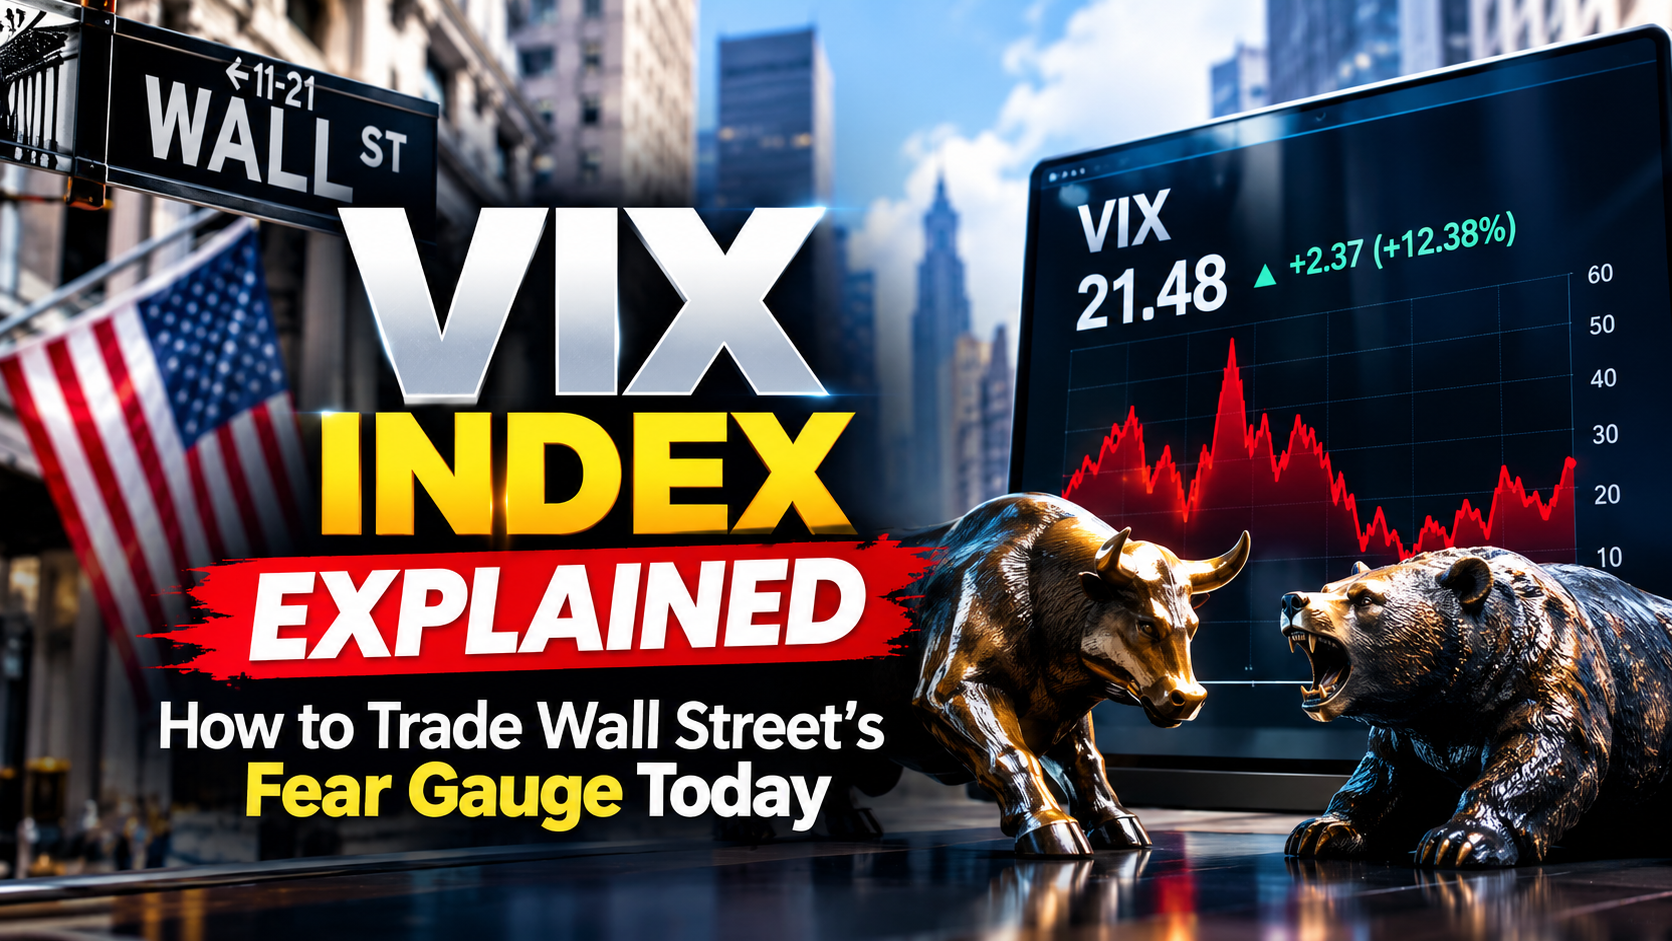
The VIX is the most quoted number in finance that almost nobody trades correctly.
It is not a price. It is not a direction. It is an annualised estimate of how much movement S&P 500 options traders are paying to protect against over the next 30 days — and that distinction is where most retail money is lost.
As of the close on 18 September 2026, the VIX stood at 14.81, down 4.1% on the session, after retreating from 17.71 two days earlier. Here is what that actually tells you.
Key Takeaways
- Current level: around 14.81, below the long-term midpoint and well off the 35.30 high of the past 52 weeks.
- What it measures: 30-day implied volatility of S&P 500 options — expected movement, not direction.
- Seasonality is real: the VIX median sits near 16.5 in late August and climbs toward 19 by early October.
- You cannot buy the index. Exposure comes via futures, options or ETPs, each with its own decay.
- Mean reversion is the defining property. Volatility trends back toward its long-run average, which is what shapes the futures curve.
What the VIX Actually Measures
The VIX is calculated by Cboe from a strip of near-term S&P 500 index option prices. Cboe’s own description emphasises the point most commentary misses: volatility is mean-reverting, and that property drives the shape of the VIX futures term structure.
A VIX of 15 implies annualised expected volatility of 15%. Divide by roughly 16 (the square root of 252 trading days) and you get an expected daily move of about 0.94% in the S&P 500.
That is the translation worth memorising. VIX 15 means “the options market expects roughly 1% daily swings.” VIX 30 means roughly 1.9%.
Why “Fear Gauge” Is a Misleading Nickname
The index says nothing about which way the market will move. Stocks can rally with elevated volatility and drift lower with subdued volatility. What changes when the VIX rises is the width of the expected outcome range, not its centre.
Reading the Current Level
| Reading | Interpretation | Typical Market Condition |
|---|---|---|
| Below 13 | Extreme complacency | Late-stage calm; hedges are cheap |
| 13–17 | Low / normal | Trending markets, orderly rotation |
| 17–25 | Elevated | Genuine two-sided uncertainty |
| 25–35 | High stress | Correction underway, correlations rise |
| Above 35 | Crisis | Forced deleveraging, liquidity gaps |
The VIX has eased substantially from the 21.51 reading in early June and the 20.66 high in late July, leaving equity-market risk perceptions relatively low despite unresolved questions on inflation, growth and Federal Reserve policy. The MOVE index, which tracks Treasury volatility, closed the same session at 80.64 — a reminder that bond markets are pricing more uncertainty than equity markets are.
That divergence is the single most interesting signal in the current tape.
The Seasonal Pattern Traders Actually Use
Volatility has a calendar. The VIX median since 1990 sits around 16.5 in late August, rises toward 18 by mid-September, and reaches roughly 19 in early October. September has historically been the weakest month for the S&P 500 since 1950, averaging a 0.6% decline.
Midterm election years sharpen the pattern. Stocks have often struggled from late summer into early autumn during midterm years before recovering into November — which makes 2026 a textbook setup for anyone building a seasonal hedge.
None of this is a trading system. It is a prior, and priors get overwhelmed by news.
How to Trade the VIX
You cannot buy the index itself. There are four practical routes, and they behave very differently.
1. VIX Futures
The purest expression. VIX futures provide a direct play on expected volatility, and expressing a long or short view means buying or selling contracts across the curve.
The catch is the term structure. In calm markets the curve is in contango — later-dated futures trade above spot — so a long position bleeds value as each contract rolls down toward settlement.
2. VIX Options
Options on the index allow defined-risk positioning. Long calls function as disaster insurance: cheap when nothing is happening, expensive exactly when you want them.
3. Volatility ETPs
Exchange-traded products track futures indices, not spot VIX. In persistent contango, they lose value structurally. They are tactical instruments measured in days, not buy-and-hold assets.
4. Direct S&P 500 Put Hedges
Often the cleanest approach. Instead of trading volatility as an asset, buy protection on the thing you actually own.
| Instrument | Best Use | Main Risk |
|---|---|---|
| VIX futures | Short-term directional volatility view | Roll cost in contango |
| VIX options | Defined-risk tail hedge | Premium decay |
| Volatility ETPs | Days-long tactical trades | Structural value erosion |
| S&P 500 puts | Portfolio insurance | Cost during calm markets |
The Volatility Risk Premium
One structural fact underpins most professional volatility strategies. Implied volatility from S&P 500 options tends to trade at a premium to the volatility the market subsequently realises.
Current data illustrates it precisely: with the VIX at 14.81, realised 30-day volatility was 9.49. Options buyers were paying for roughly 50% more movement than actually occurred.
That premium is why selling volatility is profitable most of the time — and catastrophic occasionally. Short-volatility strategies collect small, regular income and then surrender years of it in a single week. Size accordingly.
Practical Uses for Ordinary Investors
Most people should not trade the VIX at all. They should read it.
- As a hedging cost gauge. A VIX near 14 means downside protection is comparatively cheap. That is when to buy insurance, not after a crash.
- As a position-sizing input. Rising implied volatility mechanically increases the risk of any fixed-dollar position.
- As a contrarian sentiment check. Extreme readings in either direction have historically preceded reversals more often than continuations.
- As a reason to do nothing. Elevated volatility is when disciplined investors are rewarded for inaction.
What This Means for the Global Market in 2027
Coverage of the VIX rarely looks past today’s print. Four things matter more.
Bond volatility leads equity volatility. With the MOVE index elevated relative to a subdued VIX, any repricing of rate expectations is the most likely trigger for an equity volatility spike.
Policy transition risk is underpriced. Markets have warmed to the new Federal Reserve leadership, with the volatility index touching year-to-date lows in late August. Complacency around a policy regime change is historically expensive.
Geopolitics remains the fat tail. Volatility exploded on Middle East headlines earlier in 2026 before grinding back down. That mechanism has not gone away.
Concentration amplifies everything. With index returns driven by a narrow set of AI-linked names, single-stock disappointments now transmit to the whole index — meaning future volatility spikes may be sharper and shorter than historical averages imply.
Frequently Asked Questions
What is a normal VIX level?
A reading between roughly 13 and 20 is historically normal. The VIX closed at 14.81 on 18 September 2026, below its long-term midpoint.
Can you buy the VIX directly?
No. The VIX is a calculated index, not a tradable security. Exposure requires futures, options or exchange-traded products that track futures.
Why do VIX ETFs lose money over time?
They hold futures, not the spot index. When the futures curve is in contango, each roll sells a cheaper contract and buys a more expensive one, eroding value.
Does a high VIX mean stocks will fall?
No. The VIX measures expected size of movement, not direction. Markets can rise sharply while volatility is elevated.
Discover more from The Economy
Subscribe to get the latest posts sent to your email.


Markets & Finance
Presidential Stock Market Performance: How Trump’s Second Term Compares to History
Executive Summary: Since the November 5, 2024, presidential election, the U.S. stock market has navigated trade policy shifts, fluctuating tariff structures, and shifting interest rate expectations. Despite a sharp ~20% drawdown in early 2025, the S&P 500 generated a total return of 36.0% through September 2026, according to performance tracking from U.S. Bank Wealth Management.
While headline figures show strong market resilience, understanding how this performance ranks against modern predecessors—including Joe Biden, Barack Obama, Bill Clinton, and Ronald Reagan—requires examining underlying corporate earnings, market breadth, and Federal Reserve policy dynamics.
Historical Benchmark: S&P 500 Returns Across Modern Administrations
To accurately compare presidential stock market records, performance must be evaluated across full 4-year terms alongside cumulative mid-term benchmarks. Historical index data compiled by S&P Dow Jones Indices and analyzed by Schroders Investment Management shows that markets have historically trended upward regardless of party affiliation, averaging an annual total return of over 12% since 1946.
| Administration & Term | Period | S&P 500 Total Return (4-Year) | Cumulative 22-Mo. Benchmark | Primary Market Driver / Context |
|---|---|---|---|---|
| Ronald Reagan (Term 2) | 1985–1988 | +91.8% | +32.4% | Post-inflation recovery & 1980s tax restructuring |
| Bill Clinton (Term 1) | 1993–1996 | +88.6% | +21.2% | Early tech adoption & productivity boom |
| Bill Clinton (Term 2) | 1997–2000 | +88.6% | +48.1% | Dot-com expansion |
| Barack Obama (Term 1) | 2009–2012 | +85.1% | +41.5% | Post-Global Financial Crisis market rebound |
| Donald Trump (Term 1) | 2017–2020 | +81.3% | +24.8% | Tax Cuts and Jobs Act of 2017 & deregulation |
| Joe Biden | 2021–2024 | +66.3% | +18.4% | Post-pandemic stimulus & Tech/AI mega-cap surge |
| Barack Obama (Term 2) | 2013–2016 | +52.9% | +28.6% | Steady economic expansion & low interest rates |
| Donald Trump (Term 2) | 2025–2026 (In Progress) | N/A | +36.0% | Corporate earnings growth, domestic energy, & tech resilience |
Core Drivers of the 2025–2026 Equity Rally
1. Fundamental Earnings Growth Beat Expectations
Unlike market cycles driven purely by price-to-earnings (P/E) valuation expansion, the equity gains during 2025 and 2026 have been anchored in corporate earnings execution. S&P 500 second-quarter revenue grew over 16% year-over-year, while quarterly earnings surged 53%, more than doubling initial Wall Street forecasts. Third-quarter projections compiled by research teams at Bloomberg indicate sustained top-line revenue growth near 12% and earnings growth of 28%.
2. Market Rotation and Small-Cap Expansion
A notable divergence in Trump’s second term compared to earlier cycles is the broadening of market participation beyond mega-cap technology companies (“The Magnificent Seven”):
- Small-Cap Performance: The Russell 2000 and broader small-cap indices surged 60%+ from their April 2025 lows through September 2026.
- Sector Diversification: Financials, domestic industrials, and energy sectors saw accelerated inflows following regulatory easing and domestic energy development policies.
3. Institutional Volatility and Unprecedented Portfolio Activity
The market landscape in 2025 and 2026 has been marked by high policy-driven volatility. Disclosures analyzed by CBS News Financial Analysis and reporting from Reuters revealed unprecedented trading volume within executive investment accounts, executing thousands of transactions across defense, technology, real estate, and energy sectors during key legislative shifts.
Stay Ahead of the Markets
Subscribe to our free daily newsletter for institutional-grade analysis on how macroeconomic policies impact your portfolio.
Macro Economic Headwinds: Rates, Debt, and Inflation
While stock indices sit near historic highs, structural macroeconomic challenges remain. Here is a snapshot of the current macroeconomic realities:
- Elevated Federal Debt Costs: Data from the Federal Reserve Bank of St. Louis (FRED) highlights that the average interest rate on marketable U.S. Treasury debt climbed to 3.44%, compared to 1.42% in 2022. This elevation increases federal debt service obligations as maturing Treasury notes are refinanced at higher prevailing yields.
- Consumer Spending Shifts: Retail sales grew 5.0% year-over-year, though monthly momentum slowed. Wage growth at 3.2% provides ongoing income expansion but remains closely balanced against cumulative consumer price levels.
Analytical Summary: Wall Street vs. White House Context
Historical market analysis published by Morgan Stanley demonstrates that political leadership is only one of many variables driving long-term equity returns. Key takeaways for investors include:
- Policy vs. Fundamentals: Short-term market swings frequently respond to trade declarations, tariffs, and executive actions, but multi-year equity performance remains dictated by corporate earnings, cash flows, and monetary policy.
- Divided Government Advantages: Historically, markets under both Democratic and Republican presidents have posted above-average gains during periods of divided congressional control, which tends to limit radical fiscal shifts.
- Portfolio Discipline: Rebalancing asset allocations and maintaining broad sector diversification remains the primary protection against political and geopolitical market cycles.
What are your thoughts on the market’s response to recent trade policies? Share your perspective in the comments below, or check out our detailed breakdown of sector-by-sector performance in 2026.
Discover more from The Economy
Subscribe to get the latest posts sent to your email.
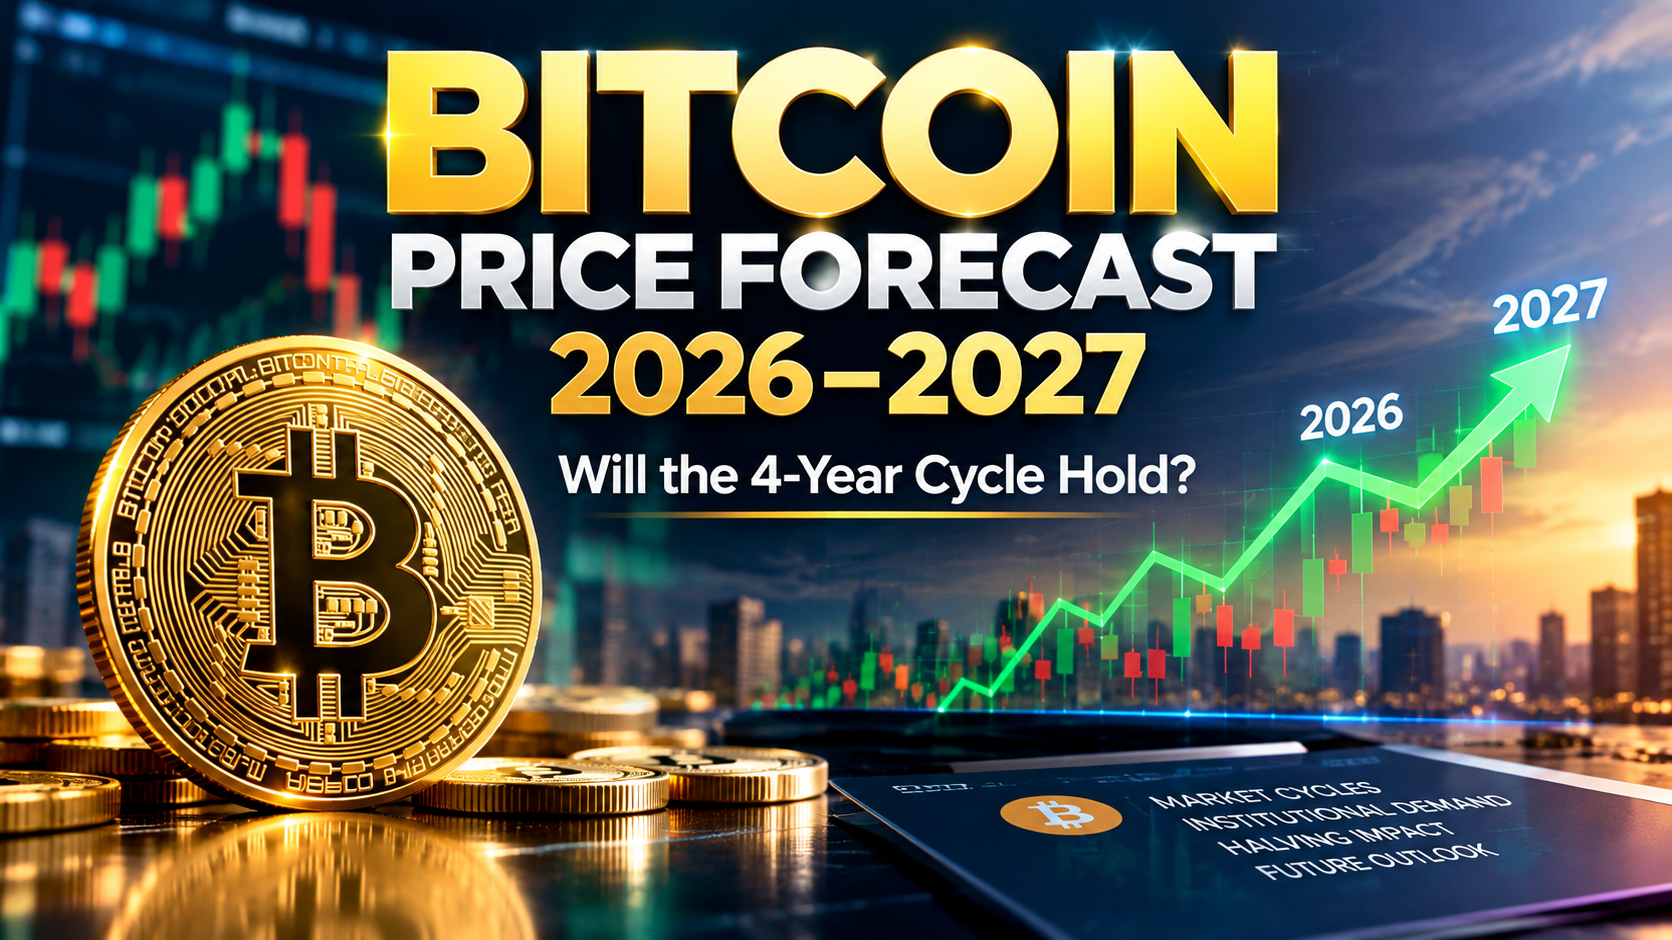
Bitcoin’s four-year cycle has been one of the most-watched patterns in crypto. It links price peaks and crashes to the supply event known as the halving.
So far, 2026 has looked a lot like the pattern. Here is where the price stands, what the cycle predicts and what analysts expect.
Key Takeaways
- Where we are: Bitcoin traded near $77,566 on September 16, 2026. CoinDCX
- The peak: Bitcoin peaked at $126,000 in October 2025 and had fallen roughly 50% by August. Mudrex
- Cycle theory: If history repeats, a bottom would land in late 2026.
- Analysts have cut targets: Major banks have lowered their 2026 forecasts.
- Key level: The 200-day moving average is the line technical traders are watching.
What Is the Bitcoin Four-Year Cycle?
Bitcoin’s supply issuance halves about every four years. Historically, price peaks followed each halving by roughly a year, then a deep drawdown followed.
Past cycles support this. The 2017 rally and the 2021 high both followed halvings. Each peak was followed by a long decline.
Bitcoin’s decline this cycle, about 54%, is milder than the 75% to 90% peak-to-trough crashes of 2014, 2018 and 2022. Some analysts read that as evidence of a maturing asset. CoinGecko
Bitcoin Price Today and Key Levels
| Level | Meaning |
|---|---|
| $126,000 | October 2025 all-time high |
| About $64,000 | Early August 2026 trading level |
| $73,077 | 200-day EMA, a key pivot |
| $80,000–$82,000 | Resistance zone traders watch |
The 50-day average recently crossed above the 200-day, a “golden cross” for the first time this year. Technical signals are mixed, and such patterns often fail. Treat them as one input, not a prediction. CoinDCX
One analysis says a sustained break below the 200-day EMA at $73,077 would invalidate the recent breakout. CoinDCX
Bitcoin Price Forecast for 2026: What Analysts Say
Forecasts have moved lower this year. Citi cut its target twice, from $143,000 to $82,000, and Standard Chartered cut from $150,000 to $100,000. Bernstein cut once, from $200,000 to $150,000. CoinGecko
If the four-year pattern holds, a market bottom could arrive between October and December 2026, with a possible range of $50,000 to $55,000. That range lines up with the 200-week moving average. Mudrex
Prices have already moved above that level, so the cycle bottom may have come earlier and higher than the pattern suggested. Nobody knows.
Prediction markets turned bearish in July, putting under 20% odds on $90,000 by year-end. Sentiment has improved since, but expectations remain cautious. CoinGecko
Bitcoin Price Forecast 2027
Long-range forecasts are speculative. Scenarios help frame the range.
| Scenario | Rough Outcome | What Would Need to Happen |
|---|---|---|
| Cycle holds | Slow recovery in 2027 | Bottom confirmed, gradual accumulation |
| Cycle breaks bullish | New highs sooner | Strong institutional inflows |
| Deeper bear | Retest of lower support | Macro shock or weak demand |
These are frameworks, not predictions. Anyone quoting a precise 2027 price is guessing.
What Could Break the Cycle
The cycle is a pattern, not a law. Four forces could change it.
- ETFs and institutions. Large regulated funds bring different buyers than earlier cycles.
- Interest rates. Central bank policy affects appetite for risk assets.
- Regulation. Clearer rules could attract capital, and tighter ones could deter it.
- Macro shocks. Energy prices and geopolitical events can hit all risk assets.
How Investors Can Approach the Market
- Use dollar-cost averaging. Spreading purchases reduces timing risk.
- Size positions carefully. Only invest money you can afford to see drop 50% or more.
- Know your holding route. Direct coins and spot ETFs carry different costs and risks.
- Watch the 200-day level and macro news.
- Keep records for taxes.
This article is general information, not financial advice.
What This Means for the Global Market in 2027
Most forecasts fixate on a single price. Here is what matters more.
Liquidity decides the next leg. Bitcoin has tracked global liquidity and risk appetite. Watch central bank policy.
Institutional adoption is the wild card. If ETFs and brokerages keep bringing in long-term holders, volatility may narrow.
The next halving is in 2028. Some analysts already anchor forecasts to it. The cycle may shift in timing if it continues at all.
Correlation with tech stocks. Bitcoin’s moves have followed large AI-linked stocks at times, so the two markets can turn together.
Frequently Asked Questions
What is the Bitcoin price prediction for 2026?
Forecasts vary widely, and major banks have cut their targets. Prices traded near $77,000 in mid-September.
Will Bitcoin hit a new high in 2027?
Nobody can say. If the four-year cycle holds, a new high is more likely later than in 2027.
Is the Bitcoin four-year cycle still valid?
It has matched 2026 so far, with a drop from an October 2025 peak. The decline has been milder than in past cycles.
When will Bitcoin bottom?
The cycle suggests late 2026, but bottoms are only clear in hindsight. Watch the 200-day and 200-week averages.
Discover more from The Economy
Subscribe to get the latest posts sent to your email.

Crypto used to mean opening an account at a separate exchange. Now major brokerages let you hold Bitcoin next to your stocks and retirement funds.
Fidelity is one of the most prominent examples. This guide compares its crypto offering with other ways to invest and shows who each fits.
Key Takeaways
- Fees: Fidelity advertises no commissions, but charges a 1% trading fee, with no account opening or custody fee. Koinly
- Two ways in: You can buy coins directly or hold spot crypto funds in a regular brokerage account.
- Best for: Long-term investors who want simplicity and a trusted brand.
- Not for: Active traders who want low fees and many coins.
- Separate account: Crypto trading requires a distinct crypto account.
How Fidelity Crypto Works
Fidelity offers direct crypto trading through a dedicated account. It requires opening a crypto account separate from your main brokerage account. Myfirstbroker
The coin list is small compared with dedicated exchanges. Users can hold Bitcoin, Ether, Litecoin and Solana. Check the current list in the app before you commit. Koinly
Spot Crypto Funds Inside a Brokerage Account
Fidelity also offers spot crypto exchange-traded products: FBTC for Bitcoin, FETH for Ether and FSOL for Solana. Koinly
These trade like stocks in a normal account. You pay each fund’s annual expense ratio instead of the trading fee. You do not hold the coins yourself.
Fidelity Crypto Fees Explained
The 1% fee is the most important number to understand.
Trades before December 4, 2025 showed no separate fee because the 1% was built into the price as a spread. Newer trades show the fee on the confirmation. Fidelity
On a $1,000 Bitcoin purchase, expect roughly $10 in fees. A round trip, buying and later selling, costs about 2%.
That is fine for a buy-and-hold investor. It adds up fast for frequent traders. BrokerChooser notes the fees are high and that better options exist. BrokerChooser
Fidelity Crypto vs. Other Options
The table compares the main routes to crypto exposure. Fee levels vary by provider, so verify current pricing.
| Feature | Fidelity Crypto | Spot Crypto ETF | Dedicated Exchange |
|---|---|---|---|
| Own the coins | Yes | No | Yes |
| Trading cost | 1% | Expense ratio | Often lower, tiered |
| Coin variety | Small | Limited | Very wide |
| Retirement accounts | Crypto IRA available | Standard IRAs | Usually limited |
| Advanced tools | Minimal | Standard stock tools | Extensive |
| Best for | Simplicity | Portfolio integration | Active trading |
Where Traditional Brokerages Win
Traditional brokerages offer one login, one tax document set and strong customer service. That convenience has value, especially for retirement investors.
Fidelity’s long track record also matters if you are cautious about where you keep assets. Its size and regulatory footprint are a real selling point.
Where Dedicated Exchanges Win
Exchanges offer hundreds of coins, lower fees for large traders and advanced order types. Power users chasing altcoin variety or low fees will likely outgrow Fidelity Crypto. Koinly
The trade-off is that exchange quality varies. Security, regulation and customer support can differ widely.
Which Route Fits Your Strategy?
Choose Fidelity Crypto if you want a small crypto allocation inside a trusted brokerage and plan to hold for years.
Choose a spot crypto ETF if you want exposure in a standard account, or in an IRA, without managing wallets.
Choose an exchange if you trade often, want many coins or need advanced tools.
A basic checklist helps:
- Decide how much of your portfolio you will allocate to crypto.
- Estimate how often you will trade.
- Compare the total cost, including fees and spreads.
- Confirm tax reporting support.
What This Means for the Global Market in 2027
Most comparisons stop at fees. Here is where the market is heading.
Fee compression. As more brokerages add crypto, competition should push trading costs down. A flat 1% fee may look expensive in a year.
Bundled wealth platforms. Expect stocks, funds and digital assets to be managed in one dashboard, with advisors recommending small crypto allocations.
Product growth. Spot ETPs for more assets may arrive. Investors should watch expense ratios and liquidity.
Regulation. Rules on custody, disclosure and taxation will shape which products brokerages can offer.
Volatility still applies. Bitcoin has fallen sharply from its 2025 high. A trusted brand does not reduce price risk.
Frequently Asked Questions
Does Fidelity charge fees on crypto trades?
Yes. Fidelity charges a 1% fee on crypto buys and sells. There is no account opening or custody fee.
Can you buy Bitcoin at Fidelity?
Yes. You can buy Bitcoin directly in a Fidelity Crypto account or through the FBTC fund in a standard brokerage account.
Is Fidelity Crypto good for beginners?
It suits beginners who want a simple, low-drama way to hold a small amount of crypto. Frequent traders will find the 1% fee costly.
Fidelity Crypto or a crypto exchange?
Fidelity fits long-term investors who value brand trust and integration. Exchanges suit active traders who want more coins and lower fees.
Discover more from The Economy
Subscribe to get the latest posts sent to your email.

VIX Index Explained: How to Trade Wall Street’s Fear Gauge Today

Commercial vs Residential Real Estate: Which Wins in 2026?

Presidential Stock Market Performance: How Trump’s Second Term Compares to History

2026 Real Estate Market News: Are We Heading for a Correction?

Bitcoin Price Forecast 2026–2027: Will the 4-Year Cycle Hold?

Fidelity Crypto vs. Traditional Brokerages: A Guide for Modern Investors

The 2026 Global Smartphone Market: AI Integration and Competitor Analysis

SpaceX IPO: How Aerospace Is Reshaping Tech Startup News

Fidelity Investments Review: Maximizing Returns in a Volatile Stock Market

How Crypto Transformed the Trump Fortune: A $1.4 Billion Financial Breakdown

Global Pension Systems Ranked: The World’s Best and Worst Retirement Frameworks

Global Supply Chain Vulnerabilities: From Eurasian Trade Corridors to Food Consumer Recalls

Why 5% U.S. Treasury Yields Signal a Global Market Regime Shift.

Federal Reserve Defies White House Pressure: Inside Trump’s Demand for Sub-1% Interest Rates After Historic 2026 Rate Hike

State Farm’s $5B Dividend 2026: Who Qualifies & Payout Dates

US-China Relations in Q3 2026: Trade Tariffs and Supply Chain Risks

Top 30 Stocks for Investment in PSX for Massive ROI in 2026

SpaceX Starship Flight 14: First Orbital Attempt & Starlink V3 Launch Explained

The 2026 Crypto Regulatory Shift: What It Means for Institutional Investors

AI Chip Stocks 2026: The Best Semiconductor Investments Beyond Marvell

Tween Back-to-School Trends 2026: What’s Driving the $85B Season

AI-Powered Training: The Next Multi-Billion Dollar Ecosystem in Fitness

Oil Prices Break $100 in 2026: Middle East Conflict & Energy Markets

10-Year Treasury Yield Hits 4.80%: What It Means for Rates & Portfolios

Fidelity Investments Review 2026: SPAXX Yields & Zero-Fee Funds

Shein Clothes Quality & Safety in 2026: What Lab Tests Show

MRVL Earnings 2026: Why Marvell Sank Despite Beating Estimates

BRICS+ Cross-Border Payments 2026: Interoperability Explained
-

 Markets & Finance9 months ago
Top 15 Stocks for Investment in 2026 in PSX: Your Complete Guide to Pakistan’s Best Investment Opportunities
-

 Analysis7 months ago
Johor’s Investment Boom: The Hidden Costs Behind Malaysia’s Most Ambitious Economic Surge
-

 Analysis7 months ago
Top 10 Stocks for Investment in PSX for Quick Returns in 2026
-

 Analysis8 months ago
Brazil’s Rare Earth Race: US, EU, and China Compete for Critical Minerals as Tensions Rise
-

 Banks8 months ago
Best Investments in Pakistan 2026: Top 10 Low-Price Shares and Long-Term Picks for the PSX
-

 Investment8 months ago
Top 10 Mutual Fund Managers in Pakistan for Investment in 2026: A Comprehensive Guide for Optimal Returns
-

 Global Economy9 months ago
15 Most Lucrative Sectors for Investment in Pakistan: A 2025 Data-Driven Analysis
-

 Global Economy9 months ago
Pakistan’s Export Goldmine: 10 Game-Changing Markets Where Pakistani Businesses Are Winning Big in 2025