
Policy
US Tariffs 2026: How Trump’s 11.7% Effective Rate Is Reshaping Global Trade & Inflation

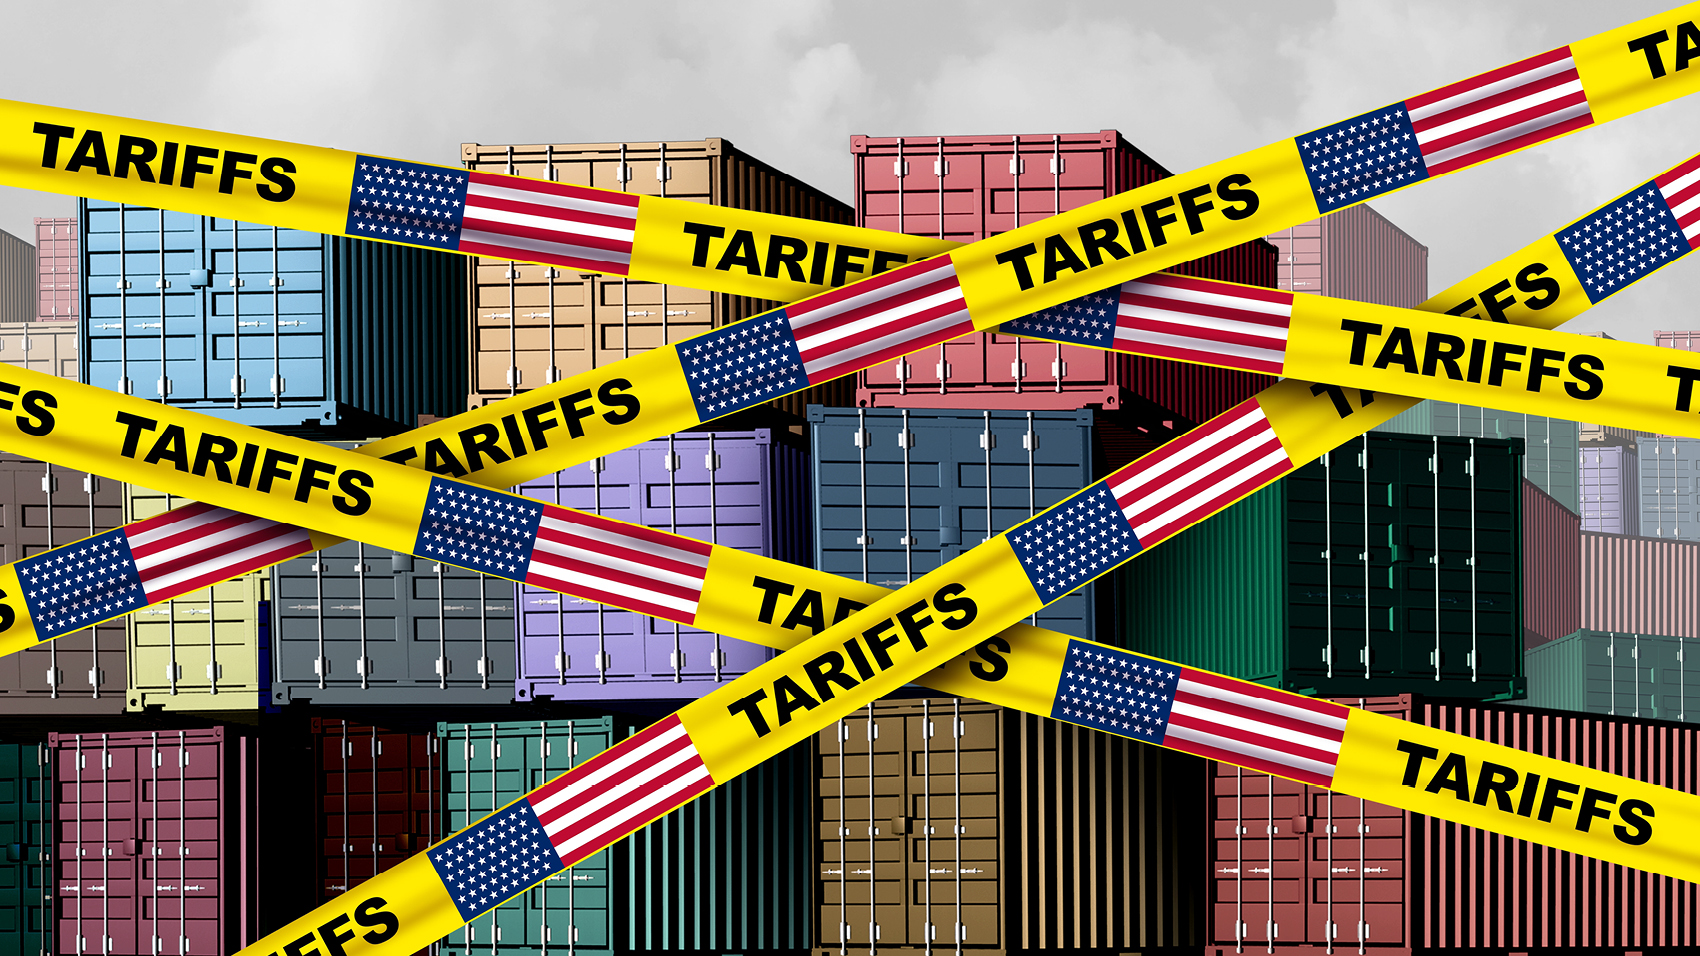
The effective US tariff rate has risen from 2.1% to 11.7% under Trump. Here’s how the tariff regime is reshaping global supply chains, consumer prices, and the trade war outlook for 2026.
In 2025, the Trump administration implemented the most sweeping overhaul of US trade policy since the Smoot-Hawley Tariff Act of 1930. Through executive action — primarily invoking emergency economic powers and national security statutes — the administration raised the effective US tariff rate from 2.1% to an estimated 11.7% as of January 2026.
Eighteen months later, the consequences of that decision are visible across every dimension of the US and global economy: in consumer prices, in supply chain restructuring, in the Federal Reserve’s inflation calculations, and in the diplomatic relationships that underpin global trade.
The tariff regime is not an abstract policy debate. It is a tax — and like all taxes, it has winners, losers, and unintended consequences that took time to manifest and will take years more to fully resolve.
The Scale of the Tariff Shock
To appreciate the magnitude of the 2025 tariff escalation, the baseline comparison matters. Before the first Trump administration’s tariff actions in 2018, the average US effective tariff rate on imports was approximately 1.5%. The first Trump term raised it to approximately 3%. The second term’s actions pushed it to 11.7% — a level not seen in the US in decades.
The mechanics varied by category:
- China-specific tariffs remained elevated and in many cases were increased further, targeting electronics, machinery, textiles, and consumer goods
- A 10% global baseline tariff on all imports was implemented through executive action, though this was challenged in the courts
- Sector-specific tariffs targeted steel, aluminium, solar panels, electric vehicles, and semiconductors from multiple origin countries
The Supreme Court rejected several of the most aggressive tariff actions in 2025, ruling that some executive tariff applications exceeded statutory authority. This opened the door for importers to seek refunds on improperly collected duties — a complex refund process that the administration has contested aggressively. The Supreme Court’s intervention did not eliminate the tariff regime; it trimmed its most legally exposed elements while leaving the core architecture intact.
A 10% global baseline tariff remains in effect as of June 2026.
Who Is Actually Paying the Tariffs
The most persistent economic misconception about tariffs is that foreign exporters pay them. They do not. Tariffs are paid by importing firms — US companies that purchase foreign goods — and the economic burden is distributed between exporters, importers, and consumers depending on market conditions.
The best available evidence suggests that more than 50% of Trump tariff costs are now being passed through to US consumers — a pass-through rate that has been somewhat slower than the near-100% observed under the first-term tariffs, but is accelerating as inventory buffers built before tariff implementation are depleted.
For the median US household, the effective tariff tax represents a meaningful annual cost increase — concentrated in electronics, clothing, furniture, appliances, and consumer goods where import shares are high and domestic substitutes are limited or more expensive.
The pass-through to prices has been one of the primary contributors to US inflation remaining above 3% — and is a key reason why the Federal Reserve’s task of returning inflation to 2% is more difficult than a simple demand-management problem would suggest.
Supply Chain Restructuring: Three Years In
The tariff regime has succeeded in its stated objective of prompting supply chain diversification away from China. But “diversification” has not meant “reshoring.” The dominant pattern has been near-shoring — shifting production to third countries that are not subject to the highest US tariff rates.
Vietnam, Mexico, India, Bangladesh, and Indonesia have been the primary beneficiaries of China-targeted tariff diversion. US imports from these countries have increased substantially since 2022, with Vietnam in particular becoming a major hub for electronics assembly, textile production, and component manufacturing previously concentrated in China.
The irony is that much of this production still relies on Chinese inputs — materials, components, and intermediate goods that flow through third-country manufacturing before reaching the US market. The tariff regime has in many cases added a processing step to the supply chain without fundamentally reducing Chinese industrial participation in global production networks.
Mexico, benefiting from the US-Mexico-Canada Agreement, has seen a surge of near-shoring investment from both US and Chinese firms seeking US market access through a tariff-advantaged production base. This has created genuine economic activity in Mexico while raising questions about whether the tariff regime is achieving its intended effect on Chinese production capacity.
China’s Response: Export Diversification and the Trade Surplus
China’s trade surplus — the gap between what it exports and what it imports — has actually expanded in 2026, despite (or perhaps because of) the US tariff regime. Chinese exporters have aggressively diversified their market base, deepening trade relationships with:
- Southeast Asia (ASEAN markets, particularly Vietnam, Indonesia, Thailand)
- Latin America (Brazil, Mexico, Argentina)
- Africa (through the Belt and Road infrastructure network)
- Middle East (Gulf states diversifying from Western supply chains)
- Russia (bilateral trade dramatically expanded since Western sanctions)
This market diversification has reduced China’s vulnerability to US tariff pressure while maintaining the export-led growth model. The result is a structural change in global trade flows — with Chinese goods increasingly reaching the world through routes that bypass direct US market entry.
The EU has responded separately. European tariffs on Chinese electric vehicles, implemented in 2025, represent the most significant trade action in the China-Europe relationship in years. But China’s response has been measured — targeting European luxury goods with retaliatory measures while continuing to invest in European market access through investment in non-tariffed segments.
The Inflation Arithmetic
The tariff-inflation relationship is one of the most debated and most significant economic linkages in 2026.
The direct mechanism is straightforward: tariffs raise the cost of imported inputs, which businesses pass through to consumer prices. The indirect mechanism is subtler: tariffs reduce import competition, allowing domestic producers to raise prices without competitive constraint. Both channels are operational in the current US economy.
Stanford’s Institute for Economic Policy Research estimated that tariff pass-through to consumers now exceeds 50%, with the full pass-through taking 12–18 months from tariff implementation. Given the tariff escalation of 2025, the full inflationary impact is still working its way through the system as of mid-2026.
This creates a structural floor on US inflation that makes the Federal Reserve’s 2% target difficult to achieve without either reversing the tariff regime (a political impossibility under the current administration) or engineering a significant recession that reduces demand enough to offset the supply-side price pressure.
The Fed cannot solve a tariff-driven inflation problem with interest rate tools alone. This is the core of the policy trap that Kevin Warsh inherited upon taking the Fed chair position.
The WTO and the Multilateral Trade Framework
The US tariff regime has created significant strain on the World Trade Organization framework. Multiple WTO dispute settlement proceedings have been filed by trading partners including the EU, China, Japan, South Korea, and Canada. The US has contested these proceedings and has maintained its practice of blocking WTO Appellate Body appointments — a practice that began in the first Trump term and has effectively disabled the WTO’s binding dispute resolution mechanism.
The practical consequence: the global trading system has fragmented into a series of bilateral and regional arrangements, with the WTO’s rules-based framework increasingly supplemented or supplanted by power-based bilateral negotiations.
For businesses operating across borders, this fragmentation creates compliance complexity, supply chain uncertainty, and strategic risk that has no precedent in the post-war era of multilateral trade liberalisation.
What Comes Next: The Second Half of 2026
Several tariff-related developments are likely to shape the trade environment in the second half of 2026:
Supreme Court refund proceedings — the ongoing dispute over duty refunds for imports collected under executive actions that courts ruled as exceeding statutory authority. Resolution will affect importers’ balance sheets and the effective tariff rate going forward.
EU-US tariff negotiations — the Biden-era tariff truce framework has partially frayed under the Trump administration’s more aggressive posture. EU-US talks on steel, aluminium, and digital services remain ongoing and unresolved.
China-US trade dynamics — with China’s trade surplus expanding and US domestic pressure for further action on Chinese imports growing, additional tariff escalation cannot be ruled out. The November 2026 midterm elections create political incentives for trade action.
WTO dispute outcomes — while the Appellate Body remains disabled, preliminary panel rulings could create diplomatic pressure points with major trading partners.
The Bottom Line
The Trump tariff regime has fundamentally altered the US and global trade landscape. The effective tariff rate of 11.7% represents the most significant barrier the US has erected to international commerce in generations, with consequences that run from consumer prices and Federal Reserve policy to supply chain geography and WTO institutional legitimacy.
The tariff regime is not going away. Political economy — domestic manufacturing interests, national security framing, and electoral incentives — makes tariff rollback extremely unlikely under the current administration.
The relevant questions for investors and businesses are not whether tariffs will be reversed, but how supply chains adapt, how much of the inflationary pass-through remains ahead, and whether the trade war escalates or stabilises in the second half of 2026.
FAQ
Q: What is the current US tariff rate in 2026?
A: The US effective tariff rate rose from approximately 2.1% before the Trump administration to an estimated 11.7% as of January 2026. A 10% global baseline tariff on all imports remains in effect after the Supreme Court struck down some of the most aggressive executive tariff actions.
Q: How do tariffs affect inflation in 2026?
A: More than 50% of tariff costs are now being passed through to US consumers, according to Stanford SIEPR research. This represents a structural supply-side inflation pressure that the Federal Reserve cannot resolve through interest rate policy alone.
Q: What happened to US-China trade in 2026?
A: US-China direct trade has declined under tariff pressure, but China has diversified its export markets significantly — increasing flows to Southeast Asia, Latin America, Africa, and the Middle East. China’s overall trade surplus has actually expanded in 2026.
Q: How are tariffs affecting US consumers in 2026?
A: US consumers are facing higher prices on electronics, clothing, appliances, and consumer goods as tariff costs are passed through the supply chain. This contributes to the inflation reading of 4.2% in May 2026 and reduces household purchasing power.
Discover more from The Economy
Subscribe to get the latest posts sent to your email.


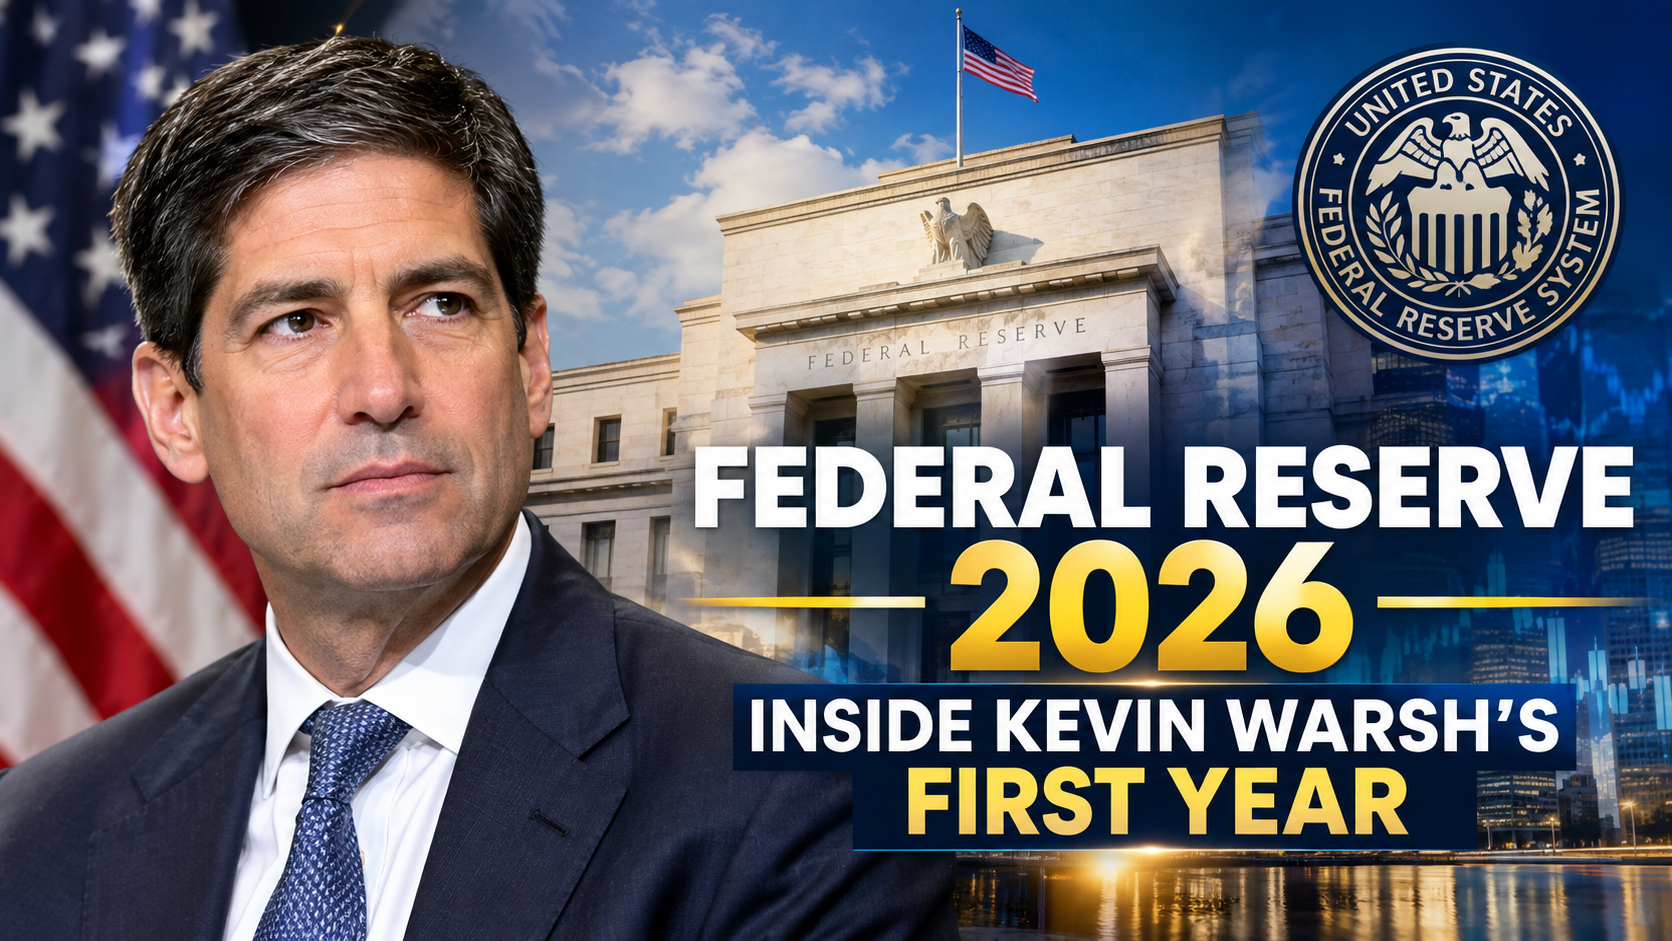
Who is the Federal Reserve chair in 2026? Kevin Warsh was confirmed as the 17th chair of the Federal Reserve in a narrow 54-45 Senate vote on May 13, 2026 — the most divisive confirmation in the Fed’s history — with his term officially beginning when Jerome Powell’s term expired two days later, according to J.P. Morgan Wealth Management’s analysis. Warsh, who at 35 had been the youngest person ever appointed to the Fed’s Board of Governors back in 2006, returned to the central bank after years in the private sector, including a stint as a partner at Duquesne Family Office.
His confirmation followed months of tension between President Trump and outgoing Chair Powell over the pace of rate cuts, and markets immediately began parsing Warsh’s public statements for clues about where he would steer policy.
What Warsh Actually Believes About Inflation
Featured Snippet Target: Fed Chair Kevin Warsh has signaled tighter inflation discipline through a “trimmed averages” approach to measuring price changes — removing the most extreme price movements from the inflation basket before calculating overall trends — while also arguing in a pre-confirmation Wall Street Journal op-ed that artificial intelligence could act as a significant disinflationary force on the broader economy.
That combination puzzled Fed-watchers who expected Warsh, nominated by a president who had repeatedly pushed for lower rates, to simply deliver the dovish policy Trump wanted. Instead, according to analysis from The Motley Fool, Warsh has been notably tight-lipped in his first months, by design — he has stated he wants the Fed to take more of a “back seat” in market communication, believing markets function more efficiently digesting economic data directly rather than reacting to Fed guidance.
The First Meeting: A Hawkish Surprise
Warsh’s debut as chair came at the June 16-17, 2026 FOMC meeting, and it delivered a genuine surprise to markets pricing in continued easing. The Fed held its federal funds rate steady at 3.50%-3.75% for a third consecutive meeting, but new quarterly projections showed nine Fed officials now anticipating a rate hike by the end of 2026 — a sharp reversal from the cutting cycle markets had expected — with the median forecast raised to 3.6% by year-end, according to reporting from The Daily Record. The updated policy statement also removed all forward guidance language about future rate moves, adopting a shortened format reminiscent of the Alan Greenspan era — an early, tangible sign of Warsh’s stated preference for a more narrowly focused, less communicative central bank.
That hawkish pivot came against a genuinely difficult inflation backdrop. Inflation had been running stubbornly above the Fed’s 2% target even before Warsh’s arrival, and the eruption of the Iran conflict in late February 2026 pushed oil prices sharply higher, adding a fresh layer of cost-push inflation pressure just as the new chair was settling in.
Why the FOMC Itself Is Divided
Warsh inherited a genuinely split committee. The 19-member FOMC had signaled openness to a prolonged pause after delivering three rate cuts in the prior fall, with many policymakers believing those cuts had sufficiently addressed slowing job growth, according to analysis from ChannelChek. April 2026’s meeting — held before Warsh’s confirmation — brought the most policy disagreement among committee members in decades, reflecting a genuine intellectual split between officials worried about persistent inflation and those worried about a weakening, “low-hire, low-fire” job market.
Convincing that divided committee to resume cutting rates, rather than hike as the June projections suggested, will likely be one of Warsh’s most consequential early challenges — particularly if inflation data continues running hot on the back of elevated energy costs.
The Bigger Structural Agenda
Beyond the immediate rate debate, Warsh has signaled an intent to reshape how the Fed operates more broadly. He has stated a goal of shrinking the central bank’s balance sheet and strengthening coordination between the Fed, the Treasury, and the White House on economic policy, according to reporting on his confirmation. That coordination goal is itself a departure from the traditional emphasis on Fed independence from fiscal policymakers — a shift some economists have flagged as worth watching closely, given how central bank independence has historically been treated as a bulwark against politically-driven inflation.
The Market Reaction
Markets initially reacted to Warsh’s nomination with genuine uncertainty rather than a clear directional bet. Following his January 2026 nomination, Fed funds futures were pricing a 65.3% probability of at least one rate cut by June — up from 61.8% the prior day — with markets pricing in a total of 52 basis points of cuts for all of 2026 at that point, according to fixed-income commentary from Asset Allocation & Management Company. That dovish pricing has since been substantially unwound by the actual June hawkish pivot — a reminder that a new Fed chair’s confirmed policy stance, once articulated in an actual meeting, matters far more to markets than pre-confirmation speculation about political allegiance.
The Bottom Line
Kevin Warsh’s first months as Fed chair have defied the simple “Trump appointee cuts rates” narrative that dominated coverage of his nomination. Instead, he has delivered a genuinely hawkish debut meeting, adopted a more hands-off communication style, and articulated an inflation-measurement philosophy that gives him intellectual cover to hold rates higher for longer if energy-driven inflation persists. Whether that stance holds through the rest of 2026 will depend heavily on how the Iran conflict’s economic fallout evolves and whether the divided FOMC can coalesce around a consistent direction.
Next step: Track the Fed’s quarterly Summary of Economic Projections alongside actual CPI and PCE inflation prints — the gap between the two, more than any single Warsh public statement, is the clearest signal of whether the Fed’s late-2026 rate path tilts toward the hike some officials now anticipate or back toward the cuts markets originally expected.
Discover more from The Economy
Subscribe to get the latest posts sent to your email.

The traditional framing of this question — commercial for yield, residential for appreciation — has broken down completely in 2026.
Residential appreciation has stalled at roughly 0.5% annually. Commercial returns are now driven by income rather than appreciation, with cap rates expected to compress only 5 to 15 basis points.
Both asset classes are now income plays. The real question is which income stream you can actually access, finance and manage.
Key Takeaways
- Cap rates tell the story. Mid-2026 core ranges sit near 5.2% for multifamily and industrial, 6.4–6.9% retail, 7.4% office, 8.5% hospitality.
- Commercial is bifurcating, not recovering uniformly. Class A tightens while Class B and C trade at double-digit cap rates.
- Data centres lead on demand. Preleasing on projects under construction sits near 80%.
- Residential is frozen, not falling. 6.76% mortgages suppress both buying and selling.
- Capital is returning. 74% of institutional investors plan to increase acquisitions in 2026, with volume up 16%.
The Head-to-Head Comparison
| Factor | Commercial | Residential |
|---|---|---|
| Typical yield | 5.2%–8.5% by sector | 4%–7% gross rental yield |
| Entry capital | High; REITs offer low-cost access | Moderate; 20–25% down typical |
| Financing | Shorter terms, recourse varies | 30-year fixed, government-backed |
| Lease length | 3–15 years | 12 months typical |
| Tenant risk | Concentrated, credit-rated | Diversified, harder to underwrite |
| Management burden | Professional, often delegated | Hands-on or 8–10% to a manager |
| Liquidity | Low; weeks to months | Moderate; days to weeks |
| Valuation driver | Net operating income ÷ cap rate | Comparable sales |
| 2026 tailwind | AI/logistics demand, income stability | Wage growth outpacing prices |
| 2026 headwind | Rate volatility, maturity wall | Affordability, frozen inventory |
The valuation difference is the one most retail investors underestimate. Residential property is priced by what the neighbour’s house sold for. Commercial property is priced by its own cash flow. You can create value in commercial real estate by raising NOI. In residential, you are largely a passenger on the comps.
Where Commercial Stands in 2026
The market has moved past survival mode into selective opportunity — but “selective” is the operative word.
Cap Rates by Sector
CBRE’s H1 2026 survey, drawing on 3,600 estimates across more than 50 US markets, showed flat average cap rates amid rate volatility, with improving liquidity and growing confidence that yields are past their peak.
Colliers’ Q2 2026 data puts core ranges at approximately 5.2% for multifamily and industrial, 6.4–6.9% for retail, 7.4% for office and 8.5% for hospitality. Eastern US markets compressed more than other regions, and Class B/C value-add assets compressed more than stabilised Class A product.
The spread between property types is wider than it has been in years. That is the real pricing story of 2026.
Sector by Sector
Industrial. Net absorption hit 62.1 million square feet in Q2 2026, up 21% quarter-on-quarter, with national vacancy easing to 6.9%. Leasing is on pace for a record near 1 billion square feet. Rent growth has moderated from 20%-plus peaks in 2022 to a sustainable 4–8% annually.
Data centres. Strong demand from AI-driven workloads with projected revenue growth around 7% CAGR. The binding constraint has shifted: power availability, not land, now determines site selection, with grid interconnection delays of several years in many markets.
Office. Genuinely two-track. Performance varies greatly between newer prime and older secondary space, with even more scarcity of prime space expected by year-end. Lagging markets including Chicago and Los Angeles are bottoming out, with Boston, Seattle and Denver expected to follow. Class B and C stock increasingly heads toward redevelopment or conversion.
Retail. Vacancy holding near historic lows at 4.4% nationally on years of restrained new supply. Net lease retail continues to see strong demand from 1031 exchange buyers and family offices.
Multifamily. Working through supply overhang in many Sun Belt markets, with cap rates near the industrial level.
Where Residential Stands in 2026
Residential investing faces a different problem entirely: the entry cost.
At a 6.76% mortgage rate against a median price of $410,700, debt service consumes a far larger share of gross rent than it did in 2021. Many previously viable rental markets no longer cash-flow on conventional financing.
The offsetting factor is the rental market. A 7.30% vacancy rate indicates ample supply giving renters negotiating power — which caps rent growth precisely when landlords need it most.
Where Residential Still Wins
- Financing terms. A 30-year fixed-rate, non-recourse-in-practice loan is a product commercial borrowers simply cannot obtain.
- Tenant diversification. Ten units with ten tenants beats one building with one anchor tenant on risk-adjusted terms.
- Inflation pass-through. Twelve-month leases reprice annually. A 10-year commercial lease with fixed escalators does not.
- Exit liquidity. A single-family rental sells to owner-occupiers. An office building sells only to other investors.
How to Actually Access Each
Commercial, without buying a building:
- Listed REITs. Listed real estate provides access to higher-growth property types versus the NCREIF index, including senior housing, towers and data centres. Public markets also priced higher debt costs earlier than private ones, creating a valuation gap.
- Non-traded REITs and private funds. Higher fees, lower liquidity, potentially better access.
- Direct ownership. Realistic at the small end: single-tenant net lease, small retail strips, flex industrial.
Residential:
- Direct rental purchase with conventional or DSCR financing.
- Residential REITs for passive exposure without management.
- Short-term rental operations, which behave more like a hospitality business than a real estate investment.
The Decision Framework
Ask four questions in order:
- How much capital, and how liquid must it stay? If you may need it within three years, choose listed REITs over direct ownership in either class.
- Do you want a job or an asset? Direct residential is an operating business. REITs are not.
- What is your financing cost? If your borrowing rate exceeds the asset’s cap rate, leverage works against you. At 6.76% mortgages against 5.2% multifamily cap rates, that inversion is live right now.
- What is your inflation view? Short leases favour residential in inflationary periods; long leases with credit tenants favour commercial in disinflationary ones.
What This Means for the Global Market in 2027
Income, not appreciation, defines this cycle. Total returns will largely be driven by income rather than appreciation, making asset selection and management more important than market timing. That is a fundamental regime change from 2015–2021.
Cap rate compression is not coming broadly. With the 10-year Treasury expected to hold near 4% and yields potentially staying at current levels or slightly higher, the 5–15 basis point compression is concentrated almost entirely in premium assets.
The maturity wall is the unresolved risk. Loans originated at 2020–2021 rates continue to reset. Bank lending standards were basically unchanged in Q1 2026, which helps — but refinancing at double the original coupon still impairs equity.
Power becomes a real estate asset class. Grid interconnection rights are now more valuable than land in data centre markets. That reprices utility-adjacent industrial land in ways no traditional model captures.
Public-private valuation gaps close eventually. Listed REITs repriced debt costs first. If private valuations follow, entry points in public vehicles may prove better than direct ownership on a look-back basis.
Frequently Asked Questions
Is commercial real estate better than residential in 2026?
Neither dominates. Commercial offers higher headline cap rates (5.2%–8.5%) and professional management; residential offers superior financing terms and tenant diversification. The choice depends on capital, liquidity needs and management appetite.
What are cap rates in 2026?
Mid-2026 core cap rates sit near 5.2% for multifamily and industrial, 6.4–6.9% for retail, 7.4% for office and 8.5% for hospitality, with wide variation by asset quality.
Which commercial real estate sector is performing best?
Industrial and data centres lead on capital interest and income stability, with data centre preleasing near 80% and industrial leasing on pace for a record near 1 billion square feet.
Can you invest in commercial real estate with little money?
Yes, through listed REITs, which provide access to data centres, towers and senior housing at minimal capital outlay with daily liquidity.
Discover more from The Economy
Subscribe to get the latest posts sent to your email.

The word “correction” is doing a lot of work in housing coverage this year, and most of it is wrong.
A correction implies falling prices. What the data actually shows is something stranger: prices barely moving, transactions barely happening, and a market frozen in place by a mortgage rate that will not fall.
The 30-year fixed rate sits at 6.76%, with the median home price at $410,700 — just 0.5% above one year ago. That is not a crash. It is stasis.
But beneath the national average, something more interesting is happening.
Key Takeaways
- Rates rose, not fell. The 30-year fixed fell to 5.98% in February before climbing to 6.65% by August.
- Price weakness is spreading. 46 metros posted monthly price declines in July, up from 28 the prior month.
- Coastal markets are cracking first. San Francisco fell 2.6% over three months despite being up 7.0% year-on-year.
- A national correction remains unlikely. Delinquencies are near historic lows and homeowner equity is at record levels.
- First-time buyers are locked out. The NAR first-time buyer affordability index stands at just 70 against an overall index of 105.
What the Numbers Actually Say
| Indicator | Level | Direction |
|---|---|---|
| 30-year fixed mortgage | 6.76% (mid-Sept) | Up from 5.98% February low |
| Median home price | $410,700 | +0.5% year-on-year |
| Annual price appreciation | 1.4% (July) | Essentially flat monthly |
| Existing home sales | 4.06 million SAAR (July) | –1.7% month, +0.7% year |
| Inventory | 1.54 million homes / 4.6 months | –1.9% from June |
| Affordability index (overall) | 105 (Q2) | Barely above the 100 threshold |
| Affordability index (first-time) | 70 | Severe gap |
| Mortgage delinquency | ~1.86% | Near historic lows |
The mortgage rate story is the whole story. The 30-year fixed fell to 5.98% on 26 February then rose to 6.65% by 20 August, while the 10-year Treasury yield climbed from 3.94% to 4.70% over the same period.
Housing does not respond to the Fed. It responds to the long end of the curve — and the long end went the wrong way.
The Cooling Is Real, and It Is Spreading
The rise in mortgage rates from about 6% in spring to more than 6.6% since June cooled home prices in July. Annual appreciation edged up to 1.4% from 1.3%, but prices were essentially flat for the month — against a typical pre-pandemic June-to-July gain of 0.4%.
Two data points matter more than the headline:
Negative momentum is broadening. Among the 100 largest markets, 19 posted negative three-month price momentum in July, up from 10 in June. Monthly declines hit 46 metros versus 28 the month before.
High-cost markets are leading down. San Francisco was up 7.0% year-on-year but fell 2.6% over three months and 1.4% month-on-month — the steepest declines among the top 100 metros. Philadelphia posted the sharpest drop in annual momentum, falling 2.3 percentage points from June. Boise followed with a 1.8-point slowdown.
Cotality’s analysis attributes the coastal weakness to elevated prices, buyer fatigue and uncertainty around AI-fuelled wealth gains weighing on higher-priced markets.
That last phrase deserves attention. Bay Area housing has been underwritten by technology equity compensation. When the AI trade wobbles, San Francisco real estate is a leveraged derivative of it.
Why a National Crash Is Still Unlikely
Three structural factors separate 2026 from 2008.
1. Nobody Is Forced to Sell
Mortgage delinquencies sit near historic lows and foreclosures are relatively rare. Most homeowners are sitting on record equity — $17.8 trillion as of Q2 2025.
Distressed supply is what turns a slowdown into a crash. It does not exist in this cycle.
2. The Lock-In Effect Works Both Ways
For every percentage point between current market rates and a homeowner’s existing fixed rate, the probability of choosing to sell declines by 18.1%.
That suppresses demand — but it suppresses supply harder. Redfin’s framing is precise: slow demand has historically caused prices to fall, but that is unlikely here because sellers will pull back too.
3. Forecasts Cluster Around Flat
| Forecaster | 2026 Price Growth |
|---|---|
| Zillow | 1.2% |
| Redfin | 1% |
| Fannie Mae | 3.6% |
| Compass (Simonson) | 0.5%, ±4% variation |
The spread between the most and least bullish is under four percentage points. That is unusual consensus — and it says “flat,” not “falling.”
The Correction That Is Actually Happening
Something is correcting: affordability, and it is correcting through time rather than price.
With home prices growing more slowly than wages for a sustained period for the first time since the financial crisis, real affordability improves even while nominal prices hold. Inflation-adjusted buying costs could decline for a second consecutive year.
There is also a negotiation-based correction. A slower market often adjusts through negotiation before prices fall sharply — longer days on market, seller-paid repairs, closing cost concessions. Buyers gain leverage even when headline values hold.
That leverage does not show up in the Case-Shiller index. It shows up in your closing statement.
What Buyers and Sellers Should Actually Do
If you are buying:
- Negotiate concessions before negotiating price. Sellers defend the headline number and surrender on everything else.
- Compare three-month momentum, not year-on-year appreciation. The former tells you where your market is going.
- Price in taxes and insurance. Higher property taxes and rising insurance premiums are compounding mortgage-driven affordability pressures.
- Consider seasonality. Autumn and winter historically deliver more negotiating power.
If you are selling:
- Accept that your pricing anchor is 2022, and the market’s is not.
- In markets with negative three-month momentum, the first offer is often the best offer.
- Expect longer marketing periods — inventory is flat, but so is urgency.
What This Means for the Global Market in 2027
The 10-year Treasury is the only variable that matters. Mortgage rates track it, not the policy rate. Any 2027 recovery in transaction volume requires the long end to fall — which requires inflation to fall.
Regional divergence will widen, not narrow. High-cost coastal markets tied to technology compensation face a different cycle from Sun Belt and Midwest markets tied to wage growth and migration. National averages will become progressively less useful.
Volume recovery precedes price recovery. Zillow projects 4.26 million existing home sales in 2026, a 4.3% increase. Watch transaction counts as the leading indicator.
The lock-in effect erodes slowly. Every year, life events force some locked-in owners to move. Supply returns gradually rather than in a wave — which is why this market grinds rather than breaks.
Sub-6% is the psychological unlock. LendingTree’s experts do not predict rates dropping below 6% any time soon. Until they do, the freeze holds.
Frequently Asked Questions
Is the housing market going to crash in 2026?
A national crash is unlikely. Mortgage delinquencies are near historic lows at around 1.86%, homeowner equity is at record levels, and forecasters project roughly flat to 1–2% price growth rather than declines.
What are mortgage rates right now?
The 30-year fixed rate is around 6.76% as of mid-September 2026, up from a February low of 5.98%. Most forecasts see rates holding between 6% and 7%.
Which housing markets are falling?
46 metros posted monthly price declines in July. San Francisco recorded the steepest, down 2.6% over three months, followed by weakness in Philadelphia and Boise.
Is 2026 a good year to buy a house?
Buyers have more negotiating power than at any point since 2021, with prices growing slower than wages. Affordability remains difficult for first-time buyers, whose affordability index sits at just 70.
Discover more from The Economy
Subscribe to get the latest posts sent to your email.

Solar Panel Installation Cost in 2026: Why the Math Changed Overnight

Business Insurance: What Coverage You Actually Need and What It Costs in 2026

Auto Insurance Quotes: How to Get the Lowest Rate Without Losing Coverage

Huntington Online Banking: Full Features, Fees, and How It Compares in 2026

Apply for a Bank Account Online: What You Need and How Long It Actually Takes

World’s Largest Economies: Ranking the Top Global Powers

Business Loan: A Complete 2026 Guide to Rates, Types, and Qualifying

Fast Invoice Factoring: How to Turn Unpaid Invoices Into Cash Within 24 Hours

Investment Banking Services: What They Cost and How to Choose the Right Firm in 2026

Structured Settlement Loan: What “Cash Now” Offers Actually Cost You

DUI Attorney: Why Your First Call After an Arrest Should Never Be to the Court

Personal Injury Lawyer: A Complete Guide to Filing Your Claim in 2026

Commercial Vehicle Accident Lawyer: Holding Companies Accountable Beyond the Driver

Inside the White House Feud: How Trump’s Allies Are Painting Anthropic’s Dario Amodei as the Face of ‘AI Doomerism’

Top 30 Stocks for Investment in PSX for Massive ROI in 2026

SpaceX Starship Flight 14: First Orbital Attempt & Starlink V3 Launch Explained

Oil Prices Break $100 in 2026: Middle East Conflict & Energy Markets

AI Chip Stocks 2026: The Best Semiconductor Investments Beyond Marvell

Fidelity Investments Review 2026: SPAXX Yields & Zero-Fee Funds

BRICS+ Cross-Border Payments 2026: Interoperability Explained

Tween Back-to-School Trends 2026: What’s Driving the $85B Season

10-Year Treasury Yield Hits 4.80%: What It Means for Rates & Portfolios

Shein Clothes Quality & Safety in 2026: What Lab Tests Show

China’s US$10.8 Billion Trade Shortcut: Why the Pinglu Canal Matters

MRVL Earnings 2026: Why Marvell Sank Despite Beating Estimates

IMF & World Bank 2026 Global Economic Outlook: Growth, Inflation, Debt

Middle East War Economics 2026: Oil Prices & Energy Markets

High-CPM Finance Niches 2026: Publisher Monetization Blueprint
-

 Markets & Finance9 months ago
Top 15 Stocks for Investment in 2026 in PSX: Your Complete Guide to Pakistan’s Best Investment Opportunities
-

 Analysis7 months ago
Johor’s Investment Boom: The Hidden Costs Behind Malaysia’s Most Ambitious Economic Surge
-

 Analysis7 months ago
Top 10 Stocks for Investment in PSX for Quick Returns in 2026
-

 Banks8 months ago
Best Investments in Pakistan 2026: Top 10 Low-Price Shares and Long-Term Picks for the PSX
-

 Analysis8 months ago
Brazil’s Rare Earth Race: US, EU, and China Compete for Critical Minerals as Tensions Rise
-

 Investment9 months ago
Top 10 Mutual Fund Managers in Pakistan for Investment in 2026: A Comprehensive Guide for Optimal Returns
-

 Global Economy9 months ago
15 Most Lucrative Sectors for Investment in Pakistan: A 2025 Data-Driven Analysis
-

 Global Economy9 months ago
Pakistan’s Export Goldmine: 10 Game-Changing Markets Where Pakistani Businesses Are Winning Big in 2025