
Analysis
US Crude Jumps 10%: WTI Closes In on Brent as Buyers Race for Barrels

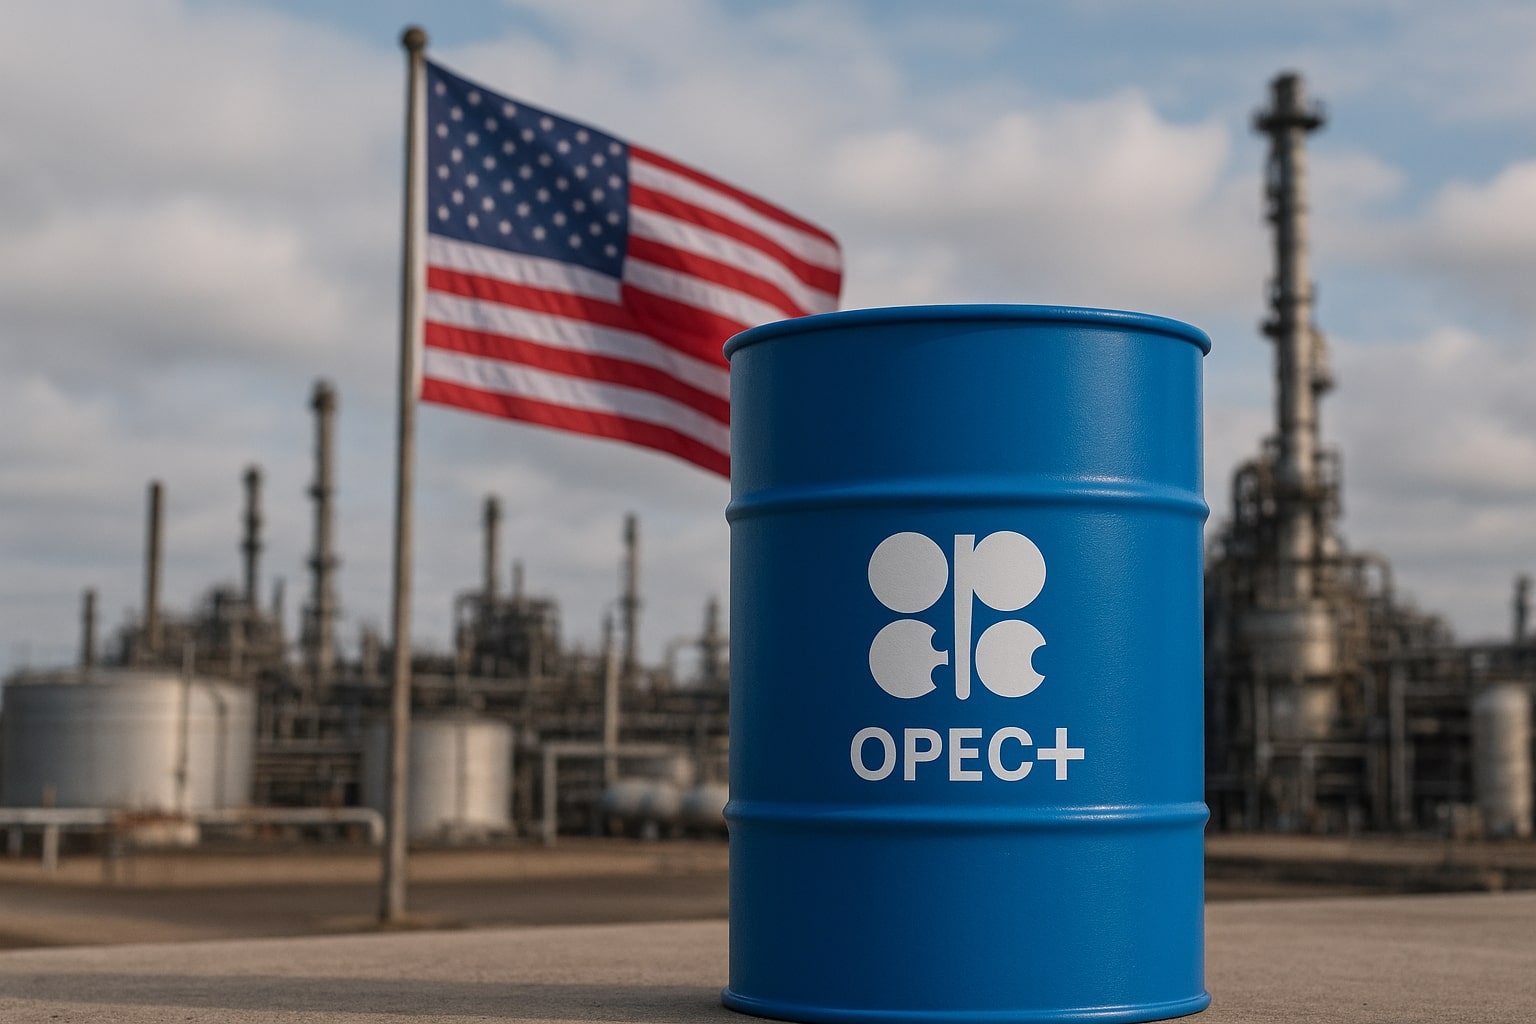
There is a phrase traders use when a market stops behaving normally: price discovery under duress. On the morning of Friday, March 6, 2026, every oil trading desk on earth is living it.
West Texas Intermediate — the American benchmark that spent most of 2025 trading at a comfortable $3–$5 discount to its North Sea rival — has abruptly declared war on that gap. WTI crude futures climbed more than 10% on Friday, pulling closer to Brent as buyers sought available barrels, with Middle Eastern supply constrained by the effective closure of the Strait of Hormuz amid the expanding U.S.-Israeli conflict with Iran. At 10:37 AM CST (1637 GMT), Brent crude futures were up $5.42, or 6.35%, at $90.83 a barrel, while WTI was up $7.81, or 9.81%, at $88.96. By mid-session, WTI had crossed the $90 threshold for the first time since the early 2020s.
The numbers are staggering in their weekly context. US crude has gained nearly 35% this week, while Brent has advanced nearly 28% — a differential that tells you almost everything about the structural shift now reshaping global energy flows. This is not a risk-premium rally. It is a real, physical scramble for accessible barrels, and American crude is suddenly the most accessible barrel on the planet.
Market Snapshot: Where Prices Stand Right Now
| Benchmark | Price (USD/bbl) | Daily Change | Weekly Change |
|---|---|---|---|
| WTI Crude (NYMEX) | $90.14 | +11.27% | +35% |
| Brent Crude (ICE) | $92.32 | +8.09% | +28% |
| WTI–Brent Spread | ~$2.18 | Narrowing from $9 | Compressed rapidly |
| Murban (Abu Dhabi) | ~$99.60 | Approaching $100 | N/A |
| US Retail Gasoline | $3.25/gal | Up 27¢ since last week | N/A |
| European Gas (TTF) | ~€48/MWh | Off peak of €60+ | Peaked Tue Mar 3 |
Sources: CNBC Markets, Reuters, EIA.gov
Crude oil was set on Friday for its strongest weekly gain since the extreme volatility of the COVID-19 pandemic in spring 2020. That benchmark matters. The last time markets moved like this, the entire global economy had ground to a halt. Today, it is a single chokepoint — 21 miles wide at its narrowest — that is producing comparable price violence.
Anatomy of the 10% Jump: How We Got Here in Seven Days
The sequence of events that produced Friday’s historic surge began at dawn on Saturday, February 28, when the United States and Israel launched coordinated strikes on Iran — a campaign that, according to multiple intelligence sources, killed Supreme Leader Ali Khamenei along with other senior officials of the Islamic Republic.
Iran’s response was swift and structural. Iran launched retaliatory missile and drone attacks on Israeli territory and US military bases in Gulf states, while its Islamic Revolutionary Guard Corps (IRGC) issued warnings prohibiting vessel passage through the Strait of Hormuz, leading to an effective halt in shipping traffic.
The economic consequences cascaded in hours, not days. This is a real supply disruption, not a risk premium event. Physical barrels are being affected across crude, products, LPG, and LNG simultaneously. Markets that had spent weeks pricing in the possibility of conflict were suddenly forced to price in its reality.
Oil started its steep rally after the U.S. and Israel launched strikes on Iran, prompting Tehran to stop tankers moving through the Strait of Hormuz. Oil supply equal to about 20% of world demand usually passes through this waterway each day. With the Strait now effectively closed for seven days, that means about 140 million barrels of oil — equal to about 1.4 days of global demand — has been unable to reach the market.
The progression through the week was relentless. U.S. crude oil rose 8.4%, or $5.72, to $72.74 per barrel on Monday after the Strait closure was confirmed. On Thursday, WTI surged 8.51%, or $6.35, to close at $81.01 per barrel in the biggest single day gain since May 2020, while Brent rose 4.93%, or $4.01, to settle at $85.41 per barrel. Then came Friday’s fresh 10%+ thrust — the second straight day where WTI gains outpaced Brent. That asymmetry is the real story.
Why Buyers Are Choosing US Barrels: The Anatomy of a Structural Shift
For most of the past decade, buying American crude carried a logistics penalty. Cushing, Oklahoma — WTI’s physical delivery point — sits landlocked in the American interior. Shipping US crude to Asian refiners required pipeline transit to Gulf Coast export terminals, then a tanker voyage of three to four weeks. Brent, with its North Sea origin and proximity to Atlantic Basin refiners, commanded a premium for good reason: it was easier to get.
That calculus has inverted overnight.
“Refiners and trading houses are searching for alternative barrels, and the U.S. is the largest producer,” said Giovanni Staunovo, an analyst with UBS. “To prevent inventories in the U.S. being reduced too quickly via too high exports, the spread is moving back to the transportation costs.”
The statement is elegant in its simplicity. When Middle Eastern crude becomes geographically inaccessible — when insurance premiums make Hormuz transits economically lethal, when 150 tankers are anchored outside the strait rather than moving through it — the transportation cost of reaching US Gulf Coast export terminals suddenly looks very reasonable by comparison.
With energy production shut down or prevented from shipping in the Middle East, the US is now the world’s largest oil exporter. It is also the world’s largest LNG producer. That position, which would have been unthinkable in 2010, is now the most valuable card in global energy markets.
The numbers confirm the pivot. Shipping costs from the US Gulf to Asia shot up to around $14.50 a barrel — steep, but eminently preferable to the alternative: no barrel at all. Asian refiners that once relied almost exclusively on Gulf crude are phoning Houston and Midland. Indian refiners, meanwhile, have found another lifeline: the Treasury on Thursday granted waivers for companies to buy sanctioned Russian oil stored on tankers to ease supply constraints that have forced refineries in Asia to cut fuel processing, with the first waivers going to Indian refiners, who have since bought millions of barrels of Russian crude. Ship-tracking firm Kpler estimates about 30 million barrels of Russian oil are available and loaded on vessels in the Indian Ocean, Arabian Sea region and Singapore Strait, including volumes in floating storage.
WTI vs. Brent Convergence Explained: A Spread That Rewrote the Rulebook
The WTI–Brent spread is one of the most closely watched differentials in commodity markets. Under normal conditions, it reflects quality differences (WTI is slightly sweeter and lighter), pipeline infrastructure, and relative US export capacity. In early 2026, the spread had been running at roughly $3–$5 per barrel in Brent’s favor — historically unremarkable.
Then came the crisis. At one point, the Brent–WTI spread widened to $9 per barrel as the market’s initial instinct was to bid up the international benchmark in response to Middle Eastern supply risk. That instinct made sense for approximately 48 hours. Then the physical reality set in: Brent-linked grades were increasingly difficult to physically secure, while WTI barrels — sitting in Cushing and on US Gulf Coast terminals — were accessible, insurable, and shippable.
The Brent–WTI spread has narrowed over the past week, with buyers anticipating stronger demand for American export barrels if Middle East flows remain constrained, pulling WTI higher relative to the global benchmark.
The spread compression from $9 down toward $2 is not a technical anomaly. It is a market signal of extraordinary clarity: the world is repricing American crude as the primary reliable supply source for global refining, perhaps for the first time in modern energy history.
The extreme tightness in the physical market is creating a steep backwardation, with the front-month Brent contract trading $4.50 higher than the next one — a situation reminiscent of the acute shortages seen back in 2022, signaling a desperate scramble for prompt barrels.
The Strait in Numbers: Understanding the World’s Most Valuable 21-Mile Passage
To understand why oil markets are behaving as if the world’s energy system faces an existential threat, consider what the Strait of Hormuz actually carries.
- ~20 million barrels per day of crude oil — roughly one-fifth of global daily consumption — transits the Strait, according to the US Energy Information Administration
- ~20% of global LNG supply moves through the same corridor, primarily from Qatar
- ~30% of Europe’s jet fuel originates from or transits the Strait
- ~70–75% of Hormuz flows are destined for China, India, Japan, and South Korea
- ~150 tankers are currently anchored outside the Strait, unable or unwilling to proceed
- At least 5 tankers have been struck by Iranian projectiles or drones
The Strait of Hormuz is effectively closed for commercial shipping despite technically remaining open. Insurance withdrawal is doing the work that physical blockade has not — the outcome for cargo flow is largely the same.
Crude tanker transits through the Strait of Hormuz dropped to four vessels on Sunday, March 1, compared with an average of 24 per day since January, according to energy markets intelligence company Vortexa.
The production damage extends beyond shipping. Iraq has shut down 1.5 million barrels per day of production, according to two Iraqi officials who spoke to Reuters. Kuwait has also started cutting production after running out of storage space. When producers cannot ship their product, they eventually stop making it. Storage fills. Operations halt. The physical supply chain fractures in ways that take months — not days — to repair.
Global Economic Ripple Effects: From Refineries to Runways
The consequences of a $90+ oil market ripple through every corner of the global economy, but their pattern is uneven in ways that matter enormously for investors, policymakers, and consumers.
For American Consumers
Retail gasoline prices in the US have jumped nearly 27 cents since last week to $3.25 per gallon on average, according to the motorist group AAA. The last time gas prices made a similar jump was in March 2022 after Russia invaded Ukraine. That historical parallel carries a warning: the Russia shock of 2022 contributed to the most persistent inflationary episode in forty years in the United States.
For European Energy Markets
Natural gas prices in Europe surged, rising from €30/MWh the previous week to €46/MWh on Monday March 2, peaking above €60/MWh on Tuesday March 3 — nearly double from the previous week — before decreasing again to €48/MWh on Wednesday March 4. European diesel futures also reached their highest level since October 2022.
For Central Banks and Inflation Expectations
This is where the crisis becomes most structurally dangerous for the global economy. Persistently higher oil prices are threatening the interest rate policy of the main central banks, including the Federal Reserve, as high energy prices fuel inflation, limiting the scope to cut interest rates in the coming months.
The Fed had been widely expected to deliver two or three rate cuts in 2026. Those expectations are now under severe pressure. An oil supply shock of this magnitude effectively functions as a tax on every energy-consuming sector of the economy — manufacturing, logistics, aviation, petrochemicals — while simultaneously reducing the Fed’s room to maneuver.
For the Travel Industry: A Direct Hit to Jet Fuel
For travelers and the airlines that serve them, the math is painfully direct. Some 30 percent of Europe’s supply of jet fuel originates from or transits via the Strait of Hormuz. With QatarEnergy — the world’s third-largest LNG exporter and a major refinery products supplier — having halted operations, and with freight disruptions cascading through the supply chain, airlines face a structural fuel cost shock that will not dissipate quickly. Expect surcharges, capacity adjustments on Middle Eastern routes, and potential fare increases on long-haul Asia-Europe corridors. Travelers planning summer bookings should act now; the pricing environment for flights departing after April is already shifting materially upward.
For Asian Economies: The Epicenter of Vulnerability
Asian economies, including China and India, are left particularly exposed. Their scramble to secure oil from other countries could send global prices higher. The majority of the crude oil shipped through the Strait of Hormuz goes to Asia, with China, India, Japan, and South Korea accounting for nearly 70 percent of shipments. China — which has already halted fuel exports to protect its own domestic supply — faces an acute strategic problem: it is simultaneously the world’s largest oil importer and a country whose primary import corridor has been effectively severed.
Investor & Economist Outlook: What the Analysts Are Saying
The range of analyst forecasts tells you something important: nobody actually knows where this ends, and the honest ones admit it.
Barclays analysts told clients that Brent could hit $100 per barrel as the security situation in the Middle East spirals, and it is even possible that the market is looking at a material disruption that sends Brent spot prices above $120 per barrel, according to UBS analysts.
At the extreme end: Qatar’s energy minister, Saad al-Kaabi, told the Financial Times Friday that crude prices could reach $150 per barrel in the coming weeks if oil tankers were unable to pass through the Strait — a scenario that could “bring down the economies of the world.”
The JPMorgan assessment, perhaps, is the most measured and the most sobering. “The market is shifting from pricing pure geopolitical risk to grappling with tangible operational disruption,” said Natasha Kaneva, head of global commodities research at JPMorgan. That sentence deserves to be read slowly. The first phase of an energy crisis — the premium-pricing phase — is already over. We have entered the second, harder phase: the phase where physical barrels cannot be moved, and the market must clear on fundamentals alone.
Goldman Sachs expects the international benchmark Brent crude price to average $10 more than before at $76 per barrel in the second quarter of 2026, with WTI forecast increased by $9 to $71 — based on five more days of very low exports via the Strait of Hormuz, and then a gradual recovery over the following month. However, the bank warned that if there are five weeks of disruption, the price could be as high as $100 for a barrel of oil.
OPEC+ has pledged additional output. OPEC+ pledged to increase oil output by 206,000 barrels per day to mitigate shortages. But the fundamental constraint is not production; it is transportation. A significant portion of Gulf spare capacity cannot reach global markets if the Strait of Hormuz remains inaccessible. Saudi Arabia’s East-West Pipeline and the UAE’s Fujairah pipeline offer partial alternatives, but these routes could sustain a portion of displaced volume but would not offset a full Strait closure.
What Happens Next: Three Scenarios
Scenario 1 — De-escalation within two weeks (Base case, ~35% probability) Diplomatic back-channels, already reportedly active, produce a ceasefire framework. Tanker traffic resumes gradually. The Brent–WTI spread re-widens toward $4–$5. Oil retreats toward $75–$80 Brent. Gasoline prices ease but remain elevated through Q2.
Scenario 2 — Prolonged Strait disruption (Elevated case, ~45% probability) The conflict drags into April. “Every day the Strait stays closed, prices will go higher,” said Staunovo of UBS. Under this scenario, the IEA’s projected 2026 supply surplus flips to a significant deficit. Brent tests $100. WTI — continuing to close the spread — approaches $95–$98. The Fed delays rate cuts. Airline fuel surcharges become permanent features of ticketing.
Scenario 3 — Full Gulf production shutdown (Tail risk, ~20% probability) Gulf producers begin calling force majeure on export contracts — a scenario Qatar’s energy minister explicitly warned about. “Everybody that has not called for force majeure we expect will do so in the next few days that this continues,” Kaabi told the Financial Times. Under this scenario, 5 million barrels per day or more of production is effectively offline. Oil at $130–$150 becomes the central estimate. Stagflation risk across OECD economies becomes the dominant macroeconomic theme.
The International Economist’s Perspective: A Structural Inflection Point
Step back from the tick-by-tick price action and something deeper becomes visible. The convergence of WTI toward Brent is not merely a crisis trade. It is a structural signal that the geography of global energy is being redrawn.
For years, the shale revolution gave American crude a domestic abundance that depressed its global premium. The US became a major exporter, but Brent remained the world’s reference price precisely because it reflected the global clearing price — the benchmark against which scarce Middle Eastern barrels were priced. Today, those Middle Eastern barrels are not just scarce; they are physically unreachable. The reference benchmark is not the most globally significant oil; it is the most accessible oil. And for the first time in a generation, that oil is American.
There is a bitterly ironic twist here for the Trump administration. A White House that has repeatedly demanded lower oil prices — and that structured its foreign policy partly around energy dominance — now presides over the conditions that created the strongest oil price rally since the pandemic. “Consumer sectors lose, but producers benefit. The question is: How long will this last?” asked Rachel Ziemba of risk advisory firm NERA Economic Consulting.
The honest answer, as of March 6, 2026, is that nobody knows. The Strait of Hormuz remains the world’s most important energy chokepoint. Roughly 150 tankers are still anchored in its approaches. Trump has demanded unconditional surrender. Iran has called for de-escalation talks. Somewhere between those two positions lies the price of oil for the next decade — and the economic fate of billions of people who never asked to have any stake in either outcome.
Discover more from The Economy
Subscribe to get the latest posts sent to your email.



Navigating Mortgage and Loan Refinancing in a High-Yield Environment
Global public debt crossing critical thresholds has kept central bank policies volatile, resulting in fluctuating US Treasury yields throughout 2026. For homeowners and commercial property holders burdened by previous high-interest borrowing cycles, finding optimal refinance windows has become a high-stakes financial puzzle. Stalled disinflation and stubborn employment numbers mean rate cuts are incremental, requiring borrowers to act with precision.
Timing your mortgage or commercial loan refinance in this environment requires a deep understanding of yield curve movements and lender risk appetites.
Decoding 2026 Refinance Dynamics
The 10-Year Treasury Yield Benchmark
Mortgage rates continue to track closely with the 10-year US Treasury yield. When macroeconomic anxiety spikes debt issuance, yields rise, tightening consumer borrowing capacity. Savvy borrowers monitor weekly Treasury auctions to lock in rates during brief dip windows.
Hybrid ARMs and Alternative Structures
With fixed rates remaining elevated, 7/1 and 10/1 adjustable-rate mortgages (ARMs) have surged in popularity. These products offer lower initial monthly payments, giving borrowers breathing room until central bank easing cycles fully materialize.
| Loan Product | Current Rate Range | Best For | Key Risk Factor |
| 30-Year Fixed Mortgage | 6.2% – 6.8% | Long-term predictability | Higher initial monthly outlay |
| 7/1 Hybrid ARM | 5.5% – 5.9% | Short-term ownership / flipping | Rate reset risk after year 7 |
| Commercial Refinance | 7.0% – 8.2% | Corporate asset restructuring | Strict DSCR lender covenants |
Actionable Steps for Successful Refinancing
To maximize your chances of securing favorable refinance terms in a volatile market, follow a disciplined preparation strategy.
Boost Your Credit Score Immediately: Lenders in 2026 are applying stringent credit tiering; a 20-point increase can drop your APR by a crucial quarter-point.
Shop Regional Credit Unions: Smaller financial institutions often offer portfolio loans with more flexible underwriting than major national banks.
Calculate the Break-Even Point: Ensure your total closing costs are recouped through monthly savings within 24 months of closing.
“Market Strategist View: Refinancing in 2026 is an exercise in opportunistic timing. Borrowers must maintain immaculate financial profiles ready to strike the moment Treasury yields dip.”
Mastering the complexities of today’s debt environment ensures you can successfully lower your debt service costs and protect your long-term financial stability.
Discover more from The Economy
Subscribe to get the latest posts sent to your email.

The days of pulling generic auto insurance quotes based purely on your zip code and age are officially over. In 2026, insurance comparison engines are powered entirely by generative AI and real-time telematics. These platforms digest thousands of live data points—ranging from your driving smoothness via connected vehicle sensors to real-time traffic congestion patterns—to generate hyper-personalized premiums instantly.
For consumers, this evolution represents both a massive opportunity for savings and a hidden trap for penalty pricing. Understanding how AI algorithms evaluate risk is essential for anyone looking to lower their monthly auto insurance premiums.
How AI Comparison Engines Evaluate Your Risk Profile
Behavioral Telematics and Connected Cars
Modern cars stream performance data directly to insurance aggregators. Generative AI models analyze braking sharpness, acceleration curves, cornering G-forces, and phone distraction metrics. Drivers who maintain smooth, defensive habits are rewarded with dynamic rate cuts of up to 40% compared to traditional rating tiers.
Predictive Traffic and Weather Modeling
AI tools now cross-reference your daily commute route with predictive weather and accident probability models. If your standard parking location or driving corridor has a statistically higher incidence of uninsured motorist claims, your quotes will reflect that hyper-local risk assessment.
| Comparison Factor | Traditional Rating Model | 2026 Generative AI Model | Impact on Premium |
| Mileage & Usage | Annual estimated odometer reading | GPS tracking & live trip duration | High (up to 35% savings) |
| Driving Behavior | MVR driving record & accidents | Real-time braking, speed, & G-force | Critical (determines tier) |
| Vehicle Tech | Make, model, and safety rating | ADAS calibration & repair cost data | Moderate |
Strategies to Lower Your AI-Driven Insurance Quote
To outsmart the algorithm and secure the lowest possible premium in 2026, drivers must proactively manage their digital footprint on insurance platforms.
Opt-In for Telematics Trial Periods: Many insurers offer immediate 15% discounts just for installing their driving app; let it track safe habits for 30 days to lock in permanent savings.
Scrub Unverified Public Records: Ensure your motor vehicle report is free of clerical errors that AI risk models misinterpret as reckless behavior.
Compare AI Aggregators: Use platforms that integrate multi-carrier API feeds rather than single-brand comparison sites to find the best risk-adjusted rate.
“Industry Note: AI-driven pricing rewards transparency and precision. Drivers who actively manage their telematics data consistently out-save those relying on legacy quote calculators.”
Embracing AI comparison tools allows savvy policyholders to customize coverage limits precisely to their driving habits, eliminating wasted premium spend while ensuring robust protection.
Discover more from The Economy
Subscribe to get the latest posts sent to your email.

Despite decades of bans and strict handling mandates, asbestos remains a silent killer across legacy manufacturing plants, shipyards, and modern green-energy infrastructure retrofits. In 2026, regulatory changes by the EPA and tightened occupational health standards have triggered a fresh wave of mesothelioma litigation. Manufacturers attempting to fast-track industrial transitions are encountering catastrophic oversight, exposing workers to legacy toxins and opening corporate parent companies to unprecedented liability.
Navigating a mesothelioma claim in 2026 requires understanding how modern industrial supply chains intersect with historical exposure. Trusts established decades ago are being audited under stricter transparency laws, altering payout ratios and accelerating fast-track settlements for terminally ill plaintiffs.
Modern Industrial Exposure Hotspots
Green Retrofitting and Renewable Energy Infrastructure
A primary source of 2026 asbestos exposure occurs during the decommissioning and retrofitting of older industrial facilities for renewable energy production. Workers insulating electrical grids, modernizing HVAC systems, or upgrading manufacturing floors frequently disturb encapsulated asbestos materials that were improperly documented or ignored during facility audits.
Automotive and Aerospace Supply Chains
With advanced manufacturing booming, workers handling specialized friction materials, gaskets, and heat shields face ongoing risks. Supply chain tracing has become more sophisticated, allowing legal teams to pinpoint exact corporate entities responsible for raw material distribution across multinational borders.
| Industry Sector | Primary Exposure Risk | Legal Venue / Trust | Avg. Claim Value Range |
| Green Energy Retrofit | Disturbed insulation, pipe lagging | Federal Tort / Manufacturer Trust | $1.2M – $3.5M |
| Shipbuilding & Marine | Boiler insulation, structural seals | Asbestos Bankruptcy Trusts | $800K – $2.4M |
| Automotive Manufacturing | Brake components, high-heat gaskets | Third-Party Product Liability | $600K – $1.8M |
Securing Maximum Compensation: Steps for Plaintiffs
Time is of the essence in mesothelioma cases. Plaintiffs and their families must act decisively to secure financial recovery before statutes of limitations expire.
Retain Specialized Counsel: Work exclusively with national mesothelioma law firms possessing deep historical databases of asbestos-containing products.
Audit Employment History: Document every job site, supervisor name, and equipment brand encountered throughout your career.
Expedite Medical Filings: Secure a formal pathological diagnosis quickly to qualify for expedited trust fund distribution and priority trial settings.
“Expert Insight: Modern asbestos litigation is no longer just about historical tracking; it is about holding modern corporations accountable for failing to conduct rigorous environmental safety audits before initiating industrial retrofits.”
By combining meticulous work history reconstruction with aggressive multi-trust filings, victims can secure substantial financial relief to cover specialized immunotherapy and family support.
Discover more from The Economy
Subscribe to get the latest posts sent to your email.

Balance of Payments (BOP)

The Falkland Islands Dispute: Sovereign Wealth, Offshore Drilling, and Market Impacts

Gross Domestic Product (GDP): Nominal vs. Real

What is Inflation and the Consumer Price Index (CPI)?

US-China Trade Competition 2026: Supply Chain Relocation Guide

Oil Prices Break $100 in 2026: Middle East Conflict & Energy Markets

South-South Trade Expansion: Digital Integration and Emerging Market Growth

$166B Tariff Refund Tapering Fast: Is Your Business Missing Out?

Stock Market Today: Dow Climbs 500 Points as Markets Shake Off Inflation Jitters

14th WTO Conference 2026: Tariffs & Global Supply Chain Impact

Swish Secures $24M Funding to Disrupt India’s $100B Food Market

Physical AI and Driverless Tech: The Next Trillion-Dollar Industrial Revolution

Enterprise AI Platforms Disrupting B2B SaaS in 2026: Full Analysis

Crypto vs. Safe Haven Assets 2026: Where Institutions Are Hedging

State Farm’s $5B Dividend 2026: Who Qualifies & Payout Dates

US-China Relations in Q3 2026: Trade Tariffs and Supply Chain Risks

Gold’s Wild 2026: From a Record $5,600 Peak to a 24% Crash and Back Toward $4,500

Oil Surges as Strait of Hormuz Traffic Collapses Again

The Rocket That Won’t Quit: Inside SpaceX’s Falcon 9 Launch Machine

Bank of England Set to Hold Rates Through Year-End, Reuters Poll Shows

SpaceX Starship Flight 14: First Orbital Attempt & Starlink V3 Launch Explained

The 2026 Crypto Regulatory Shift: What It Means for Institutional Investors

AI Chip Stocks 2026: The Best Semiconductor Investments Beyond Marvell

Retail Earnings Week: What Home Depot, Target & Walmart Reveal

AI-Powered Training: The Next Multi-Billion Dollar Ecosystem in Fitness

Russia’s Black Sea Oil Exports Fall for a Fifth Straight Week

Top 30 Stocks for Investment in PSX for Massive ROI in 2026

Global Chip Selloff Deepens: What’s Driving the Aug. 19 Semiconductor Rout
-

 Markets & Finance8 months ago
Top 15 Stocks for Investment in 2026 in PSX: Your Complete Guide to Pakistan’s Best Investment Opportunities
-

 Analysis7 months ago
Johor’s Investment Boom: The Hidden Costs Behind Malaysia’s Most Ambitious Economic Surge
-

 Analysis7 months ago
Top 10 Stocks for Investment in PSX for Quick Returns in 2026
-

 Analysis7 months ago
Brazil’s Rare Earth Race: US, EU, and China Compete for Critical Minerals as Tensions Rise
-

 Banks8 months ago
Best Investments in Pakistan 2026: Top 10 Low-Price Shares and Long-Term Picks for the PSX
-

 Investment8 months ago
Top 10 Mutual Fund Managers in Pakistan for Investment in 2026: A Comprehensive Guide for Optimal Returns
-

 Global Economy9 months ago
15 Most Lucrative Sectors for Investment in Pakistan: A 2025 Data-Driven Analysis
-

 Global Economy9 months ago
Pakistan’s Export Goldmine: 10 Game-Changing Markets Where Pakistani Businesses Are Winning Big in 2025