
Geopolitics
Trafigura’s Venezuelan Oil Gambit: When Geopolitics Meets Market Mechanics

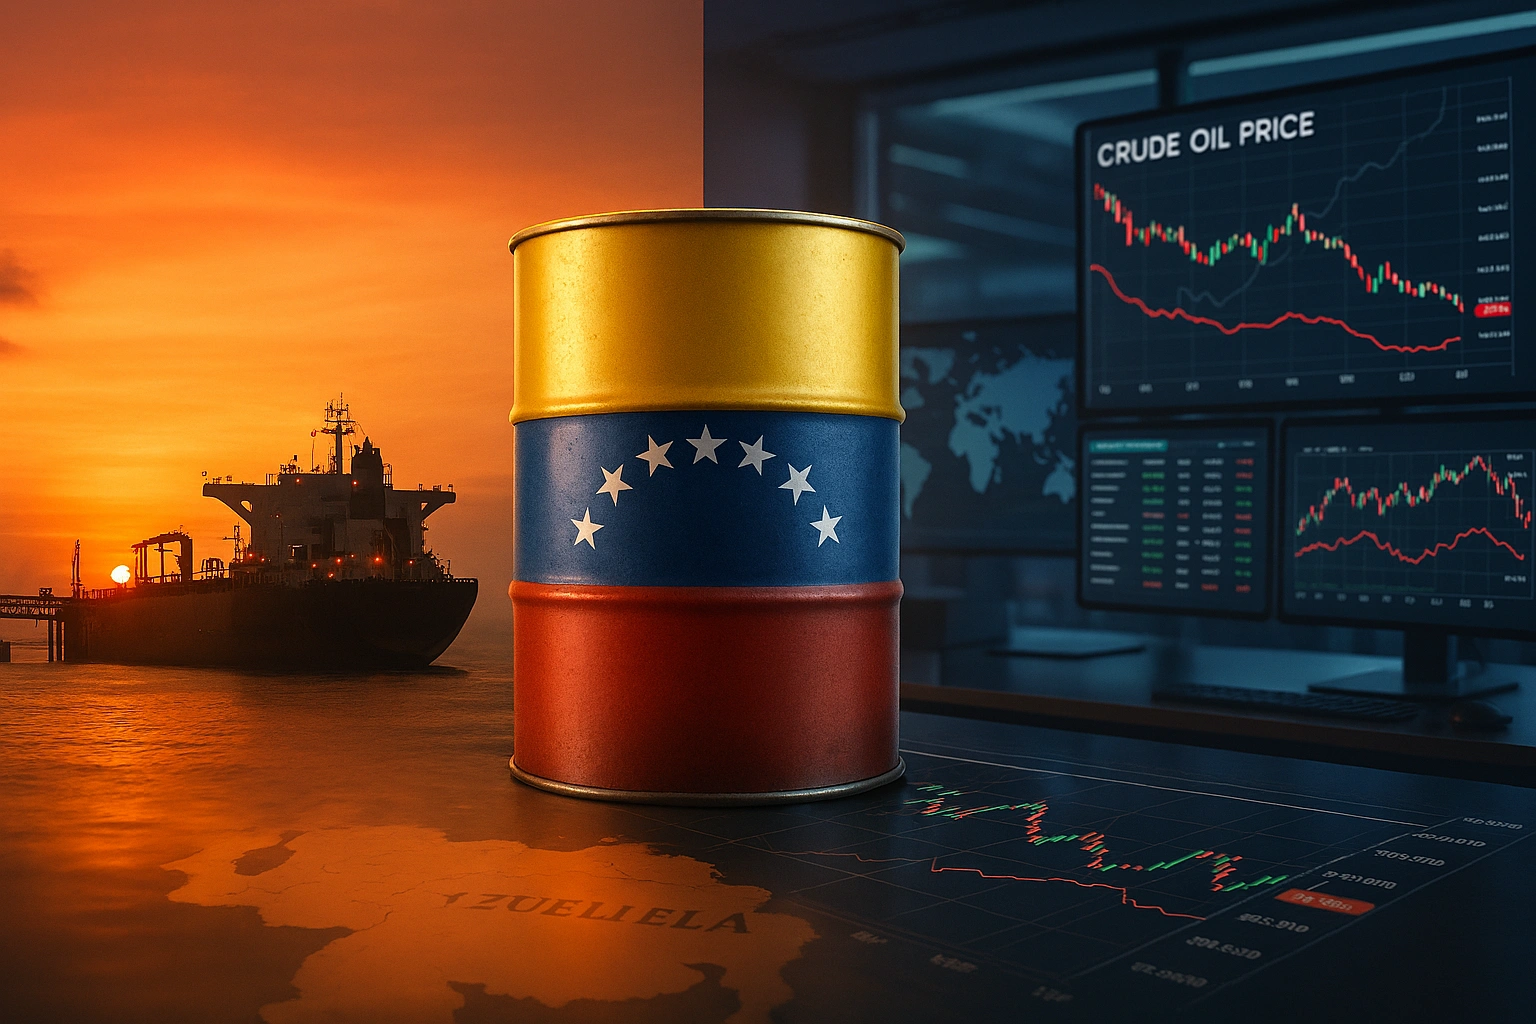
How a landmark crude sale from Caracas signals the collision of energy pragmatism, sanctions architecture, and hemispheric power dynamics
The commodity trading world rarely produces moments of genuine geopolitical significance. Yet when Trafigura Group CEO Richard Holtum stood before President Donald Trump at the White House on January 9, 2026, announcing preparations to load the first Venezuelan crude shipment “within the next week,” he was signaling far more than a routine commercial transaction. This landmark sale represents the most consequential shift in Western Hemisphere energy flows since sanctions severed direct Venezuelan crude trade with the United States seven years ago.
What unfolded in that White House gathering—with nearly 20 industry representatives present—was nothing less than the reconfiguration of Atlantic Basin petroleum markets. The implications ripple across refinery economics in Louisiana and Texas, Canadian heavy crude pricing, geopolitical calculations in Beijing, and the future trajectory of a nation holding the world’s largest proven oil reserves yet producing barely one million barrels daily.
For students of political economy and commodity markets alike, this development offers a masterclass in how commercial incentives, regulatory frameworks, and strategic interests intersect—and occasionally collide.
The Commercial Architecture of an Unprecedented Deal
Trafigura, the world’s third-largest physical commodities trading house behind Vitol and Glencore, has spent decades cultivating expertise in jurisdictional complexity. Operating across 150 countries with revenues exceeding $230 billion annually, the Geneva-based trader has built its reputation on navigating precisely the kind of regulatory labyrinths that Venezuela now presents.
The company’s approach to this Venezuelan engagement reveals sophisticated risk management. According to Reuters, Trafigura and rival Vitol have secured preliminary licenses from the U.S. government authorizing Venezuelan oil imports and exports for an 18-month period. These authorizations, structured through the Treasury Department’s Office of Foreign Assets Control (OFAC), represent a calibrated shift in sanctions enforcement rather than wholesale relief.
The trading houses are not purchasing Venezuelan crude for their own account in the traditional sense. Instead, they’re providing logistical and marketing services at the U.S. government’s request—a crucial legal distinction. This structure allows Washington to maintain nominal control over Venezuelan oil flows and revenue distribution while leveraging private sector expertise in shipping, blending, and market placement.

Industry sources familiar with the arrangements suggest initial shipment volumes in the range of 400,000 to 600,000 barrels per Very Large Crude Carrier (VLCC), with Venezuelan grades including Merey 16, BCF-17, and potentially upgraded Hamaca crude from the Orinoco Belt. These extra-heavy grades, with API gravity below 16 degrees and sulfur content exceeding 2.5%, require specialized refinery configurations—precisely what Gulf Coast facilities were designed to handle.
Venezuela’s Petroleum Paradox: Abundance Without Capacity
The disconnect between Venezuela’s resource endowment and production reality represents one of the starkest industrial collapses in modern energy history. With 303 billion barrels of proven reserves—surpassing even Saudi Arabia’s 267 billion—Venezuela theoretically controls nearly 18% of global recoverable petroleum resources, according to the U.S. Energy Information Administration.
Yet current production hovers around 1.1 million barrels per day, down from 3.5 million bpd achieved in the late 1990s. This represents a 68% decline from peak capacity—a deterioration driven by chronic underinvestment, workforce attrition, infrastructure decay, and the compounding effects of U.S. sanctions imposed since 2019.
Rystad Energy, a leading petroleum research firm, estimates that approximately $53 billion in upstream and infrastructure investment would be required over the next 15 years merely to maintain current production levels. Restoring output to 3 million bpd by 2040—the level Venezuela last sustained in the early 2000s—would require approximately $183 billion in total capital expenditure, or roughly $12 billion annually.
The Orinoco Belt region, containing the densest concentration of reserves, has seen production plummet from 630,000 bpd in November to 540,000 bpd in December 2025, reflecting systemic infrastructure vulnerabilities. Upgraders designed to convert extra-heavy crude into more marketable synthetic grades operate far below capacity or lie completely idle. According to industry assessments, PDVSA’s pipeline network has received virtually no meaningful updates in five decades.
For context, Venezuela’s deteriorated production infrastructure means that even with political stability and sanctions relief, energy analytics firm Kpler projects output could reach only 1.2 million bpd by end-2026—a modest 400,000 bpd increase requiring mid-cycle investment and repairs at facilities like the Petropiar upgrader operated by Chevron.
The Refinery Calculus: Why Gulf Coast Operators Are Paying Attention
Louisiana’s 15 crude oil refineries, accounting for one-sixth of total U.S. refining capacity with processing ability near 3 million barrels daily, were engineered with one primary feedstock in mind: heavy sour crude from Latin America, particularly Venezuela. Most facilities were constructed in the 1960s and 1970s, then retrofitted with advanced coking capacity and corrosion-resistant metallurgy to handle the high-sulfur, low-API gravity crudes that Venezuelan fields produce.
The economics are compelling. Bloomberg analysis indicates that highly complex refiners with substantial coking capacity—including Valero Energy, Marathon Petroleum, Phillips 66, and PBF Energy—can achieve 33% distillate yields versus 30% for medium-complexity plants. Venezuelan Merey crude from the Orinoco Belt, among the highest in sulfur content globally, maximizes the competitive advantage of these specialized facilities.
The U.S. Gulf Coast currently imports approximately 665,000 bpd of heavy crude with API gravity below 22 degrees from sources including Canada (Western Canadian Select), Mexico (Maya), and Middle Eastern producers. Energy Intelligence estimates that U.S. refiners could absorb an additional 200,000 bpd of Venezuelan crude relatively quickly, with potential to increase that figure substantially after equipment adjustments and supply contract renegotiations.
At the start of this century, U.S. refiners were importing approximately 1.2 million bpd of Venezuelan oil—much of it upgraded bitumen. Current infrastructure and refinery configurations could theoretically support a return to those volumes, though logistics, pricing, and regulatory clarity would need to align.
For refiners, Venezuelan crude offers several advantages. First, proximity translates to freight economics: shipping from Venezuelan terminals to Gulf Coast ports requires roughly 5-7 days versus 30-45 days from Middle Eastern sources. Second, Venezuelan grades typically trade at discounts to benchmark crudes, potentially widening crack spreads—the difference between crude costs and refined product values. Third, these heavy grades yield higher proportions of diesel and fuel oil, products currently commanding premium pricing due to renewable diesel conversions reducing traditional distillate supply.
The counterargument, however, involves operational adjustments. Many Gulf Coast refiners have spent the past 15 years optimizing their configurations for the glut of light sweet shale crude produced domestically. Pivoting back toward heavier feedstocks requires time and capital—industry sources suggest 3-6 months per processing unit, with costs potentially exceeding $1 per barrel in margin improvement to justify the investment.
Trafigura’s Strategic Positioning in Complex Markets
What distinguishes Trafigura in this Venezuelan engagement extends beyond balance sheet capacity. The company has cultivated a decades-long specialization in jurisdictionally difficult environments—precisely the combination of political risk, infrastructure constraints, and regulatory complexity that Venezuela epitomizes.
Trafigura’s historical Venezuela operations predate sanctions. Before 2019, the trader was among the most active marketers of Venezuelan crude, establishing relationships with PDVSA and building operational knowledge of loading terminals, crude quality variations, and blending requirements. That institutional memory proves invaluable now.
The company’s approach to compliance has been tested repeatedly. Trafigura has faced scrutiny over operations in sanctioned jurisdictions before, including settlements with the U.S. Department of Justice for bribery allegations related to Brazilian operations and with the Commodity Futures Trading Commission for gasoline market manipulation in Mexico. These experiences have necessitated robust compliance infrastructure—a prerequisite for operating under OFAC licenses where violations carry severe civil and criminal penalties.
Trafigura’s business model—focused on logistics, blending, and market arbitrage rather than production assets—aligns well with the current Venezuelan opportunity. The company can deploy expertise in vessel chartering, crude quality analysis, and customer matching without requiring the massive upstream capital that would deter integrated oil majors.
Competitor Vitol, the world’s largest independent oil trader, brings similar capabilities. Vitol’s participation signals industry-wide assessment that Venezuelan crude flows, under U.S. oversight, present acceptable risk-adjusted returns despite ongoing political uncertainty.
The Sanctions Architecture: Calibrated Control, Not Wholesale Relief
Understanding the current regulatory framework requires precision. The Trump administration has not lifted Venezuelan oil sanctions. Rather, OFAC has issued specific licenses to selected trading houses, creating a controlled channel for Venezuelan crude to reach international markets under explicit conditions.
This represents a dramatic evolution from the sanctions regime imposed in January 2019, when OFAC designated PDVSA for operating in Venezuela’s oil sector pursuant to Executive Order 13850. That designation froze all PDVSA property subject to U.S. jurisdiction and prohibited American entities from transacting with the company without authorization.
Treasury Department statements emphasize that current arrangements aim to “control the marketing and flow of funds in Venezuela so those funds can be used to better the conditions of the Venezuelan people.” This framing positions the U.S. government as de facto revenue manager rather than sanctions enforcer—a subtle but significant shift.
The legal mechanism involves General Licenses and specific licenses issued through OFAC. General License 41, which had authorized Chevron to resume restricted operations since November 2022, was amended in March 2025 requiring the company to wind down operations. Most other specific licenses expired concurrently. The new licenses to Trafigura and Vitol represent a different model: government-directed marketing rather than production partnerships.
The Treasury’s recent actions underscore that enforcement remains vigorous against non-authorized actors. In December 2025, OFAC sanctioned six shipping companies and identified six vessels as blocked property for operating in Venezuela’s oil sector without authorization. These companies were part of the “shadow fleet” that has historically moved Venezuelan crude to China and other buyers at steep discounts.
The sanctions architecture creates market segmentation: licensed traders operating under U.S. oversight versus shadow fleet operators facing interdiction risk. This bifurcation should theoretically compress discounts for licensed flows while maintaining sanctions pressure on regime-linked networks.
Geopolitical Dimensions: Rebalancing Hemispheric Energy Flows
The strategic implications extend far beyond commercial calculations. For decades, China has absorbed the lion’s share of Venezuelan oil exports through opaque arrangements involving state-owned enterprises and lesser-known intermediaries. These flows, estimated at 400,000 bpd in 2025 according to Kpler, often occurred at significant discounts and through non-transparent payment structures linked to debt repayment.
Redirecting Venezuelan crude to U.S. Gulf Coast refiners accomplishes several objectives simultaneously. It provides Washington with leverage over Venezuelan revenue streams, reduces Beijing’s monopsony position in Venezuelan petroleum markets, and offers Gulf Coast refiners access to feedstocks compatible with their infrastructure at potentially attractive pricing.
The timing coincides with broader Trump administration efforts to reshape hemispheric relationships. Following the controversial detention of Venezuelan officials and increased naval presence in Caribbean waters, the Venezuelan oil arrangement represents the economic component of a multi-dimensional strategy toward Caracas.
For Canada, the implications prove more ambiguous. Western Canadian Select (WCS) crude competes directly with Venezuelan heavy grades in Gulf Coast markets. If Venezuelan volumes increase substantially, WCS could face pricing pressure—though Canadian producers might compensate by redirecting flows westward through the expanded Trans Mountain pipeline to Pacific markets serving Asian buyers.
OPEC dynamics add another layer. Venezuela remains an OPEC member despite production far below its quota. Restoration of Venezuelan output, even to 1.5-2 million bpd, would introduce additional heavy crude supply into global markets already experiencing oversupply conditions. Brent crude has been trading near $60 per barrel, with analysts projecting potential pressure toward $50 if Venezuelan production ramps significantly.
The International Energy Agency projects that global oil demand growth will decelerate through 2026, driven by electric vehicle adoption, efficiency improvements, and economic headwinds. In this context, additional Venezuelan supply could pressure prices—benefiting consumers and refiners while challenging higher-cost producers.
Infrastructure Realities: The Time Dimension of Production Recovery
Commodity traders and refinery executives can move relatively quickly. Geopolitics shifts in weeks or months. But petroleum infrastructure operates on a different timeline entirely.
Venezuela’s production capacity deterioration reflects decades of deferred maintenance, equipment failures, workforce departures, and technological obsolescence. Restoring output isn’t a matter of flipping switches—it requires systematic well workovers, pipeline repairs, upgrader rehabilitations, and power system stabilization.
Industry assessments suggest that approximately 300,000 bpd of additional supply could be restored within 2-3 years with limited incremental spending, primarily through well intervention in the Maracaibo Basin and completion of deferred maintenance at existing facilities. This represents the “low-hanging fruit”—production that can be recovered through operational optimization rather than major capital deployment.
Reaching 1.7-1.8 million bpd by 2028 would require substantial upstream capital spending and the restart of idled upgraders in the Orinoco Belt, according to Kpler. Without sweeping institutional reform at PDVSA and new upstream contracts with foreign operators, output exceeding 2 million bpd appears unlikely within this decade.
The investment calculus hinges on political risk assessment. American oil companies—despite White House encouragement—have shown limited appetite for committing billions to Venezuelan operations absent legal framework certainty, property rights clarity, and political stability guarantees. Chevron, currently the only U.S. major with meaningful Venezuelan presence, has tempered expansion plans given regulatory uncertainty.
International operators face additional considerations. Environmental, Social, and Governance (ESG) commitments have become central to institutional investor relations. Venezuelan exposure—given corruption perceptions, human rights concerns, and environmental track records—creates reputational risks that many companies find difficult to justify regardless of commercial returns.
Market Mechanics: Pricing, Logistics, and Competitive Dynamics
The petroleum markets pricing Venezuelan crude provides crucial context. Venezuelan grades trade on a netback basis from Gulf Coast values, with adjustments for quality differentials, freight costs, and risk premiums. Historically, Merey crude traded at discounts of $8-15 per barrel versus West Texas Intermediate benchmark, reflecting its inferior quality and higher processing costs.
Under the new arrangement with U.S. government oversight, several factors should theoretically compress discounts. First, removal of sanctions risk reduces the premium required to compensate buyers for regulatory exposure. Second, official sales channels eliminate the opacity and logistical complications associated with shadow fleet operations. Third, greater volume certainty allows refiners to optimize processing schedules rather than treating Venezuelan crude as opportunistic.
However, Venezuelan crude must still compete with established alternatives. Western Canadian Select typically trades at $15-20 discounts to WTI. Mexican Maya, another heavy sour grade, trades at $3-6 discounts. Middle Eastern grades like Arab Heavy and Basrah Heavy carry their own pricing dynamics based on quality and freight economics.
The logistics dimension proves equally complex. Venezuela’s export infrastructure has deteriorated alongside production capacity. Loading terminals at Jose and Bajo Grande have experienced periodic outages. VLCC (Very Large Crude Carrier) availability fluctuates based on insurance market willingness to cover Venezuelan waters. Blending requirements—mixing extra-heavy crude with diluents to achieve transportable viscosity—add operational complexity and cost.
For Trafigura and Vitol, success requires optimizing each dimension: sourcing crude at competitive prices, securing appropriate tonnage, blending to meet refinery specifications, timing deliveries to match refinery turnaround schedules, and managing counterparty credit risk. These trading houses excel precisely because they’ve built systems to coordinate these moving parts across global supply chains.
Refinery Sector Response: Cautious Interest, Conditional Commitment
Gulf Coast refinery executives express measured enthusiasm tempered by pragmatic concerns. Conversations with industry sources reveal a consistent pattern: interest in Venezuelan crude availability exists, but commitment requires clarity on volume reliability, price competitiveness, and regulatory stability.
Valero Energy, one of the Gulf Coast’s largest independent refiners with significant heavy crude coking capacity, has historical experience processing Venezuelan grades. The company’s complex refineries in Texas and Louisiana could theoretically absorb substantial volumes. Similarly, Marathon Petroleum, Phillips 66, and PBF Energy—all identified by Bloomberg as having advantaged positions—have begun preliminary discussions with traders.
The private calculus involves margin analysis. Refiners model crack spreads—the difference between crude acquisition costs and refined product revenue—under various scenarios. Venezuelan crude must offer sufficient discounts to justify the operational adjustments required to process it relative to current feedstock slates.
One refinery consultant suggested that processing Venezuelan heavy sour could improve margins by more than $1 per barrel for optimally configured facilities—a meaningful improvement in an industry where quarterly earnings often hinge on single-digit margin shifts. However, realizing those economics requires locking in regular supplies and completing equipment modifications.
The other consideration involves alternative destinations. If Venezuelan crude doesn’t offer competitive economics to Gulf Coast refiners, it could flow to Indian or Spanish facilities—both have historical experience with Venezuelan grades and could potentially absorb volumes. This global optionality constrains how aggressively refiners can negotiate, as traders maintain leverage through alternative placement channels.
Forward-Looking Scenarios: Mapping Possible Trajectories
Projecting Venezuelan oil’s trajectory requires scenario planning across multiple dimensions. Consider three plausible pathways:
Scenario One: Controlled Ramp (Most Probable) Venezuelan crude exports to U.S. Gulf Coast increase gradually to 300,000-400,000 bpd by end-2026, facilitated by licensed traders under government oversight. Production reaches 1.2 million bpd through operational optimization without major capital deployment. Revenues flow through supervised channels, with incremental stability allowing limited foreign investment. This scenario implies modest pressure on Canadian heavy crude pricing, marginal tightening of heavy-light differentials, and sustainable if unspectacular commercial returns for trading houses.
Scenario Two: Accelerated Recovery (Optimistic) Political consolidation and institutional reform unlock significant foreign investment. Production accelerates toward 1.7-1.8 million bpd by 2028 as upgraded infrastructure comes online. U.S. and international oil companies commit tens of billions in upstream capital, viewing Venezuelan reserves as strategic long-term assets. In this pathway, Venezuelan crude becomes a major factor in Atlantic Basin markets, materially impacting WCS pricing and potentially displacing Middle Eastern imports. However, this scenario requires sustained political stability—historically elusive in Venezuela.
Scenario Three: Partial Reversal (Bearish) Operational challenges, infrastructure failures, or political instability constrain production recovery. Volumes remain below 1 million bpd despite initial optimism. Sanctions enforcement against non-licensed actors proves inconsistent, allowing shadow fleet operations to continue. Limited revenue transparency and governance failures deter major investment. In this scenario, Venezuelan crude remains a niche supply source rather than transformative market factor, with Trafigura and Vitol managing modest volumes under challenging conditions.
The probability-weighted outcome likely falls between scenarios one and three—meaningful but constrained growth, subject to political volatility and infrastructure limitations that prevent full potential realization.
The Institutional Question: Can PDVSA Be Reformed?
Perhaps the most fundamental uncertainty involves Petróleos de Venezuela (PDVSA) itself. The state oil company, once among Latin America’s premier petroleum enterprises, has become synonymous with mismanagement, corruption, and operational dysfunction.
PDVSA’s decline predates sanctions, as noted by Carole Nakhle, CEO of Crystol Energy: “The collapse predates sanctions. Chronic mismanagement, politicization and underinvestment weakened the industry long before restrictions were imposed.” Sanctions accelerated deterioration but didn’t originate it.
Restructuring PDVSA would require addressing systemic issues: depoliticizing hiring and operations, implementing transparent financial reporting, establishing commercial rather than political decision-making processes, and potentially restructuring approximately $190 billion in outstanding debt obligations owed to creditors including China, Russia, and bondholders.
Without comprehensive institutional reform, foreign companies remain reluctant to commit capital. Joint ventures and service contracts require enforceable legal frameworks and predictable fiscal terms—precisely what Venezuela has lacked for two decades. Some analysts suggest that meaningful recovery might require PDVSA’s effective dismantling and reconstruction from first principles—a politically fraught proposition that successive governments have proven unwilling to undertake.
Broader Implications: Lessons for Energy Geopolitics
This Venezuelan oil saga offers several insights applicable beyond the immediate case:
First, sanctions prove most effective when they change incentive structures rather than simply imposing costs. The current approach—using licensed trading as a control mechanism—represents an evolution from blanket prohibition toward calibrated engagement. Whether this proves more effective at achieving policy objectives remains to be seen.
Second, commodity trading houses occupy a unique position in global energy systems. Their expertise in logistics, risk management, and market arbitrage makes them valuable intermediaries when geopolitical objectives intersect with commercial imperatives. Trafigura and Vitol aren’t merely profit-seekers; they’re providing functionality that governments and national oil companies cannot easily replicate.
Third, infrastructure constraints impose real limits on geopolitical flexibility. Regardless of political developments, Venezuelan production cannot snap back quickly. The physical reality of deteriorated wells, corroded pipelines, and idled upgraders defines what’s possible over relevant timeframes.
Fourth, global oil markets have evolved toward abundance, reducing the strategic leverage that petroleum once provided. With U.S. shale production, Canadian oil sands, Brazilian deepwater, and Guyana offshore fields all contributing supply, Venezuelan barrels matter less than they did when the country produced 3.5 million bpd. This reduces the urgency from both commercial and geopolitical perspectives.
Conclusion: Pragmatism Ascendant, With Caveats
Trafigura’s preparation to load Venezuelan crude represents pragmatism superseding ideology in energy policy—at least provisionally. The arrangement acknowledges that Gulf Coast refiners can utilize Venezuelan heavy crude efficiently, that managed engagement might generate better outcomes than isolation, and that commodity trading expertise can facilitate complex transactions that governments struggle to execute directly.
Yet pragmatism operates within constraints. Infrastructure realities limit how quickly production can recover. Political uncertainties create investment hesitancy. Institutional dysfunction at PDVSA poses ongoing operational challenges. Global supply abundance reduces commercial urgency. These factors collectively suggest that Venezuelan crude will return to international markets, but gradually and conditionally rather than transformatively.
For market observers, several variables warrant monitoring: actual loading volumes versus projections, refinery uptake rates and processing economics, OFAC enforcement consistency against unauthorized actors, and infrastructure investment commitments from international oil companies. These indicators will reveal whether this Venezuelan engagement represents substantive change or merely incremental adjustment at the margins.
The intersection of energy markets and geopolitics rarely produces clean narratives. What unfolds in Venezuela over coming months will test whether commercial incentives can overcome institutional dysfunction, whether controlled engagement proves more effective than isolation, and whether pragmatism in energy policy can be sustained amid inevitable political turbulence.
For now, Trafigura prepares to load crude. Refiners evaluate economics. Policymakers calibrate oversight mechanisms. And the fundamental tension persists: between Venezuela’s immense petroleum potential and its demonstrated inability to realize it. That tension—not any single shipment—defines the Venezuelan oil story. Everything else is execution detail.
The author analyzes commodity markets and energy geopolitics with expertise in petroleum economics, sanctions policy, and hemispheric trade dynamics. Views expressed represent independent analysis informed by premium sources and industry consultation.
Discover more from The Economy
Subscribe to get the latest posts sent to your email.


Key Takeaways
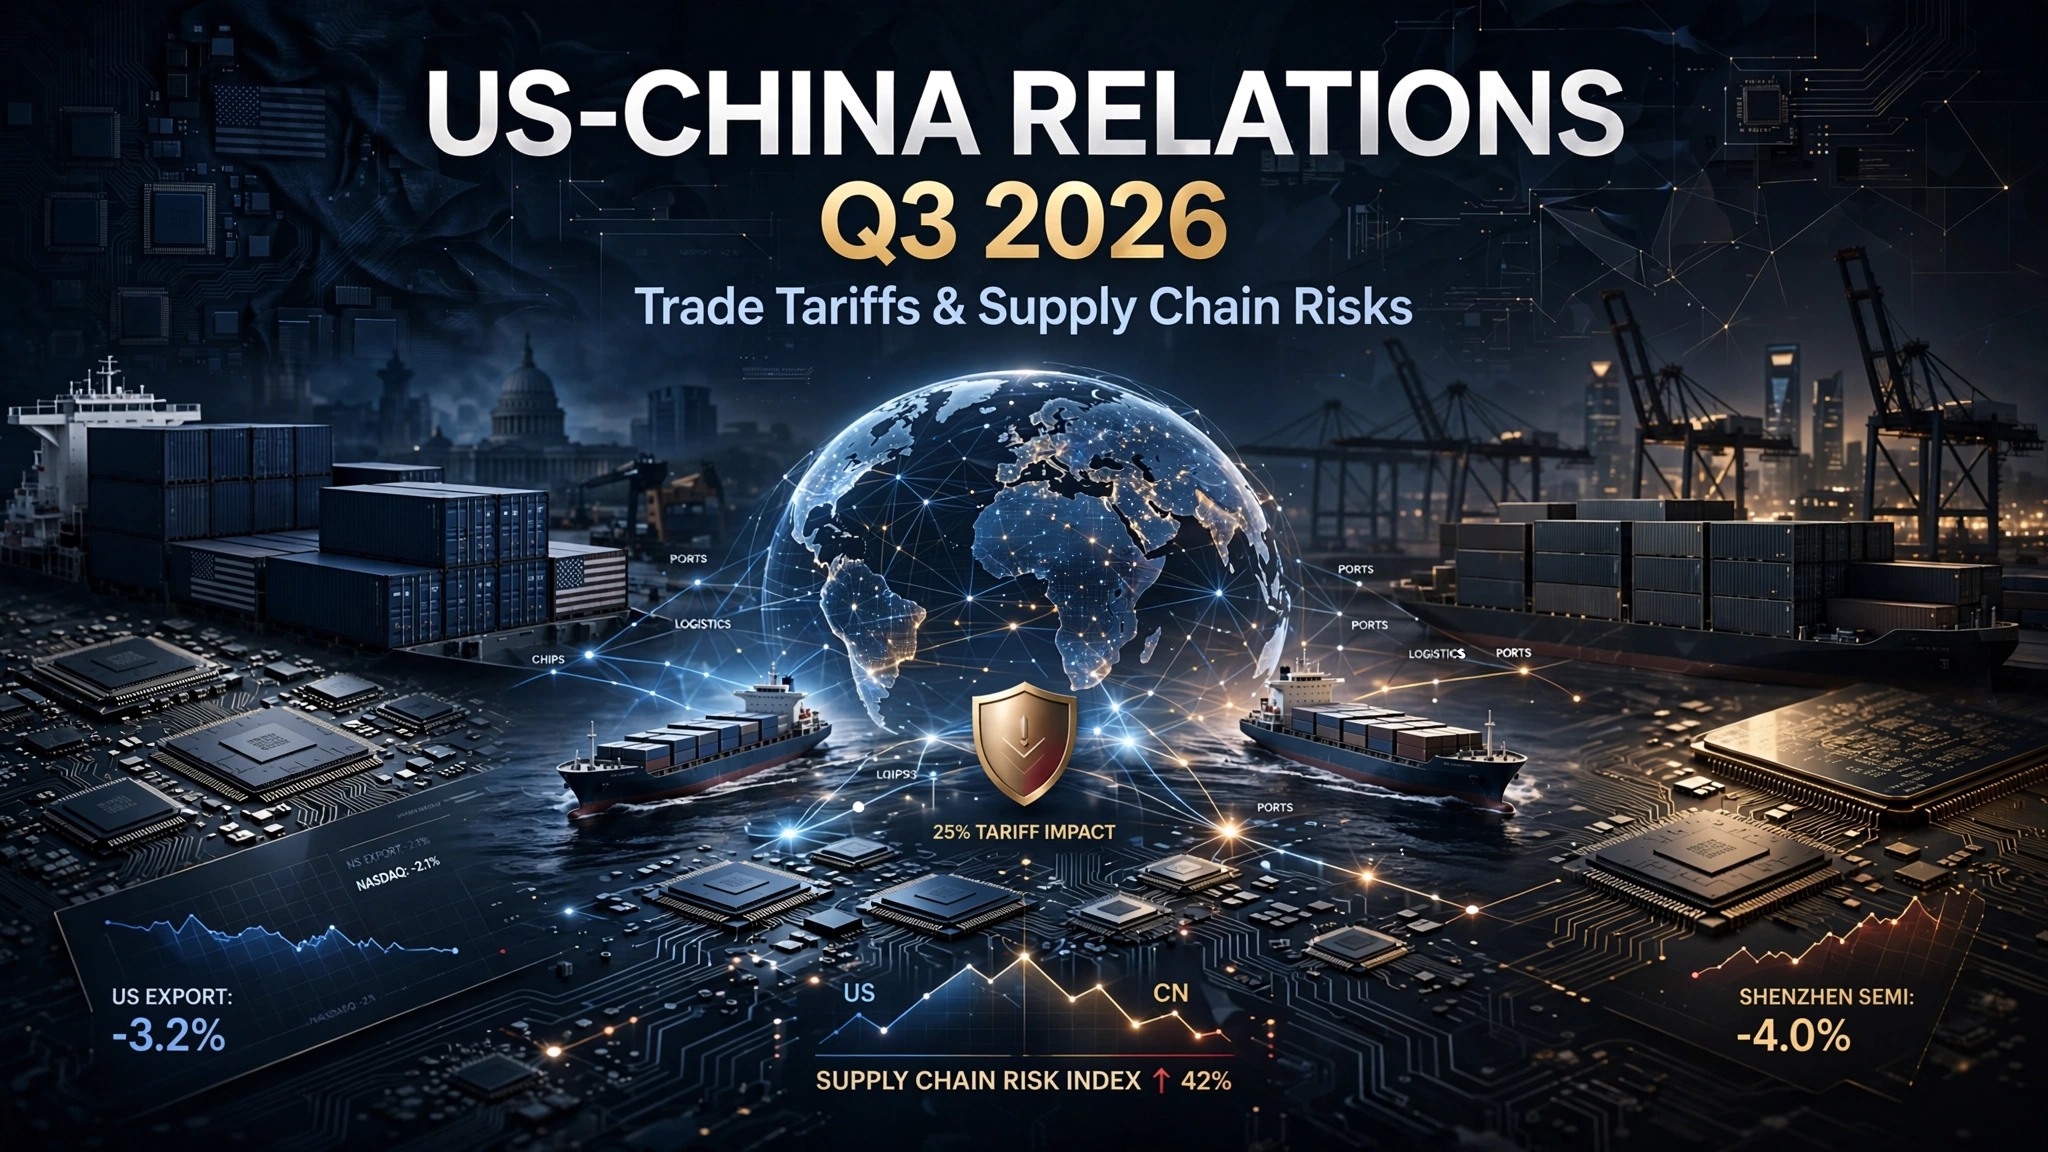
- The US-China relationship in Q3 2026 is best described as a “tactical truce” — managed friction with both sides avoiding total decoupling, rather than a resolved trade relationship.
- The blended effective US tariff on Chinese imports stood around 33% as of May 2026, stacked across four separate legal layers, with some product categories (EVs, batteries, solar) clearing 145%.
- A Supreme Court ruling on February 20, 2026 found the President cannot use IEEPA to impose tariffs, forcing a pivot to Section 122 and Section 301 authorities — a significant legal constraint reshaping the tariff toolkit.
- Washington’s focus has shifted from tariff escalation toward structural supply chain revamps, including critical-minerals diplomacy with dozens of allied countries.
- US imports from China have fallen to near-2001 levels — the year China joined the WTO — reflecting one of the most significant trade reallocations in a generation.
From Escalation to “Managed Competition”
Q3 2026 finds the US-China relationship in a distinctly different posture than the tariff-escalation cycles of 2025. As of mid-2026, the US-China trade relationship is best described as a “tactical truce” — a state of managed friction where both nations maintain aggressive competitive postures while avoiding total economic decoupling. Unlike the optimistic expectations surrounding the 2020 Phase One agreement, today’s reality reflects a fundamental shift toward “de-risking” and “friend-shoring” strategies reshaping global logistics patterns.
That truce has institutional grounding. President Trump and President Xi Jinping appear to have maintained a fragile truce in the trade war following their May 2026 summit in Beijing, though experts say complete decoupling of the world’s two biggest economies remains unlikely, with high tariffs, rare earth restrictions, and tech export controls remaining major sticking points. The two leaders shared a vision of building “a constructive relationship of strategic stability” to bring enhanced certainty and predictability to the global economy — with the agreed approach to restore stability being “managed trade” through a board of trade to manage bilateral trade in non-sensitive goods, reduced tariff and non-tariff barriers in selective sectors, and Chinese commitments to purchase US aircraft and address US concerns about critical mineral supplies.
The Tariff Stack: Complex, Layered, and Legally Contested
Understanding the actual tariff burden on US-China trade in Q3 2026 requires unpacking a genuinely complex, multi-layered structure. The blended effective US tariff on Chinese imports stood around 33% in May 2026, stacked across four layers: MFN (~3.4%), Section 301 (7.5-25%), IEEPA fentanyl (20%), and the reciprocal tariff (currently 10% during a truce extension) — though some HS codes covering EVs, batteries, and solar clear 145%.
That legal architecture was upended mid-year by the judiciary. On February 20, 2026, the Supreme Court ruled that the President cannot use IEEPA to impose tariffs. President Trump subsequently lifted such tariffs and imposed a 10% global tariff for 150 days under Section 122 of the Trade Act instead. This ruling forced a structural pivot in how the administration constructs its China tariff policy — shifting weight toward Section 301 and Section 122 authorities, which carry different procedural and duration constraints than the IEEPA framework the administration had relied on.
The November 2025 Truce Framework Still Shapes Q3 2026
Under the trade agreement, the US halved the 20% fentanyl-related tariff to 10% and extended Section 301 tariff exclusions through November 2026, while China pledged to suspend retaliatory tariffs on US agricultural and food products. The US also agreed to suspend implementation of the new BIS “Affiliates Rule” for one year until November 9, 2026, and China agreed to “take appropriate measures” to resume semiconductor manufacturing and exports of legacy chips, suspending for one year its October 2025 export control measures on rare earth materials — though the status of its earlier April 2025 controls remains ambiguous.
That November 10, 2026 expiration date is the single most important near-term calendar event for anyone tracking US-China trade risk through Q3 and into Q4 2026 — nearly every major concession in the current truce is time-limited to that date.
The Structural Shift: From Tariffs to Supply Chain Architecture
The most consequential Q3 2026 development is not a new tariff announcement but a change in strategic focus. Washington has been steadily moving to revamp supply chains away from China — after taking US levies on China up past 100% at their peak, the administration’s efforts to reset the economic relationship have lately focused on a different set of tools. In early 2026, the United States convened dozens of countries and hosted two separate ministerial meetings on critical minerals, signalling that the policy centre of gravity has moved from bilateral tariff brinkmanship toward multilateral supply chain realignment.
The scale of the underlying reallocation is historically significant. The recalibration of supply chains has been so profound that US imports from China have returned to near-2001 levels — the year China entered the World Trade Organization — with research showing companies were already positioned to adjust to tariff levels well before the most recent escalations.
Comparative Table: US-China Trade Relationship, Late 2025 vs. Q3 2026
| Dimension | Late 2025 | Q3 2026 |
|---|---|---|
| Overall posture | Active tariff escalation | “Tactical truce” / managed competition |
| Primary tariff legal basis | IEEPA (executive emergency powers) | Section 122 / Section 301 (post-Supreme Court ruling) |
| Blended effective tariff rate | Higher, more volatile | ~33% (as of May 2026), layered across four mechanisms |
| Policy focus | Tariff rate negotiation | Critical-minerals diplomacy, supply chain diversification |
| US imports from China | Declining | Near 2001 (pre-WTO-accession-era) levels |
| Key expiration date to watch | N/A | November 9-10, 2026 (multiple truce provisions expire) |
Why It Matters: Sector-Specific Supply Chain Exposure
The blended tariff figures conceal enormous sector variation, and that variation is where the real corporate risk-management work lies. The technology sector has been hit hardest, with tariffs on components forcing abrupt sourcing shifts and catalysing a wave of investment in domestic fabrication, though dependence on Asian supply chains remains a persistent challenge. Automakers have been compelled to redesign supply routes, absorbing some extra costs via price adjustments while facing longer lead times and increased inventory holding that strain margins. Retailers in consumer goods and apparel have explored new sourcing from Bangladesh, India, and Central America, but price volatility and inconsistent quality control remain problematic.
For investors and supply chain planners, the practical takeaway is that “US-China trade risk” is no longer a single macro variable — it is a sector-specific, product-code-specific exposure that requires granular mapping rather than a single blended-tariff assumption.
What to Do Next
- Calendar the November 9-10, 2026 expiration dates explicitly — the Affiliates Rule suspension, Section 301 exclusions, and reciprocal tariff terms are all time-limited to this window, making it the highest-probability point for renewed volatility.
- Map exposure at the HS-code level, not the country level — with some categories facing 145% effective rates while the blended average sits near 33%, country-level tariff assumptions materially understate risk for EV, battery, and solar-linked supply chains.
- Track critical-minerals diplomacy as a leading indicator of the next phase of US trade strategy — the shift from tariff brinkmanship to allied-country mineral-supply coordination signals a more durable structural approach than tariff negotiation alone.
- Monitor the Supreme Court’s IEEPA ruling’s downstream effects on the administration’s remaining tariff toolkit, since Section 301 and Section 122 authorities carry different procedural constraints than the now-invalidated IEEPA approach.
- Treat “near-2001 levels” of US-China import volume as a durable baseline, not a cyclical dip — the scale of supply chain reallocation documented by Harvard Business School research suggests this is structural rather than temporary.
FAQ
What is the current effective tariff rate on Chinese imports to the US?
The blended effective US tariff on Chinese imports stood around 33% as of May 2026, stacked across four layers — MFN, Section 301, the IEEPA fentanyl tariff, and the reciprocal tariff — though specific categories like EVs, batteries, and solar can face rates as high as 145%.
Did the Supreme Court block Trump’s China tariffs?
Partially. On February 20, 2026, the Supreme Court ruled that the President cannot use the International Emergency Economic Powers Act to impose tariffs, prompting a shift to a 10% global tariff under Section 122 of the Trade Act instead. Section 301 tariffs, which rest on separate legal authority, remain largely intact.
When does the current US-China trade truce expire?
Multiple key provisions expire around the same date. The suspension of the BIS “Affiliates Rule” runs until November 9, 2026, and the suspension of heightened tariffs on Chinese imports is set to run until November 10, 2026 — making that window the most significant near-term risk point for the relationship.
Discover more from The Economy
Subscribe to get the latest posts sent to your email.
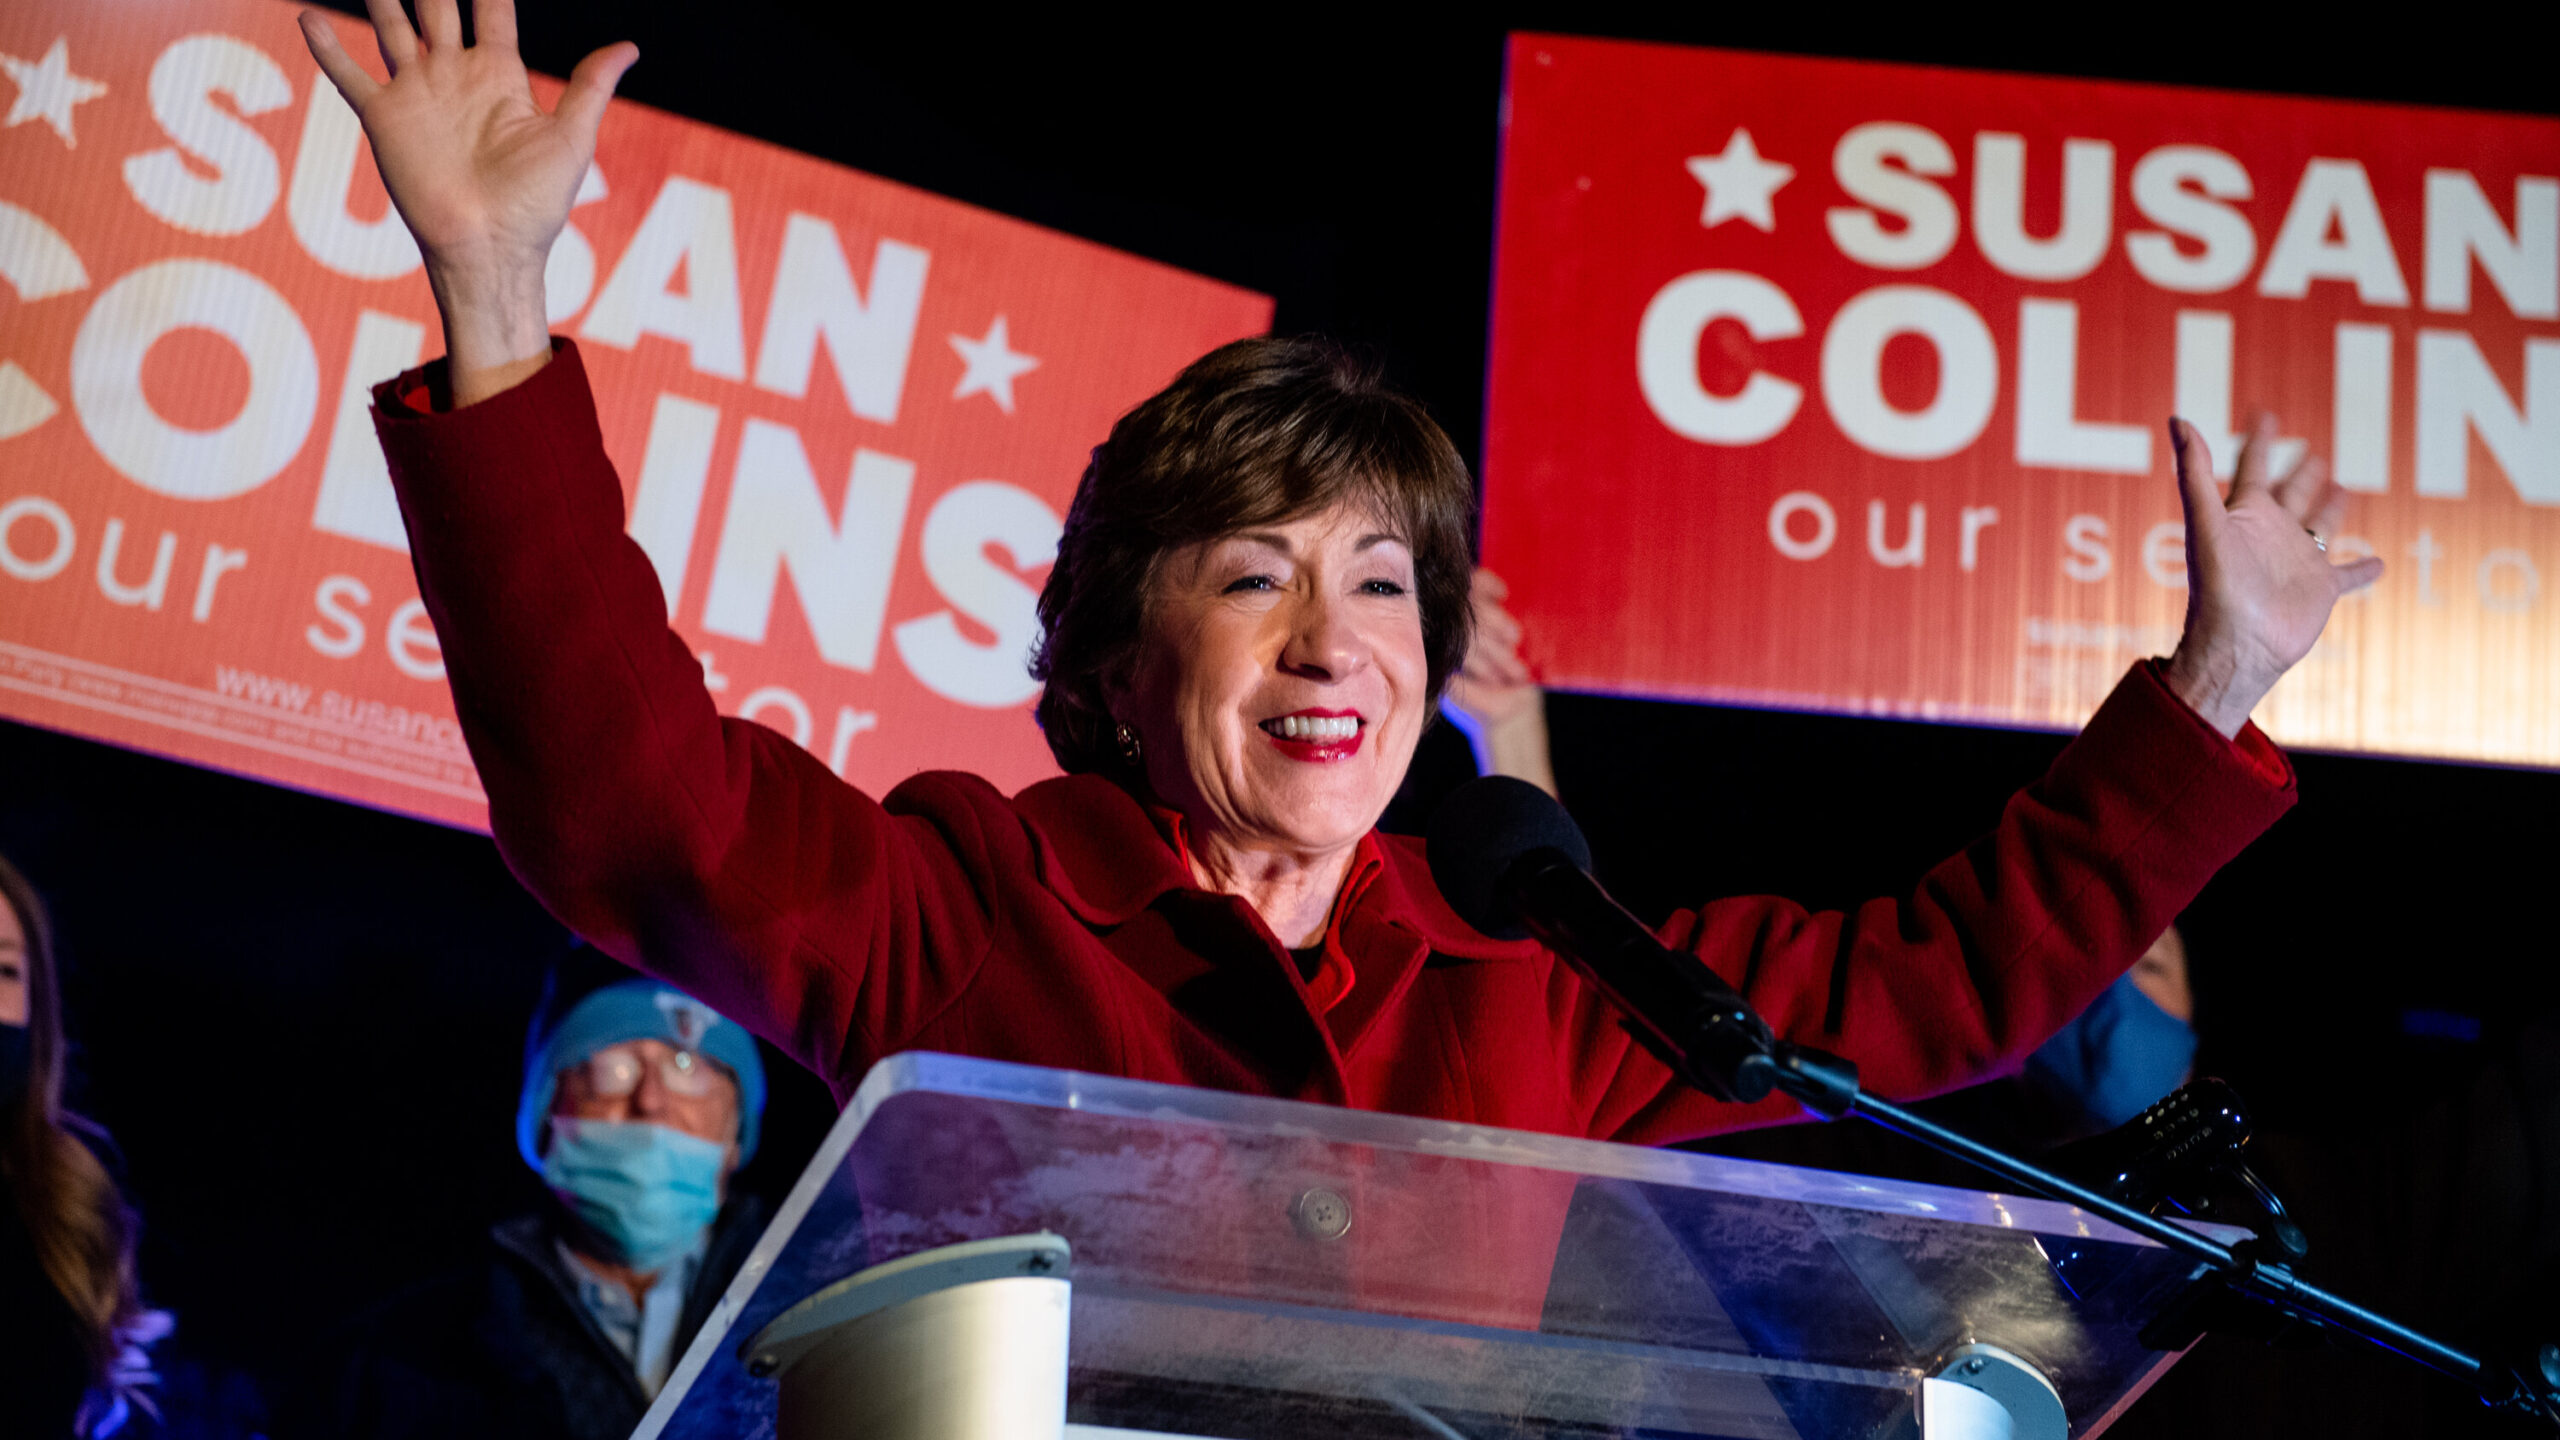
Susan Collins faces her toughest reelection yet against Troy Jackson after a chaotic Democratic candidate swap. Here’s why Maine is a genuine Senate toss-up.
Republican Sen. Susan Collins faces Democrat Troy Jackson, a former Maine Senate president, in a toss-up 2026 general election after Democrats’ original nominee, Graham Platner, was replaced through a special party nomination process. Recent polling shows Jackson with a slight edge.
For a senator who has survived six consecutive campaigns and just cast her 10,000th consecutive Senate vote, Susan Collins now faces what independent analysts are calling a genuine toss-up race — one of the clearest tests of whether Republicans can hold their Senate majority in November.
A Late, Chaotic Democratic Swap
The road to Collins’ current opponent was unusually turbulent. Maine’s Democratic field originally centered on a three-way primary between Gov. Janet Mills, oyster farmer and combat veteran Graham Platner, and former Maryland government official David Costello. Mills dropped out in April, leaving Platner as the grassroots-backed front-runner heading into the June 9 primary — a candidate whose anti-establishment profile and matched fundraising against Collins had national Democrats excited about their odds.
But Platner’s candidacy collapsed amid revelations that included past social media posts and a tattoo resembling a Nazi symbol. With the general election bearing down, the Maine Democratic Party activated an emergency special nomination process — built around county-level delegate meetings rather than a snap primary — to replace him. On July 25, that process produced Troy Jackson, a former Maine Senate president, as the party’s new standard-bearer with roughly 100 days left until Election Day.
Why the Race Is Genuinely Competitive
Despite the compressed timeline, early data suggests Jackson is not merely a placeholder candidate. A Pine Tree Poll conducted by the University of New Hampshire Survey Center showed Jackson with a three-point edge over Collins among likely general-election voters, and Fox News’ inaugural 2026 Power Rankings classify the race as a toss-up — one of roughly a dozen Senate contests that will determine which party controls the chamber.
Collins’ vulnerabilities are structural as much as political. Maine backed the Democratic presidential ticket by seven points in 2024, meaning Collins has long relied on ticket-splitting voters to survive in a state that leans against her party nationally. Democrats are also targeting her more directly than in past cycles, criticizing her comment that she doesn’t regret her 2018 vote to confirm Justice Brett Kavanaugh despite his later vote to overturn Roe v. Wade, and her continued support for Immigration and Customs Enforcement funding following a fatal shooting in Maine involving ICE agents earlier this month.
Collins, who chairs the powerful Senate Appropriations Committee, is leaning on 28 years of relationship-building with industries dependent on federal spending, along with a substantial outside-money advantage. In her campaign launch, Collins argued that “my experience, seniority and independence matter,” while Democrats have countered that “seniority without a backbone is just tenure.”
What It Means for Senate Control
Maine is one of two Senate seats Democrats are defending — or, in Collins’ case, one Republicans are defending — in a state won by the opposing party’s presidential nominee in 2024, making it a marquee Senate battleground alongside Georgia, North Carolina, and Alaska. Democrats need to net four seats nationally to reclaim the majority, and unseating Collins is widely viewed as central to that math given how few genuinely competitive Republican-held seats exist on the 2026 map.
The compressed Jackson campaign timeline is itself a variable worth watching: Collins has now defeated multiple well-funded Democratic challengers over her career, and whether Jackson can build statewide name recognition and a comparable small-dollar fundraising operation in roughly 14 weeks will likely determine whether Maine actually flips or simply stays close.
Discover more from The Economy
Subscribe to get the latest posts sent to your email.
Most headlines on Russia’s economy in July 2026 focus on the latest sanctions package or oil price cap negotiation. The more important story is structural: the model Russia has used to fund its war for four years is showing real signs of running out of road.
The core finding
A research brief from the Center for Strategic and International Studies (CSIS) argues Putin is pushing Russia toward an “economic, political, and military abyss,” according to Fortune. While Russia’s economy remains large — roughly $2.6 trillion — growth is slowing and shrinking on a quarterly basis, with 2026 growth projected at just 0.4%, worse than 2025’s 1% growth, which itself narrowly avoided recession.
Analysts describe Russia’s approach as a form of “military Keynesianism” — the state investing heavily in militarizing the economy while extending financial support to households affected by the war. But per Fortune’s reporting, “after more than four years of war, that well is running dry.” Russia’s fiscal reserves are dwindling, and 71% of the country’s gold reserves have been liquidated to sustain spending.
The number that matters most: oil and gas budget share
The most underreported data point here: the share of oil and gas receipts in Russia’s federal budget revenue fell to just 23% in 2025 — the lowest share in two decades — according to the Oxford Institute for Energy Studies, cited by Fortune. To compensate, Russia has turned to expansive taxation, including raising VAT from 20% to 22% — a move that has proven unpopular domestically.
This matters because Russia’s economy has historically been described, correctly, as fossil-fuel dependent — with oil and gas taxation making up 44% of federal revenues in the decade before the Ukraine invasion, and still around 24.5% over the first three quarters of 2025, according to a Brookings Institution analysis. A further slide to 23% signals the sanctions and diversification pressure are compounding, even as Russia continues finding workarounds through its “shadow fleet.”
The Iran-war reprieve was temporary — and it’s over
The Iran war offered Russia a brief lifeline: Brent crude surged more than 55% at its peak, nearing $120 a barrel, after President Trump eased some sanctions on Russian oil, per Fortune. But that chaos also undermined Russia’s own long-term energy and infrastructure projects in the Middle East — two Russian-linked power plants in Iran were put on hold, along with oil and gas exploration and plans to link Russia to India via Iran through new transit routes. Since then, oil prices have normalized as demand softened and the Strait of Hormuz reopened, removing that temporary cushion.
The sanctions escalation now in motion
The pressure is intensifying on multiple fronts simultaneously. US senators unveiled a sweeping bipartisan Russia sanctions bill in mid-July, which would impose mandatory sanctions on Russian political and military leaders including President Putin, and up to a 100% tariff on the top five countries — including China and India — that purchase Russian crude oil and natural gas, according to CNN. Separately, the EU has been racing to avoid an automatic upward revision of its Russian oil price cap, which would otherwise jump from $44.10 to roughly $58 per barrel if a new sanctions package wasn’t agreed by July 15, per Euronews.
Analysis from the Center for European Policy Analysis notes the outcome depends heavily on whether India and China accept the risk of secondary sanctions: “If China stands firm, Moscow’s dependence on Beijing deepens,” per CEPA. If Russian seaborne oil exports were to fall to near-zero, the budget would lose roughly a quarter of its revenue — an extreme but non-trivial scenario given the pace of legislative and diplomatic pressure building in July 2026.
Why this matters beyond Russia
For countries positioned between Western sanctions regimes and continued Russian energy purchases — including India, and by extension trade partners like Pakistan whose remittance and trade flows intersect with Gulf and South Asian energy markets — the trajectory of Russia’s budget dependency and the secondary-sanctions risk attached to its buyers is a live variable, not a settled one. A further deterioration in Russia’s oil-and-gas revenue share would likely accelerate Moscow’s reliance on China specifically, reshaping regional energy-trade alignments well beyond the Russia-Ukraine conflict itself.
FAQ
What percentage of Russia’s federal budget comes from oil and gas? 23% in 2025 — the lowest share in two decades, according to the Oxford Institute for Energy Studies.
What is Russia’s projected GDP growth for 2026? 0.4%, according to CSIS research cited by Fortune — down from 1% growth in 2025.
What is “military Keynesianism” in the context of Russia’s economy? A term analysts use to describe Russia’s strategy of heavy state investment in militarizing the economy alongside financial support for war-affected households, functioning as a form of stimulus that is now showing signs of fiscal strain.
Discover more from The Economy
Subscribe to get the latest posts sent to your email.

Crypto Daily Outlook: Bitcoin, Altcoins, and the Future of Decentralized Finance

Anthony Scaramucci’s Crypto Prediction: Why MicroStrategy’s Move Is Bitcoin’s “iPhone Moment”

Best Dividend Stocks 2026: European & Asian Blue Chips

World Bank & IMF Reports 2026: Why the “3% Growth” Consensus Is Actually a Debate

Elon Musk’s Boring Company Hits $23B Valuation After UAE-Led $3 Billion Series D

Middle East War Economics 2026: Oil Prices & Energy Markets

PSX Forecast 2026: KSE-100, IMF Reviews & Geopolitics

Asian Markets Outlook 2026: China, Japan & Singapore Stocks

Global Economy 2026: IMF Growth, Inflation & Private Credit

Current Account Deficit (CAD) : Causes and Impact

Balance of Payments (BOP)

The Falkland Islands Dispute: Sovereign Wealth, Offshore Drilling, and Market Impacts

Gross Domestic Product (GDP): Nominal vs. Real

What is Inflation and the Consumer Price Index (CPI)?

State Farm’s $5B Dividend 2026: Who Qualifies & Payout Dates

US-China Relations in Q3 2026: Trade Tariffs and Supply Chain Risks

Gold’s Wild 2026: From a Record $5,600 Peak to a 24% Crash and Back Toward $4,500

Oil Surges as Strait of Hormuz Traffic Collapses Again

The Rocket That Won’t Quit: Inside SpaceX’s Falcon 9 Launch Machine

Bank of England Set to Hold Rates Through Year-End, Reuters Poll Shows

SpaceX Starship Flight 14: First Orbital Attempt & Starlink V3 Launch Explained

The 2026 Crypto Regulatory Shift: What It Means for Institutional Investors

AI Chip Stocks 2026: The Best Semiconductor Investments Beyond Marvell

Retail Earnings Week: What Home Depot, Target & Walmart Reveal

Top 30 Stocks for Investment in PSX for Massive ROI in 2026

AI-Powered Training: The Next Multi-Billion Dollar Ecosystem in Fitness

Russia’s Black Sea Oil Exports Fall for a Fifth Straight Week

Tween Back-to-School Trends 2026: What’s Driving the $85B Season
-

 Markets & Finance8 months ago
Top 15 Stocks for Investment in 2026 in PSX: Your Complete Guide to Pakistan’s Best Investment Opportunities
-

 Analysis7 months ago
Johor’s Investment Boom: The Hidden Costs Behind Malaysia’s Most Ambitious Economic Surge
-

 Analysis7 months ago
Top 10 Stocks for Investment in PSX for Quick Returns in 2026
-

 Analysis7 months ago
Brazil’s Rare Earth Race: US, EU, and China Compete for Critical Minerals as Tensions Rise
-

 Banks8 months ago
Best Investments in Pakistan 2026: Top 10 Low-Price Shares and Long-Term Picks for the PSX
-

 Investment8 months ago
Top 10 Mutual Fund Managers in Pakistan for Investment in 2026: A Comprehensive Guide for Optimal Returns
-

 Global Economy9 months ago
15 Most Lucrative Sectors for Investment in Pakistan: A 2025 Data-Driven Analysis
-

 Global Economy9 months ago
Pakistan’s Export Goldmine: 10 Game-Changing Markets Where Pakistani Businesses Are Winning Big in 2025