
Geopolitics
Trafigura’s Venezuelan Oil Gambit: When Geopolitics Meets Market Mechanics

How a landmark crude sale from Caracas signals the collision of energy pragmatism, sanctions architecture, and hemispheric power dynamics
The commodity trading world rarely produces moments of genuine geopolitical significance. Yet when Trafigura Group CEO Richard Holtum stood before President Donald Trump at the White House on January 9, 2026, announcing preparations to load the first Venezuelan crude shipment “within the next week,” he was signaling far more than a routine commercial transaction. This landmark sale represents the most consequential shift in Western Hemisphere energy flows since sanctions severed direct Venezuelan crude trade with the United States seven years ago.
What unfolded in that White House gathering—with nearly 20 industry representatives present—was nothing less than the reconfiguration of Atlantic Basin petroleum markets. The implications ripple across refinery economics in Louisiana and Texas, Canadian heavy crude pricing, geopolitical calculations in Beijing, and the future trajectory of a nation holding the world’s largest proven oil reserves yet producing barely one million barrels daily.
For students of political economy and commodity markets alike, this development offers a masterclass in how commercial incentives, regulatory frameworks, and strategic interests intersect—and occasionally collide.
The Commercial Architecture of an Unprecedented Deal
Trafigura, the world’s third-largest physical commodities trading house behind Vitol and Glencore, has spent decades cultivating expertise in jurisdictional complexity. Operating across 150 countries with revenues exceeding $230 billion annually, the Geneva-based trader has built its reputation on navigating precisely the kind of regulatory labyrinths that Venezuela now presents.
The company’s approach to this Venezuelan engagement reveals sophisticated risk management. According to Reuters, Trafigura and rival Vitol have secured preliminary licenses from the U.S. government authorizing Venezuelan oil imports and exports for an 18-month period. These authorizations, structured through the Treasury Department’s Office of Foreign Assets Control (OFAC), represent a calibrated shift in sanctions enforcement rather than wholesale relief.
The trading houses are not purchasing Venezuelan crude for their own account in the traditional sense. Instead, they’re providing logistical and marketing services at the U.S. government’s request—a crucial legal distinction. This structure allows Washington to maintain nominal control over Venezuelan oil flows and revenue distribution while leveraging private sector expertise in shipping, blending, and market placement.

Industry sources familiar with the arrangements suggest initial shipment volumes in the range of 400,000 to 600,000 barrels per Very Large Crude Carrier (VLCC), with Venezuelan grades including Merey 16, BCF-17, and potentially upgraded Hamaca crude from the Orinoco Belt. These extra-heavy grades, with API gravity below 16 degrees and sulfur content exceeding 2.5%, require specialized refinery configurations—precisely what Gulf Coast facilities were designed to handle.
Venezuela’s Petroleum Paradox: Abundance Without Capacity
The disconnect between Venezuela’s resource endowment and production reality represents one of the starkest industrial collapses in modern energy history. With 303 billion barrels of proven reserves—surpassing even Saudi Arabia’s 267 billion—Venezuela theoretically controls nearly 18% of global recoverable petroleum resources, according to the U.S. Energy Information Administration.
Yet current production hovers around 1.1 million barrels per day, down from 3.5 million bpd achieved in the late 1990s. This represents a 68% decline from peak capacity—a deterioration driven by chronic underinvestment, workforce attrition, infrastructure decay, and the compounding effects of U.S. sanctions imposed since 2019.
Rystad Energy, a leading petroleum research firm, estimates that approximately $53 billion in upstream and infrastructure investment would be required over the next 15 years merely to maintain current production levels. Restoring output to 3 million bpd by 2040—the level Venezuela last sustained in the early 2000s—would require approximately $183 billion in total capital expenditure, or roughly $12 billion annually.
The Orinoco Belt region, containing the densest concentration of reserves, has seen production plummet from 630,000 bpd in November to 540,000 bpd in December 2025, reflecting systemic infrastructure vulnerabilities. Upgraders designed to convert extra-heavy crude into more marketable synthetic grades operate far below capacity or lie completely idle. According to industry assessments, PDVSA’s pipeline network has received virtually no meaningful updates in five decades.
For context, Venezuela’s deteriorated production infrastructure means that even with political stability and sanctions relief, energy analytics firm Kpler projects output could reach only 1.2 million bpd by end-2026—a modest 400,000 bpd increase requiring mid-cycle investment and repairs at facilities like the Petropiar upgrader operated by Chevron.
The Refinery Calculus: Why Gulf Coast Operators Are Paying Attention
Louisiana’s 15 crude oil refineries, accounting for one-sixth of total U.S. refining capacity with processing ability near 3 million barrels daily, were engineered with one primary feedstock in mind: heavy sour crude from Latin America, particularly Venezuela. Most facilities were constructed in the 1960s and 1970s, then retrofitted with advanced coking capacity and corrosion-resistant metallurgy to handle the high-sulfur, low-API gravity crudes that Venezuelan fields produce.
The economics are compelling. Bloomberg analysis indicates that highly complex refiners with substantial coking capacity—including Valero Energy, Marathon Petroleum, Phillips 66, and PBF Energy—can achieve 33% distillate yields versus 30% for medium-complexity plants. Venezuelan Merey crude from the Orinoco Belt, among the highest in sulfur content globally, maximizes the competitive advantage of these specialized facilities.
The U.S. Gulf Coast currently imports approximately 665,000 bpd of heavy crude with API gravity below 22 degrees from sources including Canada (Western Canadian Select), Mexico (Maya), and Middle Eastern producers. Energy Intelligence estimates that U.S. refiners could absorb an additional 200,000 bpd of Venezuelan crude relatively quickly, with potential to increase that figure substantially after equipment adjustments and supply contract renegotiations.
At the start of this century, U.S. refiners were importing approximately 1.2 million bpd of Venezuelan oil—much of it upgraded bitumen. Current infrastructure and refinery configurations could theoretically support a return to those volumes, though logistics, pricing, and regulatory clarity would need to align.
For refiners, Venezuelan crude offers several advantages. First, proximity translates to freight economics: shipping from Venezuelan terminals to Gulf Coast ports requires roughly 5-7 days versus 30-45 days from Middle Eastern sources. Second, Venezuelan grades typically trade at discounts to benchmark crudes, potentially widening crack spreads—the difference between crude costs and refined product values. Third, these heavy grades yield higher proportions of diesel and fuel oil, products currently commanding premium pricing due to renewable diesel conversions reducing traditional distillate supply.
The counterargument, however, involves operational adjustments. Many Gulf Coast refiners have spent the past 15 years optimizing their configurations for the glut of light sweet shale crude produced domestically. Pivoting back toward heavier feedstocks requires time and capital—industry sources suggest 3-6 months per processing unit, with costs potentially exceeding $1 per barrel in margin improvement to justify the investment.
Trafigura’s Strategic Positioning in Complex Markets
What distinguishes Trafigura in this Venezuelan engagement extends beyond balance sheet capacity. The company has cultivated a decades-long specialization in jurisdictionally difficult environments—precisely the combination of political risk, infrastructure constraints, and regulatory complexity that Venezuela epitomizes.
Trafigura’s historical Venezuela operations predate sanctions. Before 2019, the trader was among the most active marketers of Venezuelan crude, establishing relationships with PDVSA and building operational knowledge of loading terminals, crude quality variations, and blending requirements. That institutional memory proves invaluable now.
The company’s approach to compliance has been tested repeatedly. Trafigura has faced scrutiny over operations in sanctioned jurisdictions before, including settlements with the U.S. Department of Justice for bribery allegations related to Brazilian operations and with the Commodity Futures Trading Commission for gasoline market manipulation in Mexico. These experiences have necessitated robust compliance infrastructure—a prerequisite for operating under OFAC licenses where violations carry severe civil and criminal penalties.
Trafigura’s business model—focused on logistics, blending, and market arbitrage rather than production assets—aligns well with the current Venezuelan opportunity. The company can deploy expertise in vessel chartering, crude quality analysis, and customer matching without requiring the massive upstream capital that would deter integrated oil majors.
Competitor Vitol, the world’s largest independent oil trader, brings similar capabilities. Vitol’s participation signals industry-wide assessment that Venezuelan crude flows, under U.S. oversight, present acceptable risk-adjusted returns despite ongoing political uncertainty.
The Sanctions Architecture: Calibrated Control, Not Wholesale Relief
Understanding the current regulatory framework requires precision. The Trump administration has not lifted Venezuelan oil sanctions. Rather, OFAC has issued specific licenses to selected trading houses, creating a controlled channel for Venezuelan crude to reach international markets under explicit conditions.
This represents a dramatic evolution from the sanctions regime imposed in January 2019, when OFAC designated PDVSA for operating in Venezuela’s oil sector pursuant to Executive Order 13850. That designation froze all PDVSA property subject to U.S. jurisdiction and prohibited American entities from transacting with the company without authorization.
Treasury Department statements emphasize that current arrangements aim to “control the marketing and flow of funds in Venezuela so those funds can be used to better the conditions of the Venezuelan people.” This framing positions the U.S. government as de facto revenue manager rather than sanctions enforcer—a subtle but significant shift.
The legal mechanism involves General Licenses and specific licenses issued through OFAC. General License 41, which had authorized Chevron to resume restricted operations since November 2022, was amended in March 2025 requiring the company to wind down operations. Most other specific licenses expired concurrently. The new licenses to Trafigura and Vitol represent a different model: government-directed marketing rather than production partnerships.
The Treasury’s recent actions underscore that enforcement remains vigorous against non-authorized actors. In December 2025, OFAC sanctioned six shipping companies and identified six vessels as blocked property for operating in Venezuela’s oil sector without authorization. These companies were part of the “shadow fleet” that has historically moved Venezuelan crude to China and other buyers at steep discounts.
The sanctions architecture creates market segmentation: licensed traders operating under U.S. oversight versus shadow fleet operators facing interdiction risk. This bifurcation should theoretically compress discounts for licensed flows while maintaining sanctions pressure on regime-linked networks.
Geopolitical Dimensions: Rebalancing Hemispheric Energy Flows
The strategic implications extend far beyond commercial calculations. For decades, China has absorbed the lion’s share of Venezuelan oil exports through opaque arrangements involving state-owned enterprises and lesser-known intermediaries. These flows, estimated at 400,000 bpd in 2025 according to Kpler, often occurred at significant discounts and through non-transparent payment structures linked to debt repayment.
Redirecting Venezuelan crude to U.S. Gulf Coast refiners accomplishes several objectives simultaneously. It provides Washington with leverage over Venezuelan revenue streams, reduces Beijing’s monopsony position in Venezuelan petroleum markets, and offers Gulf Coast refiners access to feedstocks compatible with their infrastructure at potentially attractive pricing.
The timing coincides with broader Trump administration efforts to reshape hemispheric relationships. Following the controversial detention of Venezuelan officials and increased naval presence in Caribbean waters, the Venezuelan oil arrangement represents the economic component of a multi-dimensional strategy toward Caracas.
For Canada, the implications prove more ambiguous. Western Canadian Select (WCS) crude competes directly with Venezuelan heavy grades in Gulf Coast markets. If Venezuelan volumes increase substantially, WCS could face pricing pressure—though Canadian producers might compensate by redirecting flows westward through the expanded Trans Mountain pipeline to Pacific markets serving Asian buyers.
OPEC dynamics add another layer. Venezuela remains an OPEC member despite production far below its quota. Restoration of Venezuelan output, even to 1.5-2 million bpd, would introduce additional heavy crude supply into global markets already experiencing oversupply conditions. Brent crude has been trading near $60 per barrel, with analysts projecting potential pressure toward $50 if Venezuelan production ramps significantly.
The International Energy Agency projects that global oil demand growth will decelerate through 2026, driven by electric vehicle adoption, efficiency improvements, and economic headwinds. In this context, additional Venezuelan supply could pressure prices—benefiting consumers and refiners while challenging higher-cost producers.
Infrastructure Realities: The Time Dimension of Production Recovery
Commodity traders and refinery executives can move relatively quickly. Geopolitics shifts in weeks or months. But petroleum infrastructure operates on a different timeline entirely.
Venezuela’s production capacity deterioration reflects decades of deferred maintenance, equipment failures, workforce departures, and technological obsolescence. Restoring output isn’t a matter of flipping switches—it requires systematic well workovers, pipeline repairs, upgrader rehabilitations, and power system stabilization.
Industry assessments suggest that approximately 300,000 bpd of additional supply could be restored within 2-3 years with limited incremental spending, primarily through well intervention in the Maracaibo Basin and completion of deferred maintenance at existing facilities. This represents the “low-hanging fruit”—production that can be recovered through operational optimization rather than major capital deployment.
Reaching 1.7-1.8 million bpd by 2028 would require substantial upstream capital spending and the restart of idled upgraders in the Orinoco Belt, according to Kpler. Without sweeping institutional reform at PDVSA and new upstream contracts with foreign operators, output exceeding 2 million bpd appears unlikely within this decade.
The investment calculus hinges on political risk assessment. American oil companies—despite White House encouragement—have shown limited appetite for committing billions to Venezuelan operations absent legal framework certainty, property rights clarity, and political stability guarantees. Chevron, currently the only U.S. major with meaningful Venezuelan presence, has tempered expansion plans given regulatory uncertainty.
International operators face additional considerations. Environmental, Social, and Governance (ESG) commitments have become central to institutional investor relations. Venezuelan exposure—given corruption perceptions, human rights concerns, and environmental track records—creates reputational risks that many companies find difficult to justify regardless of commercial returns.
Market Mechanics: Pricing, Logistics, and Competitive Dynamics
The petroleum markets pricing Venezuelan crude provides crucial context. Venezuelan grades trade on a netback basis from Gulf Coast values, with adjustments for quality differentials, freight costs, and risk premiums. Historically, Merey crude traded at discounts of $8-15 per barrel versus West Texas Intermediate benchmark, reflecting its inferior quality and higher processing costs.
Under the new arrangement with U.S. government oversight, several factors should theoretically compress discounts. First, removal of sanctions risk reduces the premium required to compensate buyers for regulatory exposure. Second, official sales channels eliminate the opacity and logistical complications associated with shadow fleet operations. Third, greater volume certainty allows refiners to optimize processing schedules rather than treating Venezuelan crude as opportunistic.
However, Venezuelan crude must still compete with established alternatives. Western Canadian Select typically trades at $15-20 discounts to WTI. Mexican Maya, another heavy sour grade, trades at $3-6 discounts. Middle Eastern grades like Arab Heavy and Basrah Heavy carry their own pricing dynamics based on quality and freight economics.
The logistics dimension proves equally complex. Venezuela’s export infrastructure has deteriorated alongside production capacity. Loading terminals at Jose and Bajo Grande have experienced periodic outages. VLCC (Very Large Crude Carrier) availability fluctuates based on insurance market willingness to cover Venezuelan waters. Blending requirements—mixing extra-heavy crude with diluents to achieve transportable viscosity—add operational complexity and cost.
For Trafigura and Vitol, success requires optimizing each dimension: sourcing crude at competitive prices, securing appropriate tonnage, blending to meet refinery specifications, timing deliveries to match refinery turnaround schedules, and managing counterparty credit risk. These trading houses excel precisely because they’ve built systems to coordinate these moving parts across global supply chains.
Refinery Sector Response: Cautious Interest, Conditional Commitment
Gulf Coast refinery executives express measured enthusiasm tempered by pragmatic concerns. Conversations with industry sources reveal a consistent pattern: interest in Venezuelan crude availability exists, but commitment requires clarity on volume reliability, price competitiveness, and regulatory stability.
Valero Energy, one of the Gulf Coast’s largest independent refiners with significant heavy crude coking capacity, has historical experience processing Venezuelan grades. The company’s complex refineries in Texas and Louisiana could theoretically absorb substantial volumes. Similarly, Marathon Petroleum, Phillips 66, and PBF Energy—all identified by Bloomberg as having advantaged positions—have begun preliminary discussions with traders.
The private calculus involves margin analysis. Refiners model crack spreads—the difference between crude acquisition costs and refined product revenue—under various scenarios. Venezuelan crude must offer sufficient discounts to justify the operational adjustments required to process it relative to current feedstock slates.
One refinery consultant suggested that processing Venezuelan heavy sour could improve margins by more than $1 per barrel for optimally configured facilities—a meaningful improvement in an industry where quarterly earnings often hinge on single-digit margin shifts. However, realizing those economics requires locking in regular supplies and completing equipment modifications.
The other consideration involves alternative destinations. If Venezuelan crude doesn’t offer competitive economics to Gulf Coast refiners, it could flow to Indian or Spanish facilities—both have historical experience with Venezuelan grades and could potentially absorb volumes. This global optionality constrains how aggressively refiners can negotiate, as traders maintain leverage through alternative placement channels.
Forward-Looking Scenarios: Mapping Possible Trajectories
Projecting Venezuelan oil’s trajectory requires scenario planning across multiple dimensions. Consider three plausible pathways:
Scenario One: Controlled Ramp (Most Probable) Venezuelan crude exports to U.S. Gulf Coast increase gradually to 300,000-400,000 bpd by end-2026, facilitated by licensed traders under government oversight. Production reaches 1.2 million bpd through operational optimization without major capital deployment. Revenues flow through supervised channels, with incremental stability allowing limited foreign investment. This scenario implies modest pressure on Canadian heavy crude pricing, marginal tightening of heavy-light differentials, and sustainable if unspectacular commercial returns for trading houses.
Scenario Two: Accelerated Recovery (Optimistic) Political consolidation and institutional reform unlock significant foreign investment. Production accelerates toward 1.7-1.8 million bpd by 2028 as upgraded infrastructure comes online. U.S. and international oil companies commit tens of billions in upstream capital, viewing Venezuelan reserves as strategic long-term assets. In this pathway, Venezuelan crude becomes a major factor in Atlantic Basin markets, materially impacting WCS pricing and potentially displacing Middle Eastern imports. However, this scenario requires sustained political stability—historically elusive in Venezuela.
Scenario Three: Partial Reversal (Bearish) Operational challenges, infrastructure failures, or political instability constrain production recovery. Volumes remain below 1 million bpd despite initial optimism. Sanctions enforcement against non-licensed actors proves inconsistent, allowing shadow fleet operations to continue. Limited revenue transparency and governance failures deter major investment. In this scenario, Venezuelan crude remains a niche supply source rather than transformative market factor, with Trafigura and Vitol managing modest volumes under challenging conditions.
The probability-weighted outcome likely falls between scenarios one and three—meaningful but constrained growth, subject to political volatility and infrastructure limitations that prevent full potential realization.
The Institutional Question: Can PDVSA Be Reformed?
Perhaps the most fundamental uncertainty involves Petróleos de Venezuela (PDVSA) itself. The state oil company, once among Latin America’s premier petroleum enterprises, has become synonymous with mismanagement, corruption, and operational dysfunction.
PDVSA’s decline predates sanctions, as noted by Carole Nakhle, CEO of Crystol Energy: “The collapse predates sanctions. Chronic mismanagement, politicization and underinvestment weakened the industry long before restrictions were imposed.” Sanctions accelerated deterioration but didn’t originate it.
Restructuring PDVSA would require addressing systemic issues: depoliticizing hiring and operations, implementing transparent financial reporting, establishing commercial rather than political decision-making processes, and potentially restructuring approximately $190 billion in outstanding debt obligations owed to creditors including China, Russia, and bondholders.
Without comprehensive institutional reform, foreign companies remain reluctant to commit capital. Joint ventures and service contracts require enforceable legal frameworks and predictable fiscal terms—precisely what Venezuela has lacked for two decades. Some analysts suggest that meaningful recovery might require PDVSA’s effective dismantling and reconstruction from first principles—a politically fraught proposition that successive governments have proven unwilling to undertake.
Broader Implications: Lessons for Energy Geopolitics
This Venezuelan oil saga offers several insights applicable beyond the immediate case:
First, sanctions prove most effective when they change incentive structures rather than simply imposing costs. The current approach—using licensed trading as a control mechanism—represents an evolution from blanket prohibition toward calibrated engagement. Whether this proves more effective at achieving policy objectives remains to be seen.
Second, commodity trading houses occupy a unique position in global energy systems. Their expertise in logistics, risk management, and market arbitrage makes them valuable intermediaries when geopolitical objectives intersect with commercial imperatives. Trafigura and Vitol aren’t merely profit-seekers; they’re providing functionality that governments and national oil companies cannot easily replicate.
Third, infrastructure constraints impose real limits on geopolitical flexibility. Regardless of political developments, Venezuelan production cannot snap back quickly. The physical reality of deteriorated wells, corroded pipelines, and idled upgraders defines what’s possible over relevant timeframes.
Fourth, global oil markets have evolved toward abundance, reducing the strategic leverage that petroleum once provided. With U.S. shale production, Canadian oil sands, Brazilian deepwater, and Guyana offshore fields all contributing supply, Venezuelan barrels matter less than they did when the country produced 3.5 million bpd. This reduces the urgency from both commercial and geopolitical perspectives.
Conclusion: Pragmatism Ascendant, With Caveats
Trafigura’s preparation to load Venezuelan crude represents pragmatism superseding ideology in energy policy—at least provisionally. The arrangement acknowledges that Gulf Coast refiners can utilize Venezuelan heavy crude efficiently, that managed engagement might generate better outcomes than isolation, and that commodity trading expertise can facilitate complex transactions that governments struggle to execute directly.
Yet pragmatism operates within constraints. Infrastructure realities limit how quickly production can recover. Political uncertainties create investment hesitancy. Institutional dysfunction at PDVSA poses ongoing operational challenges. Global supply abundance reduces commercial urgency. These factors collectively suggest that Venezuelan crude will return to international markets, but gradually and conditionally rather than transformatively.
For market observers, several variables warrant monitoring: actual loading volumes versus projections, refinery uptake rates and processing economics, OFAC enforcement consistency against unauthorized actors, and infrastructure investment commitments from international oil companies. These indicators will reveal whether this Venezuelan engagement represents substantive change or merely incremental adjustment at the margins.
The intersection of energy markets and geopolitics rarely produces clean narratives. What unfolds in Venezuela over coming months will test whether commercial incentives can overcome institutional dysfunction, whether controlled engagement proves more effective than isolation, and whether pragmatism in energy policy can be sustained amid inevitable political turbulence.
For now, Trafigura prepares to load crude. Refiners evaluate economics. Policymakers calibrate oversight mechanisms. And the fundamental tension persists: between Venezuela’s immense petroleum potential and its demonstrated inability to realize it. That tension—not any single shipment—defines the Venezuelan oil story. Everything else is execution detail.
The author analyzes commodity markets and energy geopolitics with expertise in petroleum economics, sanctions policy, and hemispheric trade dynamics. Views expressed represent independent analysis informed by premium sources and industry consultation.
Discover more from The Economy
Subscribe to get the latest posts sent to your email.


China’s export controls on rare earths, tungsten, and silver are tightening fast in 2026 — but the Iran war and Hormuz chaos are already denting Beijing’s export engine. A deep analysis.
Picture the view from the Yangshan Deep-Water Port on a clear March morning: cranes moving in hypnotic rhythm, container ships stacked eight stories high, the smell of diesel and ambition mingling in the salt air. Shanghai, the world’s busiest port, has long been a monument to China’s export supremacy. Now picture, simultaneously, the Strait of Hormuz some 5,000 kilometres to the west — tankers at anchor, shipping lanes in disarray, insurance premiums spiking by the hour after a war nobody fully predicted has turned one of the world’s most critical energy arteries into a geopolitical chokepoint.
These two scenes, unfolding in real time, define the central paradox of Chinese trade power in 2026. Beijing is weaponising export controls more aggressively than at any point in its modern economic history — tightening its grip on rare earths, tungsten, antimony, and silver with the confidence of a player who believes it holds all the cards. Yet the very global instability it once navigated with deftness is now biting back, slowing China’s export engine at precisely the moment when export-led growth is not a preference but a lifeline. The March customs data, released today, made that contradiction impossible to ignore.
Why China’s Export Controls Are Soaring in 2026
To understand Beijing’s export-control blitz, you have to understand its logic: supply-chain chokepoints are the new artillery. China does not need aircraft carriers to coerce its rivals when it controls roughly 80% of global tungsten production, dominates rare earth refining at a rate that makes Western alternatives fanciful for years to come, and now holds the licensing key for silver — a metal the United States only formally designated as a “critical mineral” in November 2025.
The architecture assembled by China’s Ministry of Commerce (MOFCOM) since 2023 has grown into something qualitatively different from its earlier, blunter instruments. MOFCOM’s December 2025 notification established state-controlled whitelists for tungsten, antimony, and silver exports covering 2026 and 2027: just 15 companies approved for tungsten, 11 for antimony, and 44 for silver. The designation is the most restrictive tier in China’s export-control hierarchy. Companies are selected first; export volumes managed second. Unlike rare earths — still governed by case-by-case licensing — these three metals now flow through a fixed exporter system that operates, in effect, as a state faucet. Beijing can tighten or loosen at will.
The EU Chamber of Commerce in China captured the alarm among multinationals: a flash survey of members in November found that a majority of respondents had been or expected to be affected by China’s expanding controls. Silver’s elevation to strategic material status — placing it on the same regulatory footing as rare earths — was particularly striking. Its uses span electronics, solar cells, and defense systems. Every one of those sectors is a pressure point in the U.S.-China technological rivalry.
The Rare Earth Détente Is More Theatrical Than Real
On the surface, October 2025 looked like a moment of diplomatic breakthrough. Following the Xi-Trump summit, China announced the suspension of its sweeping new rare-earth export controls — specifically, MOFCOM Announcements No. 70 and No. 72 — pausing both the October rare-earth restrictions and U.S.-specific dual-use licensing requirements until November 2026. Trump declared it a victory. Markets exhaled.
But look beneath the headline and the architecture is entirely intact. China’s addition of seven medium- and heavy-rare-earth elements — samarium, gadolinium, terbium, dysprosium, lutetium, scandium, and yttrium — to its Dual-Use Items Control List under Announcement 18 (2025) was never suspended. Neither were the earlier 2025 controls on tungsten, tellurium, bismuth, molybdenum, and indium. Most consequentially, the extraterritorial provisions — the so-called “50% rule,” which requires export licenses for products made outside China if they contain Chinese-origin materials or were produced using Chinese technologies — remain a live wire running through global semiconductor and battery supply chains.
The pause, in short, is not a retreat. It is a recalibration, a strategic exhale before the next tightening cycle. As legal analysts at Clark Hill put it plainly: expect regulatory tightening to return in late 2026 if bilateral conditions deteriorate. Beijing has merely exchanged a sprinting pace for a walking one, keeping its destination unchanged.
The Middle East Wild Card Crushing China’s Export Momentum
Then came February 28, 2026, and everything changed.
U.S. and Israeli strikes on Iran triggered a war that rapidly scrambled the assumptions underpinning China’s export-led growth model. The Strait of Hormuz — through which roughly 20% of global oil trade and a comparable share of LNG normally transits — effectively seized up. Commercial tankers chose not to risk passage. Before the war, China received approximately 5.35 million barrels of oil per day via the Strait of Hormuz. That figure collapsed to around 1.22 million barrels, coming exclusively from Iranian tankers — a reduction of nearly 77%.
For a country in which, as Henry Tugendhat of the Washington Institute for Near East Policy notes, “Hormuz remains China’s main concern, because about 45% of its oil imports pass through it,” this was not an abstraction. It was an immediate, visceral shock to the manufacturing cost base. Chinese refineries began reducing operating rates or accelerating maintenance schedules to avoid buying expensive crude. Energy-intensive sectors — steel, petrochemicals, cement — felt it first. But the ripple spread fast into the broader export machine.
The March customs data, released this morning, confirmed what economists had been dreading. China’s export growth slowed to just 2.5% year-on-year in March — a five-month low, and a stunning collapse from the 21.8% surge recorded in January and February. Analysts polled by Reuters had forecast growth of 8.3%. The actual print was less than a third of that. Outbound shipments, which just eight weeks ago were on pace to eclipse last year’s record $1.2 trillion trade surplus, stumbled badly in the first full month of the Iran war.
Rare Earths, Tungsten, and the New Geopolitical Chessboard
The cruel irony of China’s position in 2026 is not lost on Beijing’s economic planners. The country has spent the better part of three years engineering the most sophisticated export-control system in its history, designed to maximise geopolitical leverage while maintaining the appearance of regulatory normalcy. And yet the very global disorder that its strategists once viewed as fertile ground for expanding influence — American overreach, Middle East fragility, European energy dependence — is now delivering body blows to the export revenues that fuel the domestic economy.
Consider the arithmetic. Tungsten exports fell 13.75% year-on-year in the first nine months of 2025, even before the new whitelist took effect. That decline predated the Iran war’s disruptions; it reflected global demand softness and supply-chain reconfiguration by Western buyers accelerating their diversification efforts. Now, with input price inflation for Chinese manufacturers surging to its highest level since March 2022 — and output price inflation hitting a four-year peak, according to the RatingDog/S&P Global PMI — the cost pressure is compounding.
The official manufacturing PMI rebounded to 50.4 in March from 49.0 in February, the strongest reading in twelve months, which offered some comfort. But the private-sector RatingDog PMI told a more honest story: it fell to 50.8 from a five-year high of 52.1 in February. The new export orders sub-index — the most forward-looking indicator of actual foreign demand — remained in contraction at 49.1. The headline may read expansion, but the pipeline is thinning.
How the Iran War Is Rewiring China’s Export Map
The geographic breakdown of March’s trade data illuminates the structural shifts now underway. China’s exports to the United States plunged 26.5% year-on-year in March, a widening from the 11% drop recorded in January and February — a deterioration driven by Trump’s elevated tariffs, which have progressively choked off one of China’s most lucrative markets. EU-bound shipments rose 8.6% and Southeast Asian exports climbed 6.9%, reflecting Beijing’s deliberate pivot toward trade diversification as Washington weaponises its own levers.
But the Middle East — once a growing destination for Chinese machinery, electronics, and manufactured goods — is now a graveyard of cancelled orders. As the Asian Development Bank and TIME have documented, Middle East buyers have abruptly halted purchases amid maritime uncertainty. Jebel Ali Port in Dubai, one of the world’s busiest container terminals, suspended operations following drone strikes, according to the Financial Times. Thai rice, Indian agricultural goods, and Chinese consumer electronics are all sitting in holding patterns at Asian ports, waiting for a maritime corridor that no longer reliably exists.
For Chinese exporters, the calculus has turned grim in ways that few were modelling at the start of 2026. Freight forwarders warned in early March of extended transit times, irregular schedules, and significant rate increases as carriers suspended Middle East operations. Shipping insurance premiums have spiked to levels not seen since the peak of the Red Sea crisis. “China’s exports have decelerated as the Iran war starts to affect global demand and supply chains,” said Gary Ng, senior Asia Pacific economist at Natixis. Bank of America economists led by Helen Qiao have similarly warned that the risks will “arise from a persistent global slowdown in overall demand if the conflict lasts longer than currently expected.”
Beijing’s Growth Target and the Export Dependency Trap
Against this backdrop, China’s leaders have set a 2026 growth target of 4.5% to 5% — the lowest since 1991. That target was already cautious before February 28. Now it carries an asterisk the size of the Hormuz strait.
The underlying problem is structural, and the Iran war has merely accelerated its visibility. China’s domestic consumption engine remains badly misfiring. A years-long property sector slump has wiped out household wealth, dampened consumer confidence, and created the deflationary undertow that has haunted Chinese factory margins for much of the past two years. Exports were never merely a growth strategy; they became a substitute for the domestic demand rebalancing that successive Five-Year Plans promised but never delivered at scale.
The 15th Five-Year Plan (2026-2030), formalised at the National People’s Congress in March, commits again to shifting the growth engine toward domestic consumption. But rebalancing is a decade-long project at minimum, and as Dan Wang of Eurasia Group observed acutely, “exports and PMI may face risks in the second half of the year, as the Iranian issue could lead to a recession in major economies, especially the EU, which is China’s most important trading destination.”
That is the existential tension at the heart of Beijing’s 2026 economic calendar: the export controls project Chinese strength, but the export slowdown reveals Chinese fragility. The two narratives are not separate stories — they are the same story, told from opposite ends of the supply chain.
What This Means for Global Supply Chains and Western Strategy
For Western governments and businesses, the lessons of the first four months of 2026 are stark and should concentrate minds.
First, the “pause” in China’s rare-earth controls should not be mistaken for a strategic retreat. Diversification timelines for rare earth processing remain measured in years, not quarters. Australia’s Lynas Rare Earths, the largest producer of separated rare earths outside China, still sends oxides to China for refining. Australia is not expected to achieve full refining independence until well beyond 2026. The whitelist architecture for tungsten, antimony, and silver means that even if rare-earth licensing eases temporarily, the mineral chokepoints are multiplying rather than narrowing.
Second, the 45-day license review window for controlled materials is itself a weapon of strategic delay. As one analyst put it dryly: “delay is the new denial.” A manufacturer in Germany or Japan requiring controlled tungsten for defence production cannot absorb a 45-day uncertainty in its supply chain indefinitely. The bureaucratic friction is by design.
Third, China’s pivot to Europe and Southeast Asia as export markets — while strategically sound as a hedge against U.S. tariff pressure — is directly threatened by the Iran war’s energy shock. The ING macro team’s analysis is unsparing: if higher energy prices and shipping disruptions persist or worsen, pressure will build materially in the months ahead.
For Western policymakers, the playbook should be clear even if execution remains painful. The U.S. Project Vault — a $12 billion strategic critical minerals reserve backed by Export-Import Bank financing — is a necessary if belated step. A formal “critical minerals club” among allies, which the U.S. Trade Representative floated for public comment in early 2026, would accelerate diversification by pooling demand signals and investment capital across democratic market economies. Europe needs to move faster on processing capacity: consuming 40% of the world’s critical minerals while refining almost none of them is a strategic liability that no amount of diplomatic finesse can paper over.
For businesses, the message is harsher: any supply chain that remains single-source dependent on China for controlled materials in 2026 is operating on borrowed time and borrowed luck. “Diversification is no longer optional,” as one industry analyst noted simply. “Delay is the new denial.”
What Happens Next: The 2026–2027 Outlook
The trajectory for the remainder of 2026 hinges on two variables: how quickly the Iran war de-escalates (or doesn’t), and whether the U.S.-China diplomatic channel holds open enough to prevent the re-imposition of the suspended export controls.
On the first variable, Trump’s planned May visit to Beijing — already delayed once by the war — will be the most closely watched diplomatic event of the year. The meeting carries enormous stakes: a visible détente could stabilise the trade outlook for H2 2026, rebuild business confidence, and give China the export recovery that its growth target demands. A collapse in negotiations, or a military escalation in the Gulf that outlasts Beijing’s ability to manage its energy shock, could push China’s growth below the 4.5% floor in ways that create serious domestic political pressure.
On the second, MOFCOM Announcement 70’s suspension expires in November 2026. If the bilateral atmosphere deteriorates — and there are many ways it could, from Taiwan tensions to semiconductor export controls to Beijing’s domestic AI chip ban — the rare-earth controls will return, and likely in a more comprehensive form than before. Companies that used the pause to secure long-term general licenses and diversify supply are buying genuine resilience. Those who treated the pause as a return to normalcy are setting themselves up for a very difficult winter.
The deeper truth is that China’s export-control strategy and the Middle East disruption are not simply colliding forces — they are revealing the same underlying fact: the globalisation that Beijing and Washington both profited from for forty years is over. What has replaced it is a managed fragmentation, in which every mineral shipment, every shipping lane, and every license review is a move in a game with no agreed rules and no obvious endgame.
Standing in Yangshan port and watching the cranes, one is tempted to conclude that China still holds structural advantages that no single war or tariff can dissolve. Its dominance in green technology manufacturing — solar panels, batteries, electric vehicles — means that even an energy shock may paradoxically accelerate global demand for Chinese renewables. The inquiries from European, Indian, and East African buyers for Chinese solar and battery products have, by multiple accounts, increased since the Hormuz crisis began. China’s industrial policy may be generating the very demand for its products that punitive Western tariffs were meant to suppress.
But a 2.5% export growth print in March, when 21.8% was recorded just eight weeks earlier, is not a blip. It is a warning shot. Beijing is learning, in real time, that the architecture of trade coercion it has spent years constructing is most powerful when global commerce flows smoothly — and most exposed when it doesn’t. The Middle East has handed China a mirror, and the reflection is more complicated than Beijing’s trade strategists expected.
Policy Recommendations
For Western Governments:
- Accelerate critical mineral processing capacity at home and among allies, with binding investment timelines, not aspirational targets
- Formalise a “critical minerals club” with democratic partners, pooling demand guarantees and political risk insurance for new refining projects
- Extend strategic mineral stockpiles to cover at minimum 180-day supply disruption scenarios, spanning not just rare earths but tungsten, antimony, and silver
- Develop coordinated shipping insurance backstops for Gulf routes, to prevent maritime insurance crises from becoming de facto trade embargoes against friendly nations
For Businesses:
- Map your top-tier supplier exposure to China’s whitelist-controlled materials now, not after the next licensing shock
- Secure general-purpose export licenses during the current MOFCOM suspension window — it closes in November 2026
- Build geographic diversification into sourcing: Australia, Canada, South Africa, and Kazakhstan all offer partial alternatives for minerals currently dominated by Chinese supply
- Model your supply chain for a scenario in which MOFCOM controls return at full strength in December 2026 — because that scenario has a realistic probability
The cranes at Yangshan will keep moving. But the world they are loading containers for is no longer the one that made them so indispensable in the first place.
Discover more from The Economy
Subscribe to get the latest posts sent to your email.
The Johor-Singapore SEZ master plan is reshaping Southeast Asia’s tech map. Data centres, semiconductors, and the RTS Link are turning the JS-SEZ into 2026’s most compelling investment corridor.
There is a phrase that tends to get recycled at investment forums across Southeast Asia — the promise of a “win-win.” It rolls easily off the tongue and means almost nothing. So when Vinothan Tulisi, director of the Malaysian Investment Development Authority’s Singapore office, stood before a room of business leaders on April 13 and said, “We are not talking about a zero-sum game here,” you might have expected the usual polite scepticism. You would have been wrong.
The context was a dialogue jointly organised by the Singapore Press Club and the Johor Economic, Tourism and Cultural Office (Jetco) Singapore — a gathering convened to discuss the Johor-Singapore Special Economic Zone, or JS-SEZ. The topic was not just another bilateral handshake. The master plan for one of Asia’s most ambitious cross-border economic corridors is nearing public release, and the sectors generating the most heat — data centres and semiconductors — happen to be the same industries that geopolitics is frantically rewiring around the world.
This, as the bankers like to say, is not a coincidence.
What the JS-SEZ Master Plan Actually Says
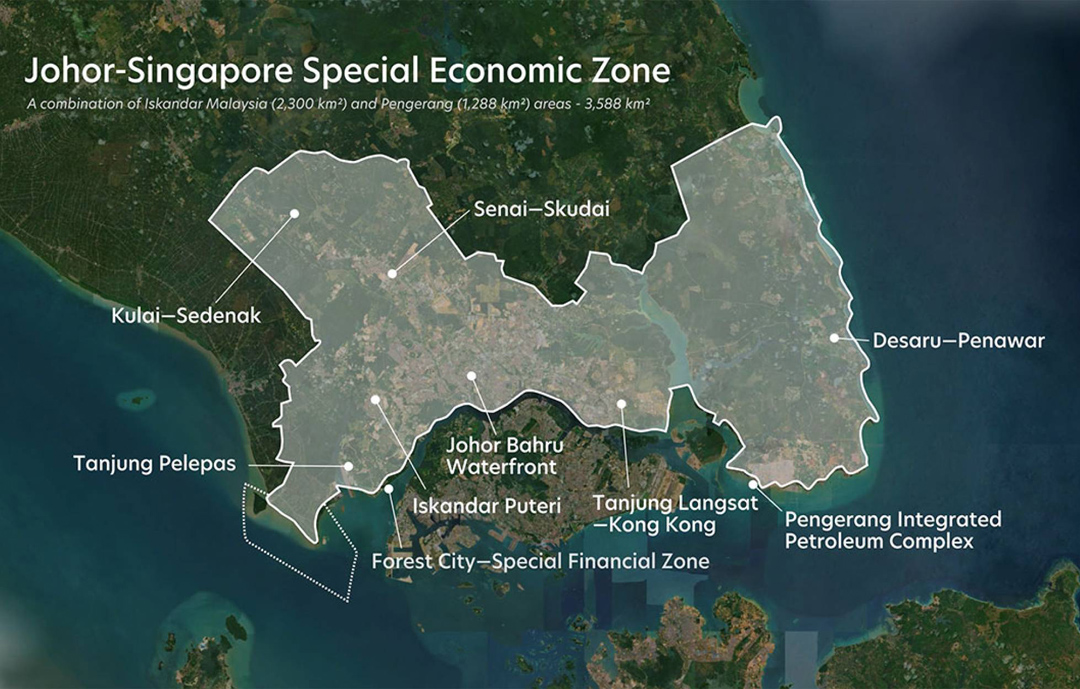
The JS-SEZ was formally signed on January 7, 2025, a bilateral agreement between Malaysia and Singapore to weave the southern Malaysian state of Johor into a seamless economic corridor with the city-state. The zone spans approximately 3,571 square kilometres — nearly five times the land area of Singapore itself — and targets accelerated growth across 11 key sectors, from advanced manufacturing and digital economy to logistics, green energy, and financial services.
The investment blueprint was launched on March 30, 2026 in Johor Bahru, the culmination of months of planning by Malaysia’s Ministry of Economy under Economy Minister Akmal Nasrullah Mohd Nasir. A more detailed master plan — the operational roadmap for all implementing parties — follows in parallel. The launch was originally scheduled for earlier in March, and the brief delay only sharpened the anticipation from investors watching closely from Hong Kong, Tokyo, Riyadh, and Silicon Valley.
The incentive architecture is striking. Companies qualifying under the JS-SEZ framework are eligible for a 5% corporate tax rate for up to 15 years in priority sectors including semiconductors, AI, medical devices, and advanced manufacturing. Knowledge workers who relocate to operate within the zone receive a 15% flat personal income tax rate for up to a decade — a figure designed explicitly to attract the Malaysian diaspora home from Singapore and to tempt expatriates who have long treated Johor as a dormitory suburb rather than a destination.
The application window runs until December 31, 2034. There is, in other words, real urgency to move.
Data Centres: The Sector That Started the Stampede
If any single industry has defined Johor’s transformation story over the past three years, it is data centres. As of late 2024, Johor hosts over 50 data centres, making it one of the largest concentrated hubs of digital infrastructure in all of Southeast Asia. Microsoft, Equinix, Princeton Digital Group, GDS International, ByteDance — these are not names that make speculative bets.
The arithmetic is straightforward. Singapore is land-constrained and power-hungry; data centre developers have been bumping against capacity ceilings in the city-state for years. Johor offers exactly what Singapore cannot: land priced at a fraction of Singapore’s rates, expanding power infrastructure, sufficient water resources, and — critically — fibre connectivity and proximity to Singapore’s subsea cable ecosystem. Rangu Salgame, CEO of Princeton Digital Group, captured the mood precisely when he told Fortune: “Johor is adding data centre capacity at a speed and scale I’ve not seen ever anywhere else.”
The JS-SEZ framework formalises and supercharges this dynamic. Under the bilateral agreement, companies can pursue what has been termed a “twinning” or “plus-one” strategy — maintaining high-value functions, client relationships, and financial operations in Singapore while building out the compute-heavy, land-intensive infrastructure in Johor. The SEZ makes that split operationally seamless in ways that previously required considerable regulatory navigation.
There are, however, friction points that the master plan must address candidly. In late 2025, Johor state authorities issued a temporary moratorium on new approvals for water-cooled data centres to protect local water supplies — a sensible constraint that nonetheless rattled investors who had been pencilling in aggressive build schedules. The pause is forcing a necessary technological pivot toward air-cooling and closed-loop liquid-cooling systems, aligning the region’s data infrastructure more closely with ESG requirements that institutional capital increasingly demands. It is a short-term headache that, managed well, could produce a greener, more sustainable data corridor than would otherwise have emerged.
Power grid strain is a related concern. Malaysia’s National Energy Transition Roadmap is integrating renewable energy commitments into the JS-SEZ framework, but AI-driven data centres are pushing global power demand up by roughly 20% annually, and Johor’s grid needs to keep pace. Early movers who lock in power capacity reservations now will be significantly advantaged.
Semiconductors: The Geopolitical Play
Here is where the JS-SEZ story gets genuinely interesting — and where the master plan’s strategic intelligence will be judged by history.
The global semiconductor supply chain is fracturing. What analysts at The Edge Malaysia have called the bifurcation into “Blue Silicon” and “Red Silicon” — a US-aligned and China-aligned chip world — is creating acute pressure on every country that has built its economic model on neutral, export-driven chip manufacturing. Malaysia currently handles approximately 13% of global chip assembly, testing, and packaging. Its semiconductor exports have surged — rising nearly 20% year-on-year between January 2025 and January 2026, with integrated circuits comprising 32% of total export value. That is both an extraordinary achievement and a vulnerability.
Prime Minister Anwar Ibrahim has framed Malaysia’s strategic position explicitly: the country offers a “neutral and non-aligned location” for companies that need to manufacture chips without being conscripted into one geopolitical bloc or another. Malaysia’s National Semiconductor Strategy targets a cumulative investment of RM500 billion (approximately US$118 billion), with RM25 billion in public support phased across multiple stages. By early 2025, more than RM63 billion in private investment had already been secured.
The JS-SEZ turbocharges this ambition by placing Johor — with its land, its lower-cost labour pool, and its direct connection to Singapore’s engineering talent and financial capital — at the centre of a cross-border semiconductor corridor. The zone’s cleanroom-ready industrial parks, including the 745-acre Sedenak Tech Park and the 509-acre Nusajaya Tech Park, are designed to support exactly the kind of controlled-environment manufacturing that chip assembly and advanced electronics require.
The risk, as several analysts have noted with considerable candour, is that Malaysia cannot simultaneously court US hyperscalers and deepen ties with Chinese chip firms without eventually being forced to choose. Washington’s scrutiny of technology transfer flows through ASEAN is intensifying. Johor’s data centre build-out has already attracted both American giants (Microsoft, Equinix) and Chinese players (ByteDance, GDS), operating in the same geography under what is currently a comfortable ambiguity. Whether that ambiguity remains comfortable through the remainder of this decade is, frankly, the most important geopolitical question the JS-SEZ master plan does not yet fully answer.
The RTS Link: Infrastructure as Economic Destiny
No honest account of the JS-SEZ can proceed without addressing the project that binds the entire vision together: the Johor Bahru–Singapore Rapid Transit System Link.
The RTS Link is a 4-kilometre rail shuttle connecting Bukit Chagar station in Johor Bahru with Woodlands North station in Singapore, with a journey time of approximately five minutes. By April 2026, the project has surged past 90% completion, with passenger operations targeted to commence by end-2026 and full launch by January 2027. The first driverless train arrived in Woodlands for demonstration on February 4, 2026, and the Land Transport Authority of Singapore has confirmed the project remains on schedule.
The system’s numbers are worth dwelling on. Peak capacity is 10,000 passengers per hour in each direction, with trains running every 3.6 minutes during peak periods. Expected daily ridership upon opening is 40,000 commuters — a figure projected to grow to 140,000 in the long term, absorbing at least 35% of the current human traffic at the Johor–Singapore Causeway, one of the world’s most congested land border crossings. Fares will be set between MYR 15.50 and MYR 21.70, or roughly S$5–S$7 per journey — affordable enough to make daily cross-border commuting a genuine lifestyle option, not an executive perk.
What the RTS Link does, in economic terms, is collapse the psychological distance between two cities that are physically separated by a single strait. Today, the Causeway crossing — jammed with lorries, motorcycles, and commuters — can take anywhere from 30 minutes to several hours. Five minutes changes everything. It allows a Singaporean engineer to live in Johor (where a three-bedroom condominium costs a fraction of its Singapore equivalent), work in a Johor-based manufacturing facility, and still attend a Friday evening client dinner in Singapore’s CBD. It enables a Johor-based SME to pitch investors in Singapore in the morning and be back at the factory floor by afternoon.
This is not theoretical. Singapore-based firms have already committed more than S$5.5 billion (approximately RM19 billion) to the JS-SEZ since the agreement was signed. Johor recorded RM27.4 billion in foreign direct investment in the first quarter of 2025 alone — an astonishing RM24 billion increase compared to the same period in 2024. The RTS Link, when it opens, will accelerate that trajectory further. Logistics operators, talent recruiters, and property developers are already pricing this in.
The Talent Gap: The Problem Nobody Wants to Discuss Loudly
There is a risk embedded in the JS-SEZ’s most optimistic projections that tends to be relegated to footnotes in investor presentations: talent shortages.
A Singapore Business Federation survey found that the majority of Singaporean companies citing difficulties in Johor named manpower challenges as their primary obstacle — specifically, problems with employment pass issuance and sourcing technically skilled workers. Johor’s population of 4.1 million is growing faster than Singapore’s, which is promising for future workforce depth. But the specialised skills required by semiconductor fabs, hyperscale data centres, and AI infrastructure simply cannot be conjured by policy decrees and tax incentives alone.
The Johor Talent Development Council (JTDC) has responded with “train and place” programmes specifically targeting the data centre and semiconductor sectors, aligning university and TVET outputs with investor needs. Malaysia has also launched an ASEAN Framework for Integrated Semiconductor Supply Chain (AFISS) to coordinate regional specialisation, with each member state playing a defined role. These are necessary and welcome initiatives. But the honest timeline for building a deep engineering talent base measured in years and cohorts, not quarters.
The 15% flat personal income tax for knowledge workers is an intelligent piece of the solution — a targeted offer to Singapore-resident Malaysians and regional expatriates to plant roots on the Johor side of the corridor. If the RTS Link makes the commute trivial, and the tax rate makes the economics compelling, the draw of Johor’s dramatically lower cost of living could make the talent equation work faster than sceptics anticipate. The Ibrahim Technopolis (IBTEC), a 7,300-acre innovation sandbox designed to be Asia’s largest, will be critical in anchoring this talent cluster through shared facilities and collaborative infrastructure for SMEs and multinationals alike.
A Complementary Ecosystem, Not a Rival One
The panellists at the April 13 Singapore Press Club dialogue kept returning to a concept that deserves to be the intellectual frame for the entire JS-SEZ project: complementarity. The zone works not because Johor is trying to replicate Singapore — that would be absurd — but because each side brings precisely what the other lacks.
Singapore contributes: world-class financial infrastructure, global legal and regulatory credibility, a deep pool of multinational corporate headquarters, sophisticated logistics operations, and unmatched connectivity to international capital markets. Johor contributes: four times Singapore’s land area, significantly lower operational costs (the median monthly wage in Johor remains roughly one-seventh of Singapore’s), an expanding energy grid, robust water resources, and room for the kind of industrial-scale infrastructure that simply cannot be built in a city-state of 728 square kilometres.
As Knight Frank Malaysia’s executive director Amy Wong Siew Fong observed, this proposition is compelling precisely because “both Malaysia and Singapore governments have demonstrated strong commitment to streamlined governance, transparency and collaboration” — giving investors the institutional confidence that the framework will not unravel under a change of government or a bilateral diplomatic temperature shift.
This bilateral maturity is itself underappreciated. Malaysia–Singapore relations have historically oscillated between warm cooperation and pointed friction over water agreements, airspace, and maritime boundaries. The fact that both governments have committed to a single transshipment permit system for land-based cargo (down from two), are rolling out QR code-based passport-free clearance at land checkpoints, and have jointly legislated the CIQ arrangements for the RTS Link — all signal an institutional seriousness that is genuinely new.
The SiJoRi Region and the Larger Vision
Zoom out far enough, and the JS-SEZ is one piece of a larger mosaic: the SiJoRi region — Singapore, Johor, and Riau Islands — a triangular economic zone that has been a concept since the 1990s but is only now acquiring the infrastructure and policy architecture to function as an integrated unit.
Nomura’s analysts wrote in December 2025 that they expect Malaysia’s economy to grow by 5.2% in 2026, driven in substantial part by JS-SEZ-related investment momentum. Malaysia captured 32% of Southeast Asia’s AI funding in recent years — a remarkable share for a country that the global tech press still largely associates with semiconductor assembly rather than frontier AI infrastructure.
If the master plan executes as designed, if the RTS Link delivers its passenger numbers, if the power grid keeps pace with data centre demand, and if the talent pipeline matures within five years rather than ten — the SiJoRi region has a credible claim to becoming Southeast Asia’s premier AI, semiconductor, and digital infrastructure corridor. Not the only one. Penang, Batam, and the Klang Valley all have serious ambitions. But the combination of bilateral institutional depth, geographic proximity to Singapore, and the sheer concentration of committed capital makes the Johor corridor distinctive.
The Verdict: Masterstroke, With Caveats
The JS-SEZ is not a magic wand. The master plan’s critics — and they are not wrong — point to execution risks that are real and stubborn: talent shortages that take a generation to address, power and water constraints that require infrastructure investment at a pace politics often struggles to sustain, regulatory alignment challenges across two sovereign systems with different legal traditions, and a geopolitical tightrope walk on semiconductors that could become dramatically less comfortable if US export control enforcement sharpens its focus on Malaysia.
But the critics tend to underestimate something equally real: the quality of the bilateral institutional commitment this time around. The RTS Link, nearly complete, is a physical manifestation of political will. The tax framework, legally anchored until 2034, provides the kind of certainty that long-term industrial investment demands. And the timing — with global chip supply chains scrambling for neutral, reliable geography amid the US-China technology cold war — is, for once, genuinely in Malaysia’s favour.
Vinothan Tulisi was right on April 13. This is not a zero-sum game. Done well, the JS-SEZ represents something Southeast Asia rarely produces: a bilateral economic relationship where both partners are structurally stronger together than apart, and where the geopolitical moment is aligned with their comparative advantages rather than working against them.
The master plan is on the table. The train is nearly ready. The capital is circling. What the SiJoRi region does with this convergence of factors — that is the story the next decade will tell.
Discover more from The Economy
Subscribe to get the latest posts sent to your email.
Analysis
Bangladesh’s Bank Resolution Act 2026: Doors Re-Opened for Ex-Owners — Reform Reversal or Pragmatic Bailout?

In April 2026, as Dhaka’s political calendar accelerates toward general elections and the IMF watches every legislative move from Washington, Bangladesh’s newly elected BNP-led parliament has quietly detonated a grenade in the middle of a still-fragile banking reform. The Bank Resolution Act 2026, enacted on Friday, April 11, paves a wide — some would say suspiciously wide — road for former bank owners to reclaim institutions they drove into distress. The question hardening in the minds of depositors, reform economists, and international creditors alike is brutally simple: is this pragmatic crisis management, or the most elegant act of regulatory impunity Bangladesh has ever legislated?
What the Bank Resolution Act 2026 Actually Says — and What It Doesn’t
Let’s start with the architecture of the law, because the devil lives in its fine print.
Under the Bank Resolution Act 2026, former directors or owners of banks that are merging or listed for mergers can pay just 7.5 percent upfront of the amount injected by the government or Bangladesh Bank to reclaim their institutions. The remaining 92.5 percent is repayable within two years at 10 percent simple interest. The Daily Star Before any approval is granted, Bangladesh Bank must conduct due diligence and seek government clearance. Even after approval, the central bank will closely monitor the merged entity for two years, with a special committee reviewing compliance — and failure to meet conditions could lead to cancellation of approval and further regulatory action. The Daily Star
On paper, the safeguards sound serious. In practice, economists who have spent years watching Bangladesh’s banking politics are not reassured. Zahid Hussain, former lead economist at the World Bank’s Dhaka office and a member of the interim government’s banking reform task force, warned that the amendment destroys the credibility of the reform process, saying that “a clear roadmap has been provided for former owners to re-occupy banks that were distressed due to their own mismanagement and the siphoning of funds.” The Business Standard
The numbers Hussain cites are staggering in their implication. He estimated that for the five merged banks, the total required payment would be roughly Tk 35,000 crore — and expressed concern that the terms are so lenient that former owners could easily pay the initial 7.5 percent and borrow the remainder from the banking sector itself. The Business Standard That is not a bailout mechanism. That is a round-trip ticket funded by the very system that was looted.
The Sommilito Islami Bank Merger: A Reform That May Never Have Happened
To understand what is now at stake with the Bank Resolution Act 2026, you must first understand what the 2025 Ordinance was attempting to accomplish — and why it mattered beyond Bangladesh’s borders.
As part of its reform drive, in May 2025, the interim administration had approved the Bank Resolution Ordinance 2025 to merge five troubled Shariah-based private banks into a state-run entity titled Sommilito Islami Bank. The five institutions — First Security Islami Bank, Social Islami Bank, Union Bank, Global Islami Bank, and Exim Bank — had collectively become symbols of politically directed lending and governance failure. The Daily Star
The boards of four of the banks were dominated by the controversial S Alam Group, led by its Chairman Mohammed Saiful Alam, while Exim Bank was long controlled by Nassa Group Chairman Md Nazrul Islam Mazumder. The Daily Star The S Alam Group banks return 2026 scenario — which the new Act explicitly enables — is not abstract; these are the same ownership structures whose related-party lending created the crisis in the first place.
The Shariah banks merger reversal risk is now real enough that even Bangladesh Bank’s own officials are alarmed. Bangladesh Bank officials told The Daily Star that concerns remain over how these banks will be managed if former owners return, whether depositors will be able to recover their money, and that if a bank is returned to its previous owners, it cannot easily be taken back again. “This raises doubts about whether they would be able to run the banks properly and ensure full legal and regulatory compliance,” one official said, adding that the return of previous owners could hinder the ongoing merger process. The Daily Star
That is a central bank quietly sounding an alarm about a law passed by its own government. Read that again.
The Macroeconomic Context: A Sector Already on Life Support
No assessment of the Bank Resolution Act 2026 can be divorced from the catastrophic baseline it is operating against. The World Bank’s Bangladesh Development Update released in 2025 documented a sector in acute distress. Banking sector-wide non-performing loans reached 24.1 percent by March 2025, significantly above the South Asian average of 7.9 percent. The capital-to-risk-weighted asset ratio fell to 6.3 percent, well below the regulatory minimum of 10 percent. World Bank
These are not technical footnotes. A CRAR of 6.3 percent — against a required 10 percent minimum, and a Basel III-compliant effective floor closer to 12.5 percent when capital conservation buffers are included — means Bangladesh’s banking system is operating with a structural capital hole that is visible from space.
The IMF’s 2025 Article IV Consultation, concluded on January 26, 2026, was characteristically blunt. Directors highlighted the urgent need for a credible banking sector reform strategy consistent with international standards to restore banking sector stability. Such a strategy should include estimates of undercapitalization, define fiscal support, and outline legally robust restructuring and resolution plans. They also cautioned against unsecured liquidity injections into weak banks. International Monetary Fund The ink on that consultation was barely dry when parliament passed the Bank Resolution Act 2026 — a law whose principal mechanism is, functionally, a structured return of capital to distressed institutions controlled by their original owners.
The IMF’s language about “prolonged reliance on forbearance measures” was not accidental. Fund staff specifically stated that “any approach to dealing with weak banks should ensure healthy balance sheets, sustained profitability, and adequate liquidity without prolonged reliance on forbearance measures.” International Monetary Fund What the new Act provides — a 7.5 percent entry ticket and 10 percent simple interest on a two-year repayment — is, by any global standard, forbearance in a legislative costume.
The International Standard: What the BRRD, FDIC, and India’s IBC Actually Require
To appreciate why the Bank Resolution Act 2026 troubles international observers, compare it against the frameworks Bangladesh has nominally aligned itself with.
The European Union’s Bank Recovery and Resolution Directive (BRRD) operates on a “no creditor worse off” principle, with resolution authorities empowered to impose losses on shareholders and unsecured creditors before any public money is committed. Critically, the BRRD explicitly prohibits the return of equity to former shareholders whose mismanagement contributed to resolution proceedings. The message is structural: resolution is not a waiting room for rehabilitation. It is a point of no return.
The US Federal Deposit Insurance Corporation (FDIC) model is similarly unambiguous. When an institution enters FDIC resolution, former owners lose their equity entirely. The FDIC then sells assets, transfers deposits, or establishes bridge banks — without reopening a window for the people who broke the bank in the first place. The concept of a former owners Bangladesh Bank Resolution Act mechanism — paying back a fraction upfront and recovering control — would be legally inconceivable under FDIC rules.
India’s Insolvency and Bankruptcy Code (IBC), enacted in 2016, went further: its Section 29A specifically bars promoters who have defaulted from participating in resolution plans for their own companies. After years of politically connected promoters recycling distressed assets back to themselves, India drew an explicit legislative line. Bangladesh, in April 2026, appears to be drawing that line in the opposite direction.
The Chambers and Partners Banking Regulation 2026 Guide for Bangladesh acknowledges that the regulatory agenda of Bangladesh Bank for 2025 and 2026 is “exceptionally dynamic, driven by a national push for enhanced governance, financial sector stability, and compliance with IMF programme conditions.” Chambers and Partners The Bank Resolution Act 2026 as enacted tests whether that dynamism is substantive or cosmetic.
The Government’s Defence: Fiscal Pragmatism or Political Convenience?
Finance Minister Amir Khosru Mahmud Chowdhury presented the Act in parliament as a “market solution” — a phrase that in emerging market contexts tends to arrive dressed as economic logic and leave as political cover. The minister described the government as having already invested approximately Tk 80,000 crore into weak banks and potentially needing another Tk 1 lakh crore — a financial burden he called unsustainable. “This new arrangement places the obligation of recapitalisation and liability settlement on the applicants, reducing the pressure on the government and the Deposit Insurance Fund,” he stated. The Business Standard
This argument has a kernel of validity that cannot be entirely dismissed. A sovereign that has already pumped the equivalent of several GDP percentage points into failing banks and faces the prospect of doubling down — during a period when, as the IMF notes, Bangladesh’s debt service-to-revenue ratio exceeds 100 percent — has a legitimate interest in finding private recapitalization. The question is not whether to seek private capital. It is from whom, and on what terms.
The Act’s critics, including Zahid Hussain, argue the answer currently provided is: the same people who caused the crisis, on terms lenient enough to enable regulatory arbitrage. Hussain warned that the provision undermines past reform efforts, noting: “If, under this law, the previous owners return and reclaim their organisations, the integrity of the new structure created after the merger could be lost. In that case, all merger-related work would effectively become meaningless.” The Daily Star
He is right. And the S&P Global Islamic Banking Outlook 2026 context makes this more acute: Islamic finance institutions globally are under increased scrutiny for governance standards, with rating agencies increasingly marking down Shariah-compliant lenders in frontier markets where board independence and related-party transaction controls are weak. The Som milito Islami Bank ex-owners returning to manage the merged entity would face an uphill battle establishing the governance credibility that international Islamic finance counterparties — Gulf investors, sukuk markets, multilateral development banks — now routinely require.
The Post-Hasina Governance Test: Is Bangladesh Building Institutions or Recycling Networks?
The deepest concern about the Bank Resolution Act 2026 is not technical. It is political economy.
Bangladesh’s post-August 2024 moment — the political transition that followed the uprising ending Sheikh Hasina’s government — was described by reformers and development partners as a generational opportunity to rebuild institutional integrity. Finance Adviser Dr. Salehuddin Ahmed himself described the inherited banking system as one hollowed out by “rampant embezzlement, unchecked corruption, and politically driven loan rescheduling.” BBF Digital
The three-year reform roadmap — backed by the IMF, World Bank, and Asian Development Bank — committed Bangladesh to asset quality reviews, risk-based supervision, the Distressed Asset Management Act, and legally robust restructuring frameworks. The overarching goal was to “ensure banks are financially sound and to end the long-standing practice of granting regulatory forbearance to weaker institutions.” The Daily Star
The Bank Resolution Act 2026 as enacted is not a clean break from that narrative. It is, at minimum, an asterisk — and at worst, a structural loophole that future actors will exploit regardless of what due diligence and monitoring clauses say on paper. Bangladesh Bank officials themselves acknowledge the asymmetry: once a bank is returned to former owners, recovering it is legally and operationally far harder than the two-year monitoring clause implies.
The former owners Bangladesh Bank Resolution Act pathway, combined with the ex-owners reclaim banks Bangladesh mechanism at 7.5 percent upfront, sets a precedent that future distressed bank owners will study carefully. The message it sends to the market — domestic and international — is that Bangladesh Bank resolution is a negotiated exit, not a structural consequence. That signal will outlive any monitoring committee.
What a Credible Reform Would Look Like
This article does not argue for leaving the five merged Shariah banks in permanent regulatory limbo. Merger uncertainty damages depositors. Extended state management creates moral hazard in the other direction. Bangladesh does need a resolution pathway.
But a credible pathway, consistent with the BRRD model and India’s IBC experience, would require: mandatory and independent forensic audits of all related-party transactions before any return of ownership is considered; an open competitive bidding process for new strategic investors — not a preferential window for former owners; full equity writedowns for shareholders whose mismanagement contributed to resolution triggers; enhanced personal liability provisions backed by asset freezes, not merely regulatory monitoring; and independent board composition certified by Bangladesh Bank before any operational handback.
The IMF, in its January 2026 Article IV, called for “swift action to operationalize new legal frameworks that facilitate orderly bank restructuring while safeguarding small depositors” alongside “robust asset quality reviews for all large and systemic banks, bank restructuring aimed at forward-looking viability, strengthened risk-based supervision, and enhanced governance and transparency.” International Monetary Fund The Bank Resolution Act 2026 addresses the first clause and largely bypasses the rest.
The Verdict: Alarming Precedent, Redeemable Only by Enforcement
Bangladesh’s Bank Resolution Act 2026 is not beyond redemption. The due diligence requirement, BB monitoring provisions, and cancellation clauses are meaningful — if enforced with the independence the law’s critics doubt Bangladesh Bank can summon under a newly elected government whose political networks overlap uncomfortably with the very ownership groups seeking re-entry.
The Tk 35,000 crore question is not whether former owners can write the initial cheque. It is whether Bangladesh’s regulatory institutions have the spine to cancel approvals when compliance conditions are not met, to withstand political pressure during the two-year supervision window, and to protect the 17 million depositors whose savings are concentrated in institutions whose balance sheets remain deeply impaired.
For international investors, IMF programme managers, and World Bank country teams watching from Washington and Jakarta, the Bank Resolution Act 2026 is a stress test of post-crisis institutional credibility. Bangladesh passed the legislative test of enacting a resolution framework in 2025. It now faces the harder test: proving that the framework means what it says, even when the politically connected come knocking.
History suggests that in emerging markets, that second test is the one that matters — and the one most frequently failed.
Discover more from The Economy
Subscribe to get the latest posts sent to your email.
-

 Markets & Finance3 months ago
Top 15 Stocks for Investment in 2026 in PSX: Your Complete Guide to Pakistan’s Best Investment Opportunities
-

 Analysis2 months ago
Brazil’s Rare Earth Race: US, EU, and China Compete for Critical Minerals as Tensions Rise
-

 Analysis2 months ago
Top 10 Stocks for Investment in PSX for Quick Returns in 2026
-

 Banks3 months ago
Best Investments in Pakistan 2026: Top 10 Low-Price Shares and Long-Term Picks for the PSX
-

 Investment3 months ago
Top 10 Mutual Fund Managers in Pakistan for Investment in 2026: A Comprehensive Guide for Optimal Returns
-

 Global Economy4 months ago
Pakistan’s Export Goldmine: 10 Game-Changing Markets Where Pakistani Businesses Are Winning Big in 2025
-

 Asia3 months ago
China’s 50% Domestic Equipment Rule: The Semiconductor Mandate Reshaping Global Tech
-

 Global Economy4 months ago
15 Most Lucrative Sectors for Investment in Pakistan: A 2025 Data-Driven Analysis