
Global Economy
The Double-Edged Sword of U.S. Economic Power

The United States has increasingly utilized its economic might as a tool of statecraft in the twenty-first century.
The United States has increasingly utilized its economic might as a tool of statecraft in the twenty-first century. Washington has employed tariffs, sanctions, and military force to influence the actions of its adversaries. Two of the most significant instances of this tactic are the tariffs placed on China during the trade war and the sanctions placed on Russia after it invaded Ukraine.
The goals of both actions were to safeguard American interests and exert influence overseas. However, the ramifications of their actions have been far more intricate than Washington policymakers may have expected. They have expedited the disintegration of the international order, tested relationships, and changed global markets.
In 2022, the United States and its allies imposed an unprecedented set of sanctions in response to Russian tanks rolling into Ukraine. Energy corporations were subject to restrictions, Russian banks were shut out of the global financial system, and the assets of oligarchs were frozen. The objective was clear: to put pressure on President Vladimir Putin to alter the path of the war and to make it harder for Moscow to finance it.
The sanctions have produced a range of economic outcomes. Although Russia’s GDP shrank precipitously in the immediate aftermath, the nation turned out to be more resilient than many had anticipated. Moscow was able to lessen the impact by shifting oil exports to China, India, and other ready consumers.
Despite its volatility, the ruble did not completely collapse. But there is no denying the long-term harm. Russia has been compelled to rely on Beijing, denied access to cutting-edge technology, and shut out of Western financing markets. In order to preserve cash flow, its energy industry, which was formerly the foundation of its worldwide dominance, is now selling at a discount. The largest trading bloc in the world, the Regional Comprehensive Economic Partnership (RCEP), provided China with new ways to counteract American pressure.
However, there have been notable global consequences. Europe’s severe reliance on Russian gas led to an energy crisis and a sharp increase in costs. Developing countries, already struggling with post-pandemic inflation, saw increases in the cost of food and petrol. The world was also affected by sanctions meant to punish Moscow, raising questions about whether the West had underestimated the collateral damage.
Russia’s resolve has been diplomatically reinforced by sanctions. Instead, the Kremlin has stepped up its depiction of Western hostility. For many in the Global South, the sanctions regime has reinforced perceptions of a divided international order, where Western values are selectively implemented.
Tariffs on China were the result of rivalry, whereas sanctions on Russia were the result of conflict. Citing unfair trade practices, intellectual property theft, and a widening trade deficit, Washington levied broad duties on Chinese goods starting in 2018. The purpose of the tariffs was to safeguard American industries and restore economic equilibrium. The immediate result was a dramatic rise in hostilities between the United States and China. Beijing responded by imposing tariffs of its own on American manufacturing and agriculture.
Customers suffered at the checkout counter, supply networks were interrupted, and business expenses increased. Although the tariffs hindered China’s economy, they also encouraged adaptation. By making significant investments in domestic technology and extending commercial relations with ASEAN countries, Beijing strengthened its commitment to independence.
China now has additional ways to counteract pressure from the United States thanks to the Regional Comprehensive Economic Partnership (RCEP), the largest trading grouping in the world. The trade imbalance was not significantly reduced by the tariffs for the US.
Rather, they emphasized how closely the two economies are interdependent. Farmers that depended on Chinese markets suffered from retaliatory actions, while American businesses that relied on Chinese production had to pay more.
Above all, the tariffs possibly sped up the decoupling process. As Beijing and Washington started to reconsider their mutual dependence, global supply chains gradually changed. Reshoring and diversification helped some industries, but overall, the impact was increased costs and more unpredictability.
Both measures disrupted global markets, imposed costs on both allies and adversaries, and produced mixed results in terms of changing behavior. China has not fundamentally changed its industrial policies, and Russia has not withdrawn from Ukraine. Instead, both countries have adapted, finding ways to mitigate the pressure while strengthening ties with alternative partners.
At first glance, tariffs on China and sanctions on Russia may seem like different tools aimed at different problems; one targeted geopolitical aggression, the other economic competition. However, both measures reflect a broader U.S. strategy: using economic leverage to achieve political ends without resorting to military force.
But the distinctions are just as significant. Global manufacturing has changed as a result of tariffs on China, while global energy markets have changed as a result of sanctions on Russia. Tariffs are transactional and competitive, whereas sanctions are punitive and isolating. When taken as a whole, they demonstrate the flexibility—and constraints—of economic pressure.
The indirect effects of U.S. sanctions and tariffs on the global system may be more important than their direct effects on China or Russia. Washington has made it clear that political alignment is required to gain access to its markets and financial networks by weaponizing economic interdependence.
This has caused competitors to look for other options. While China is establishing alternative organizations like the Asian Infrastructure Investment Bank and encouraging the use of the yuan in international trade, Russia is becoming more and more dependent on China. To avoid getting caught in the crossfire of great-power conflict, even allies of the United States are hedging.
As a result, the liberal economic system that the US helped establish is gradually being undermined. We might be heading towards a fractured world of rival blocs rather than a single, cohesive global organization. This results in increased expenses and uncertainty for firms. Governments will have to make more difficult decisions between conflicting areas of power.
The lesson is not that tariffs and sanctions don’t work. They have the power to signal resolve, inflict actual costs, and influence rivals’ calculations. However, they are not panaceas. Economic coercion has the risk of turning into a blunt tool that emboldens adversaries and alienates allies in the absence of diplomacy, coalition building, and long-term planning.
Additionally, Washington needs to understand the boundaries of its power. Although the dollar still holds sway, excessive use of financial sanctions may hasten the development of substitutes. Tariffs might shield some industries, but they can’t undo decades of globalization in a single day.
The United States must ultimately find a balance between engagement and pressure. Instead of being the toolkit itself, sanctions and tariffs ought to be a component of a larger one. If not, the United States runs the risk of eroding the same framework of free markets and partnerships that has long served as the basis for its dominance.
Both the potential and the danger of economic statecraft are demonstrated by the tariffs on China and the sanctions on Russia. They show that without firing a shot, the United States can nevertheless influence world events. However, they also demonstrate that, similar to military might, economic might has unforeseen repercussions.
Washington needs to use its economic powers more accurately, modestly, and strategically if it hopes to survive this new era of great-power competition. Otherwise, America itself could be harmed by the two-edged sword of tariffs and sanctions, not only its enemies.
Discover more from The Economy
Subscribe to get the latest posts sent to your email.


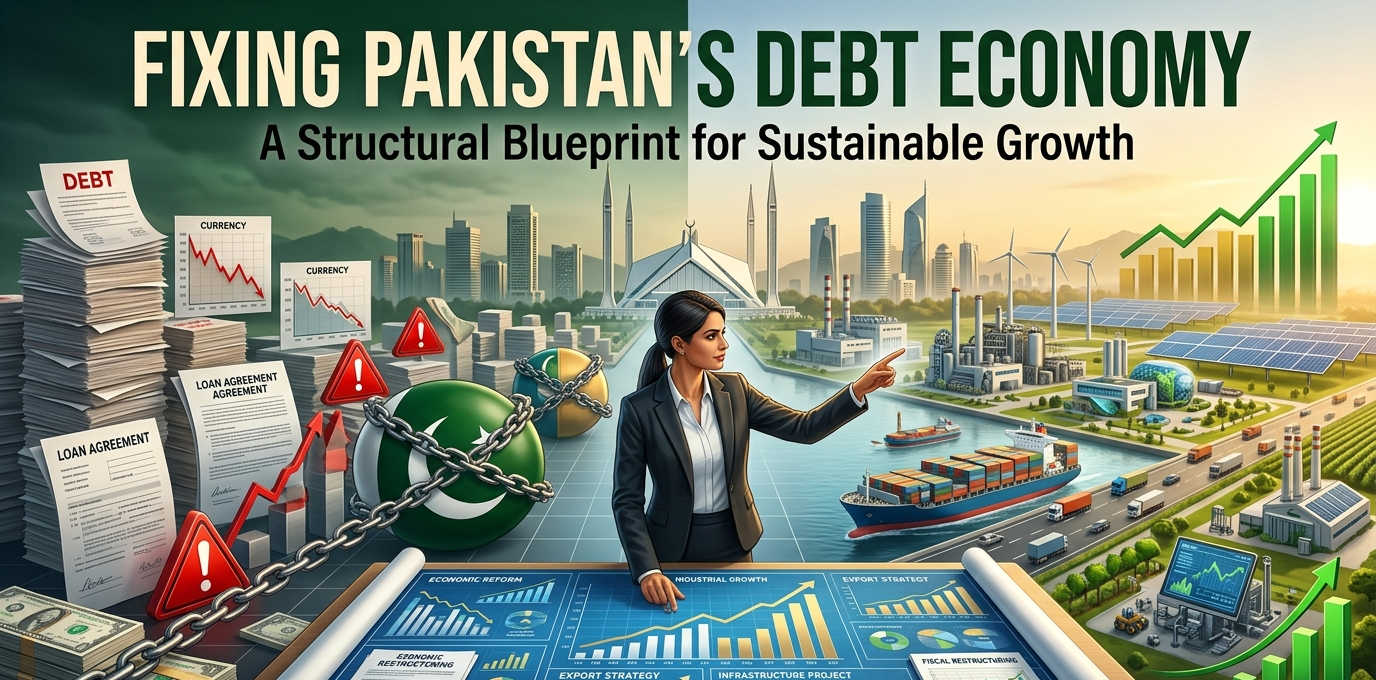
In the fluorescent-lit corridors of the Ministry of Finance in Islamabad, the arithmetic has long stopped making sense. Pakistan spends more than half its federal revenue simply paying interest on past borrowing. The sovereign debt burden now hovers near $280 billion, a millstone that chokes public spending and frightens foreign capital. Policymakers are trapped in a Sisyphean cycle: secure a desperate International Monetary Fund tranche, briefly stabilize foreign exchange reserves, avoid immediate default, and repeat.
Yet the underlying rot remains untouched. Figuring out how to fix Pakistan’s debt economy requires more than frantic diplomacy in Washington or rolling over bilateral loans from Beijing and Riyadh. It demands a violent break from decades of elite capture and fiscal cowardice.
The scale of the sovereign distress is historical. Throughout late 2023 and into 2024, inflation tore through the middle class at a staggering 30 percent, eroding purchasing power and stalling industrial output. According to the World Bank’s economic update, nearly 40 percent of the population now lives below the poverty line, pushing an additional 12.5 million people into economic despair over just three years.
This isn’t merely a liquidity crisis; it is a profound structural failure. The tax net captures only a fraction of the elite, leaving the agrarian and retail sectors largely untaxed while salaried citizens bear the brunt. Simultaneously, the state bleeds capital subsidizing inefficient state-owned enterprises. The International Monetary Fund notes that the country’s tax-to-GDP ratio stubbornly sits around 10 percent, drastically below the regional average necessary to fund a functioning state. Without a violent restructuring of domestic revenue streams and spending habits, external lifelines only delay the inevitable reckoning.
The Core Development: Pluggng the Fiscal Hemorrhage
So, where does the state begin dismantling the mechanisms that have institutionalized this insolvency? The immediate prescription centers on the energy sector’s paralyzing “circular debt.” This is the cascading shortfall of payments across the power supply chain, a figure that recently breached Rs 2.3 trillion ($8.2 billion). Generation companies can’t pay fuel suppliers because distribution companies fail to collect bills or prevent catastrophic line losses.
Fixing this requires politically toxic decisions. Tariffs must reflect the actual cost of generation, but simply hiking prices on a distressed populace is unsustainable. The state must privatize distribution networks. Selling these loss-making entities to private operators with strict regulatory oversight would instantly plug a massive fiscal bleed. Reuters reporting indicates that energy sector subsidies consume nearly a quarter of federal development spending. Cut the subsidy, and the state frees up capital for debt servicing and targeted cash transfers to the genuinely vulnerable.
Then comes the revenue side. The Federal Board of Revenue operates with antiquated technology and an institutional culture that rewards negotiation over enforcement. A complete digitization of the tax machinery is non-negotiable. By linking national identity cards, bank accounts, and property records, the state can map the undeclared wealth of the country’s real estate barons.
There is a human cost to this evasion. In Karachi, former finance minister Miftah Ismail frequently points out that the ruling elite orchestrates tax amnesties that legalize illicit wealth while the urban poor pay heavy indirect taxes on basic food staples. Reversing this means imposing heavy capital gains taxes on unproductive real estate plots and bringing agricultural income into the federal tax net—a move historically blocked by the feudal politicians who dominate the parliament. It will take an executive branch willing to risk its own survival to pass these measures.
The Asian Development Bank estimates that broadening this tax base could yield an additional three percent of GDP in revenue within two fiscal cycles. That margin alone is the difference between chronic begging and financial sovereignty. Still, structural reform is a marathon that Pakistan has historically abandoned after the first mile.
The Reality of IMF Bailout Pakistan Mandates
The global financial architecture views Islamabad with deep exhaustion. Since 1958, Pakistan has entered 23 separate arrangements with the IMF. Almost none were completed without waivers or outright suspensions.
What are the structural reforms needed in Pakistan? The core reforms require dismantling state-owned monopolies, ending untargeted subsidies, taxing agricultural and real estate wealth, and fully privatizing power distribution companies. These steps permanently reduce the fiscal deficit and end the reliance on external debt to fund government operations.
That simple arithmetic conceals a brutal political reality. The state is structurally designed to protect the very sectors it needs to tax. Consider the domestic debt profile. The government borrows heavily from local commercial banks at exorbitant policy rates—often exceeding 20 percent—to fund its deficits. This crowds out the private sector. When commercial banks can generate risk-free, double-digit returns simply by buying government paper, they’ve zero incentive to lend to small and medium enterprises. Industrial growth suffocates.
To break this, the State Bank of Pakistan must enforce a strict separation between fiscal mismanagement and monetary policy. The central bank’s hard-won autonomy is frequently under attack by politicians seeking cheap credit ahead of election cycles. Defending this autonomy is critical to taming inflation.
What follows, however, is the challenge of external debt restructuring. Bilateral debt, particularly the billions owed to Chinese state-affiliated banks for infrastructure projects, must be reprofiled. Extending the maturity of these loans reduces the immediate dollar-drain on the central bank’s reserves. The Financial Times notes that Chinese independent power producers are guaranteed capacity payments in dollars, a contractual trap that drains forex reserves even when the power isn’t used. Renegotiating these contracts isn’t just an economic necessity; it is a matter of sovereign survival. Only by securing breathing room on the external front can the state implement the painful domestic reforms without triggering a total currency collapse.
Downstream Consequences and Sovereign Repositioning
The downstream consequences of this economic overhaul will reshape the country’s social contract. If the government actually executes this fiscal tightening, the immediate future looks bleak for the urban middle class. A reduction in subsidies and an aggressive widening of the tax net will crush disposable income in the short term. Consumer spending will contract. Retail, automotive, and fast-moving consumer goods sectors will report steep earnings drops.
Yet, this pain is the price of admission to a functioning economy. As the fiscal deficit shrinks, inflation will organically cool. A stable currency, no longer propped up by borrowed dollars or administrative controls, will allow the central bank to gradually lower interest rates. This is the inflection point where the private sector can breathe again.
A stabilized macroeconomic baseline unlocks export potential. Pakistan’s IT sector has demonstrated resilience despite the chaotic regulatory environment. Freelancers and software houses export nearly $3 billion annually, but billions more remain parked in offshore accounts due to a lack of trust in the State Bank’s repatriation policies. Restoring confidence could double these inflows within 24 months.
Regionally, a financially stable Pakistan alters the geopolitical calculus in South Asia. A country not perpetually on the brink of default is a more reliable partner for foreign direct investment, particularly from Gulf Cooperation Council nations. Saudi Arabia and the UAE have shifted their foreign policy. They no longer offer blank cheques; they demand equity stakes in profitable assets. As the Economist Intelligence Unit reports, Gulf sovereign wealth funds are eyeing Pakistani mining, agriculture, and logistics sectors, but these investments hinge entirely on the enforcement of a stable macroeconomic framework.
This transition from geo-strategic rent-seeking to genuine economic partnership is the ultimate prize. If Islamabad can prove it isn’t a bottomless pit for multilateral loans, it can attract the kind of patient, long-term capital that builds manufacturing bases and funds high-tech infrastructure. But capital is cowardly. It flees at the first sign of policy reversal. The state must prove its commitment through successive budget cycles, not just during the panicked weeks before an IMF board meeting.
The Case Against Austerity
There is a credible, deeply researched counterargument that aggressive fiscal consolidation is the wrong medicine for a patient already in cardiac arrest. Proponents of heterodox economics argue that austerity merely shrinks the GDP, making the debt-to-GDP ratio mathematically worse.
In this view, the insistence on primary surpluses and massive subsidy cuts disproportionately harms the industrial base. By making energy too expensive and credit too costly, the state kills the very manufacturing sector needed to generate export dollars. Economist Atif Mian frequently highlights the dangers of austerity without growth. If the state cuts development expenditure to zero to pay bondholders, the infrastructure crumbles, and future productivity is crippled.
A briefing by the Center for Economic and Policy Research argues that rigid multilateral conditionalities historically lead to stagflation in developing nations. They contend the focus should be on debt forgiveness and aggressive industrial policy rather than mere accounting balances. You cannot tax a shrinking economy into prosperity.
This perspective holds intellectual weight. Punishing the working class for the fiscal sins of the elite is a recipe for social unrest. Still, the heterodox approach requires a level of state capacity and incorruptible bureaucracy that Pakistan currently lacks. Industrial policy only works when the state can pick winners based on merit, not political patronage. Until the governance deficit is bridged, the harsh discipline of the global market remains the only effective constraint on elite excess. Opting out of the global financial system to pursue localized economic experiments is a luxury the country simply can’t afford.
The Bill Comes Due
The autopsy of Pakistan’s financial decay reveals a state that has consistently prioritized short-term political survival over long-term national viability. The solutions aren’t shrouded in mystery; they are merely buried under decades of vested interests. Tax the untaxed. Privatize the bleeding state monopolies. Restructure the external debt. Empower the central bank.
Execution is a matter of political will, a commodity far scarcer in Islamabad than foreign exchange reserves. The elite must realize that the current trajectory ends in a sovereign default that will vaporize their own wealth just as surely as it starves the poor. The window for managed reform is closing rapidly, replaced by the looming threat of chaotic, forced restructuring.
A nation cannot borrow its way out of a debt crisis, nor can it negotiate with mathematics.
Discover more from The Economy
Subscribe to get the latest posts sent to your email.

The bond market vigilantes have awoken from a decade-long slumber. In London, Washington, and Tokyo, the cost of borrowing is no longer an abstract line item—it is the central constraint on political imagination. As sovereign debt servicing costs consume increasingly large portions of tax revenues, finance ministers face a brutal mathematical reality. You cannot outgrow a structural shortfall when interest rates sit at five percent. The era of free money is definitively over. Now, the bill for pandemic-era stimulus and structural overreach has arrived, demanding a severe recalibration of state spending priorities.
Global public debt hit 93 percent of GDP late last year, according to the International Monetary Fund. It is a staggering figure that obscures the acute pain felt at the national level. When the pandemic hit, emergency spending was necessary to prevent a total collapse of consumer demand. Today, that debt overhang threatens macroeconomic stability across both developed and emerging markets. The global economy is shifting from quantitative easing to quantitative tightening. As central banks offload their balance sheets, treasuries are forced to find real buyers for their debt. That means offering higher yields, which in turn deepens the deficit. It is a vicious cycle that demands immediate, structural intervention. We are witnessing a fundamental repricing of sovereign risk. If policymakers ignore the warning signs flashing across the bond markets, the subsequent capital flight will force their hands under far worse conditions.
The Core Mechanisms of Fiscal Correction
Implementing effective fiscal deficit reduction strategies is the defining economic challenge of this decade. Politicians typically prefer the illusion of pain-free growth, hoping that an expanding economy will magically shrink the debt-to-GDP ratio. Yet, relying solely on growth is a gamble that rarely pays off in a high-interest-rate environment. Real correction requires aggressive, politically difficult choices. The primary mechanisms fall into two distinct camps: revenue expansion and expenditure rationalisation. The former involves broadening the tax base, closing corporate loopholes, and adjusting marginal rates to capture wealth without suppressing investment. The latter requires cutting public sector bloat, reforming entitlement programs, and delaying capital-intensive infrastructure projects.
In October 2023, the World Bank warned that rising borrowing costs are already crowding out essential investments in climate transition and healthcare across the developing world. The math is unforgiving. When a state spends 20 percent of its revenue merely servicing existing debt, its capacity to fund future growth vanishes. Successful deficit reduction strategies demand a forensic audit of state subsidies. Energy subsidies alone cost global governments $7 trillion annually. Trimming these subsidies is politically toxic—often triggering immediate street protests—but mathematically necessary.
Finance ministries must also confront the inefficiency of their tax collection apparatus. Digitising tax systems and cracking down on offshore evasion can yield substantial revenue without the political blowback of raising headline income tax rates. Still, tax reform is rarely enough. Expenditure cuts must accompany revenue generation to convince bondholders that the state is serious about its structural deficit. Market credibility is won through hard choices, not optimistic growth forecasts. When investors see a credible, multi-year plan to close the gap, sovereign yields stabilize, creating a virtuous cycle of lower borrowing costs.
Balancing the National Budget in an Age of Volatility
How do governments reduce fiscal deficits? Governments reduce fiscal deficits through a combination of revenue mobilisation—such as broadening the tax base or raising marginal rates—and targeted expenditure cuts. Effective fiscal consolidation measures also involve structural reforms that stimulate long-term GDP growth, thereby lowering the debt-to-GDP ratio without suffocating immediate economic activity.
Balancing the national budget is complicated by demographics. Aging populations across the West ensure that pension and healthcare liabilities will strictly increase over the next 20 years. You cannot simply slash pensions without breaching the fundamental social contract. Instead, governments are quietly raising the retirement age and indexing benefits to inflation rather than wage growth. These are stealth corrections—incremental changes designed to compound massively over decades.
The analytical consensus suggests that attempting to balance the budget in a single parliamentary term is a fool’s errand. Shock-therapy austerity often triggers a deep recession, which subsequently collapses tax revenues and paradoxically widens the deficit. The smartest sovereign debt management approaches stagger the pain. By front-loading legislative changes that take effect years later, governments can signal fiscal discipline to the markets while avoiding an immediate shock to consumer demand.
What follows, however, is a dangerous political calculus. Lawmakers frequently target the easiest line items: foreign aid, arts funding, and municipal grants. These cuts make headlines but barely dent the structural deficit. The real money lies in entitlements and defence. Yet, with geopolitical tensions rising, cutting defence budgets is largely off the table. This leaves entitlement reform and aggressive taxation as the only viable levers.
Downstream Impacts of Fiscal Consolidation Measures
The immediate consequence of strict fiscal consolidation measures is a deceleration of domestic demand. When the government stops injecting borrowed money into the economy, businesses that rely on public contracts inevitably suffer. We see this acutely in the construction and defence procurement sectors, where delayed projects translate directly into job losses.
However, the long-term payoff is undeniable. By withdrawing from the debt markets, governments free up capital for private enterprise. Research from the Bank for International Settlements confirms that persistently high government borrowing crowds out private investment. When the state stops competing for every available dollar of domestic savings, interest rates for corporate borrowers generally decline. This allows healthy businesses to invest in research, development, and expansion.
Furthermore, narrowing the deficit stabilizes the currency. A state that prints bonds to fund everyday operations inherently devalues its own money. Returning to a sustainable fiscal path attracts foreign direct investment. International investors seek certainty; they want to know that their returns will not be eroded by surprise wealth taxes or rapid currency depreciation.
That said, the transition period is highly disruptive. The Bank of England’s recent interventions in the gilt market serve as a stark reminder of how quickly liquidity can evaporate when markets lose faith in a government’s fiscal trajectory. Bond markets dictate the terms of surrender. When a government announces unfunded tax cuts or reckless spending packages, yields spike instantly, forcing central banks into uncomfortable rescue operations. Fiscal discipline is no longer an ideological preference; it is a structural necessity to maintain access to capital.
The Keynesian Counterargument
Not everyone agrees with the rush to slash deficits. A vocal contingent of macroeconomic scholars argues that obsessing over the debt-to-GDP ratio is a fundamental misreading of modern fiat currency systems. The Keynesian counterargument posits that deficits are not inherently dangerous as long as the borrowed money is invested in productive, growth-enhancing assets.
If a government borrows at four percent to build a high-speed rail network that boosts regional productivity by six percent, the debt effectively pays for itself. The Organisation for Economic Co-operation and Development frequently highlights the danger of cutting public investment during a downturn. Their data points to the austerity failures in Southern Europe following the 2008 financial crisis. Slashing state spending hollowed out those economies, resulting in a lost decade of growth and leaving the debt burden proportionally higher than when the cuts began.
The dissenting view insists that the focus should be entirely on the denominator: GDP growth. By adopting aggressive industrial policies, subsidising green tech, and investing heavily in education, states can expand their economic output fast enough to render the debt irrelevant. From this perspective, aggressive fiscal deficit reduction strategies are a form of economic self-harm.
Still, this argument requires perfect execution. It assumes politicians will allocate capital with the ruthless efficiency of a private equity firm, rather than funneling borrowed money to politically connected constituents or failing legacy industries. The reality of public spending is far messier. While the theory of productive debt is sound, the empirical track record of governments picking commercial winners is dismal.
The Final Reckoning
The tension between fiscal responsibility and economic growth cannot be resolved with a single policy lever. Finance ministers are trapped in a tight corridor, flanked by the demands of an aging electorate on one side and the unforgiving calculus of bond investors on the other. Relying on inflation to erode the real value of national debt has proven catastrophic for living standards, leaving structural reform as the only honest path forward.
Ultimately, the states that survive the coming decade of expensive capital will be those that differentiate between essential investments and bloated consumption. Overcoming the fiscal deficit is not a matter of ideology; it is the brutal, necessary arithmetic of national survival.
Discover more from The Economy
Subscribe to get the latest posts sent to your email.

The technology sector’s AI-driven euphoria met a sobering structural reality check on Thursday as a sudden Broadcom market value loss wiped out more than $300 billion in market capitalization within hours of the opening bell. A softer-than-anticipated full-year revenue outlook blindsided institutional asset managers who had previously priced the silicon heavyweight for flawless execution. Chief Executive Hock Tan delivered the disappointing forecast during a late-evening earnings call, revealing that surging demand for custom artificial intelligence processors can no longer fully shield the enterprise from a persistent, deep drag in traditional corporate networking and broadband infrastructure. The resulting selloff marks one of the sharpest single-day valuation declines in semiconductor history, shaking investor confidence across the entire hardware ecosystem.
This abrupt market re-pricing takes place against a fragile macroeconomic backdrop where corporate technology spend faces intense institutional scrutiny. For eighteen months, mega-cap technology stocks rode a wave of generational optimism, lifting Broadcom into the exclusive club of trillion-dollar corporations. Yet, central banks’ higher-for-longer interest rate regimes have begun squeezing enterprise hardware refresh cycles. Data compiled by the Federal Reserve Bank of St. Louis indicates that industrial production for electronics and advanced communications components slowed by 3.2% over the last fiscal quarter. This macro drag means legacy sectors like telecommunications and storage networks are actively contracting.
Wall Street’s aggressive valuation models incorrectly assumed artificial intelligence infrastructure could completely break free from these broader economic gravity loops. The latest regulatory disclosures within Securities and Exchange Commission filings show that while AI infrastructure investments remain highly concentrated among four or five hyperscale cloud providers, the rest of the corporate economy is pulling back on capital deployment. The broader chip sector is finding that raw AI growth cannot instantly offset a structural downcycle across thousands of traditional enterprise buyers.
The Mechanics Behind the Broadcom Market Value Loss
The unprecedented Broadcom market value loss reflects deep structural anxiety over the company’s forward guidance, which fell short of institutional consensus models by nearly $800 million. While the company adjusted its annualized artificial intelligence revenue targets upward to $12 billion, the broader revenue forecast for its traditional semiconductor segments dropped significantly. Institutional desks immediately adjusted their portfolios, triggering a high-volume exit that pushed the stock down by 14.5% in early trading. As reported by Bloomberg Financial Markets, this single-session collapse wiped out gains accumulated over four months of aggressive institutional bidding, highlighting how thin the margin for error has become for premium-priced semiconductor equities.
The mechanics of the disappointment lie in the non-AI segments, which still account for more than 40% of Broadcom’s aggregate semiconductor revenue. Sales in the broadband unit plummeted by 39% year-over-year, while the enterprise networking division saw a 12% drop outside of cloud-scale custom switching infrastructure. According to analysis published by the Financial Times Markets Desk, corporate buyers are actively sweating existing hardware assets rather than purchasing next-generation silicon. This shift left Broadcom with elevated channel inventories that will take at least two quarters of reduced utilization to fully clear.
Segment Revenue Disparity
| Broadcom Operating Division | Year-over-Year Performance | Primary Demand Driver |
| Custom AI Processors (ASICs) | +240% Growth | Hyperscale Cloud Infrastructure |
| Enterprise Networking Fabric | +12% Growth | Data Center Switching Switching (Tomahawk 5) |
| Legacy Enterprise Hardware | -12% Decline | Corporate Server Farms / Campus Upgrades |
| Broadband Infrastructure | -39% Decline | Telecommunications Capital Freezes |
| Wireless RF Modules | Flat (0% change) | Consumer Smartphone Upgrade Cycles |
Chief Executive Hock Tan confirmed during the call that traditional telecommunications customers have frozen major capital projects. For instance, prominent carriers in North America and Western Europe reduced their broadband component orders by a combined 28% over the past six months. This structural freeze directly undermined the revenue stability that conservative pension funds relied upon when buying Broadcom as a defensive technology play.
The friction extends to Broadcom’s wireless division, which designs complex radio-frequency front-end modules for premium smartphones. In the current cyclical slowdown, consumer upgrade cycles have stretched out to an average of 38 months in major consumer markets. This consumer inertia has slowed shipment volumes for high-end devices, directly impacting the wireless component segment which saw flat revenue performance. While Broadcom maintains a multi-year supply agreement with major consumer hardware brands, the lack of volume growth has left the division unable to cushion the massive blow dealt by the broadband collapse.
The company’s software division also faced intense market scrutiny. The integration of VMware, acquired for $69 billion, has progressed through a controversial transition to subscription-only licensing models. While Tan defended the strategy, stating that annualized run-rate revenues reached $4.8 billion in the software segment, the pace of legacy customer churn was higher than internal forecasts anticipated. Institutional analysts from Reuters Technology Sector Reporting noted that small and mid-sized enterprises are actively migrating away from VMware to open-source alternatives, compounding the operational revenue drag.
Market Dynamics and the AI Chip Revenue Slowdown
The market’s violent reaction exposes a profound structural misunderstanding of the modern semiconductor supply chain. Investors treated Broadcom as a pure-play artificial intelligence proxy, grouping it with companies that design graphics processing units. Still, Broadcom’s operating model is fundamentally distinct. It relies on custom application-specific integrated circuits, known as ASICs, designed in partnership with custom cloud giants like Alphabet and Meta.
Is the AI chip market slowing down?
No, the AI chip market isn’t slowing down, but its growth is consolidating among fewer hyperscale buyers. Broadcom’s recent market corrections stem from a steep 39% decline in its traditional broadband and legacy enterprise networking segments, which overwhelmed its otherwise strong $12 billion custom AI processor revenue stream.
What follows, however, is a deeper valuation challenge. Custom silicon projects carry completely different margin profiles than standard merchant chips. When a hyperscaler contracts Broadcom to co-design an AI accelerator, the development cycles stretch over 18 to 24 months. The capital outlay is front-loaded, and the gross margins are structurally lower than those commanded by proprietary, off-the-shelf networking hardware. This operational reality was laid bare on September 4, when financial metrics showed a gross margin compression of 110 basis points in the semiconductor solution segment.
The operational dynamic becomes clearer when evaluating the engineering resource allocation required for custom ASICs. Unlike standard merchant products that can be sold to hundreds of different customers with minimal modification, custom processors demand dedicated teams of physical design engineers working exclusively for a single hyperscale client. This concentration of engineering talent creates an organizational bottleneck, limiting Broadcom’s capacity to scale its customer base beyond its existing tier-one cloud partnerships. If a single major cloud provider decides to alter its chip architecture or insource its design capabilities, Broadcom faces immediate, unhedged revenue concentration risks that are difficult to mitigate.
The picture is more complicated when examining the physical layers of data center architecture. Vertical scaling inside hyperscale systems means that while AI clusters require massive amounts of customized switching fabric, such as Broadcom’s Tomahawk 5 chips, these deployments require far fewer traditional routing nodes. The industry is witnessing an internal cannibalization of corporate capital expenditures. A dollar spent by a cloud vendor on an AI cluster is frequently a dollar stolen from standard corporate server farms. This systemic shift means Broadcom’s legacy merchant silicon lines are experiencing an accelerating rate of obsolescence that custom AI silicon sales cannot immediately replace. Institutional funds are realizing that the absolute addressable market for these custom processors is bounded by a tiny group of ultra-wealthy cloud operators, limiting the infinite scalability previously priced into the equity.
Cross-Industry Contagion and Hardware Rebalancing
The reverberations of Broadcom’s market shift extend far beyond its headquarters in San Jose, California. As the premier supplier of backplane infrastructure, the company acts as a leading economic bellwether for global technology supply chains. The immediate downstream consequence will likely manifest as a broader tactical repricing across the entire hardware ecosystem. Equipment suppliers, assembly partners, and silicon foundries must now recalibrate their production schedules to accommodate this deceleration in standard corporate hardware sales.
Data compiled by the Organization for Economic Co-operation and Development suggests that global corporate IT infrastructure spending will remain flat through the final quarters of the year. This reality will force enterprise networking vendors to engage in aggressive price competition to clear accumulated warehouse inventory. For corporate buyers and CIOs, this structural imbalance offers an unexpected negotiating advantage, as hardware costs for standard enterprise storage and routing platforms are projected to decline by up to 15% over the next nine months.
Still, for the broader equity markets, the development signals an ending to the indiscriminate technology rally. Index funds and exchange-traded funds heavily weighted toward advanced semiconductors are experiencing significant capital outflows. This capital migration suggests that institutional asset managers are rotating out of high-multiple hardware growth stories into cash-generative value sectors or enterprise software platforms.
Tier-two cloud service providers and regional data center operators are experiencing a distinct operational squeeze. Lacking the massive balance sheets of their trillion-dollar competitors, these secondary players cannot afford to build out massive AI networks while simultaneously maintaining their core enterprise hosting environments. As a result, they are deferring upgrades to their standard networking fabrics, directly impacting Broadcom’s high-margin merchant chip sales. This systemic freeze in tier-two demand creates an extended valley in the order book, forcing component distributors to write down inventory values and adjust forward orders.
For national policymakers focused on technological sovereignty, Broadcom’s financial friction provides a cautionary data point. Governments in Washington, Brussels, and Tokyo have poured hundreds of billions of dollars into domestic chip manufacturing initiatives. If the demand for semiconductor products remains bifurcated—booming in hyper-specific AI clusters but deeply depressed across standard industrial, automotive, and telecommunications applications—newly constructed fabrication facilities risk opening into an environment characterized by systemic overcapacity. The risk of underutilized chip factories could complicate public-private subsidy structures, forcing state planners to re-evaluate the timing of secondary funding rounds for domestic silicon infrastructure.
The Case for Long-Term Structural Realignment
A compelling counter-thesis exists among long-horizon value investors who view this market correction as an overreaction to transient cyclical adjustments. This perspective holds that evaluating Broadcom based on near-term legacy hardware declines fundamentally misreads the long-term value capture of the VMware transition and the inevitability of hybrid cloud architectures. The bearish outlook assumes that traditional enterprise networking spend is permanently lost, whereas history suggests it is merely deferred during periods of macroeconomic rebalancing.
According to a comprehensive macro sector analysis published by the Bank for International Settlements, corporate capital expenditure cuts during periods of high borrowing costs typically reverse within 12 to 18 months as corporate balance sheets adjust to the prevailing interest rate environment. When these enterprise refresh cycles eventually resume, Broadcom’s dominant market share in merchant switching silicon remains virtually unchallenged. The company’s proprietary intellectual property portfolio creates an incredibly high barrier to entry that prevents competitors from easily encroaching on its core territory.
What follows, however, is an argument that the VMware software strategy is operating exactly as designed. By shifting the acquired customer base toward high-margin, multi-year subscription bundles, Broadcom is building a predictable, recurring cash flow engine that will insulate the parent company from future semiconductor cycles. Analysts at the International Monetary Fund have noted that high-margin enterprise software investments often provide crucial stability to multinational technology groups during periods of volatile hardware demand. From this perspective, the current drop in valuation represents an ideal accumulation window for institutional capital looking to secure a premier technology asset at a significant discount.
The market’s punitive response to Broadcom’s financial outlook highlights the central tension defining the modern technology sector: the painful friction between speculative future narratives and immediate financial realities. Artificial intelligence is undeniably transforming the structural architecture of global computing, but it cannot instantly rewrite the foundational laws of corporate cash flow or eliminate the cyclical patterns that govern industrial hardware markets.
Broadcom remains a remarkably profitable enterprise with an unparalleled moat across both physical silicon and enterprise software layers. Still, its current market re-rating serves as a stark reminder that even the most sophisticated technological moats can be breached when short-term expectations decouple from macro realities. The challenge moving forward will be managing an enterprise that must fund tomorrow’s hyper-growth infrastructure using the proceeds of yesterday’s maturing cash cows. The era of blind capital allocation to any corporate balance sheet mentioning an AI strategy has officially drawn to a close, replaced by a cold, spreadsheet-driven calculation of real-world returns.
Discover more from The Economy
Subscribe to get the latest posts sent to your email.
-

 Markets & Finance5 months ago
Top 15 Stocks for Investment in 2026 in PSX: Your Complete Guide to Pakistan’s Best Investment Opportunities
-

 Analysis4 months ago
Top 10 Stocks for Investment in PSX for Quick Returns in 2026
-

 Analysis4 months ago
Brazil’s Rare Earth Race: US, EU, and China Compete for Critical Minerals as Tensions Rise
-

 Banks5 months ago
Best Investments in Pakistan 2026: Top 10 Low-Price Shares and Long-Term Picks for the PSX
-

 Investment5 months ago
Top 10 Mutual Fund Managers in Pakistan for Investment in 2026: A Comprehensive Guide for Optimal Returns
-

 Analysis4 months ago
Johor’s Investment Boom: The Hidden Costs Behind Malaysia’s Most Ambitious Economic Surge
-

 Global Economy5 months ago
15 Most Lucrative Sectors for Investment in Pakistan: A 2025 Data-Driven Analysis
-

 Global Economy5 months ago
Pakistan’s Export Goldmine: 10 Game-Changing Markets Where Pakistani Businesses Are Winning Big in 2025