
Analysis
Singapore’s $23 Trillion AI Capital Magnet: Inside Invest ASEAN 2026


The 13th Invest ASEAN conference in Singapore brought together 200 institutional investors managing a combined US$23 trillion in assets and 54 listed companies worth US$553 billion. The concentration reflects a broader recalibration of global capital toward Southeast Asia as energy transition, supply-chain reconfiguration, and AI-led digital transformation converge — with Singapore positioning itself as the region’s financial gateway for that capital.
The number that got buried in the GDP headline
Most coverage of Singapore’s economy this month led with the topline figure: Q1 2026 GDP growth came in at a robust 6.0% year-on-year, well above flash estimates of 4.6% and the strongest reading since Q3 2024 (Joey Choy Newsletter). That’s a genuinely strong number. But it obscures a more consequential story happening in parallel: the sheer scale of capital now treating Singapore as Southeast Asia’s default financial hub for AI-era investment.

At this year’s Invest ASEAN conference, Maybank Investment Banking Group reported that 200 institutional investors managing US$23 trillion in combined assets attended alongside 54 companies with a combined market capitalization of US$553 billion, spanning Malaysia, Singapore, Thailand, Indonesia, the Philippines, Vietnam and India (BigGo Finance). Maybank IBG’s CEO Michael Oh-Lau said attendance exceeded expectations, underscoring sustained interest from both global and local investors in the region’s resilience amid worldwide uncertainty.
Why now — the three-part thesis driving the capital shift
The conference’s dominant themes weren’t accidental. Three forces are converging simultaneously:
- Energy transition — as global supply chains reroute away from Middle East chokepoints exposed by the Strait of Hormuz conflict, Southeast Asia’s manufacturing base becomes comparatively more attractive.
- Supply chain reconfiguration — companies diversifying out of single-country manufacturing dependence increasingly view ASEAN as a structural beneficiary, not just a cyclical one.
- AI-led digital transformation — the region is capturing meaningful downstream value from the AI capex boom, not just as a manufacturing base for chips but as a testing, R&D and deployment hub.
Maybank IBG simultaneously upgraded its Asean-6 growth forecast to 4.7% from 4.5%, citing easing global oil prices, a recovering flow of tanker traffic through the Strait of Hormuz, and robust regional activity (BigGo Finance) — a dynamic explored further in our Malaysia GDP upgrade analysis.
Singapore’s policy backdrop: stability as the product
Singapore’s Ministry of Trade and Industry has kept its full-year 2026 GDP growth forecast at 2.0–4.0%, flagging geopolitical developments — not domestic weakness — as the primary downside risk to monitor (Joey Choy Newsletter). Inflation remains contained within a 1–2% range, which has allowed the Monetary Authority of Singapore to hold its policy stance steady rather than react defensively. In a year when most major central banks are navigating volatility, that steadiness is itself the competitive advantage drawing capital in.
What this means beyond Singapore
The capital concentration isn’t purely a Singapore story — it’s a bet on the entire ASEAN growth thesis, with Singapore serving as the transaction and custody layer. For businesses and investors, the practical signal is that Southeast Asia is increasingly being treated by global allocators as a coherent investment bloc rather than nine separate frontier markets, with Singapore’s regulatory stability functioning as the anchor that makes exposure to higher-growth, higher-volatility neighbors (Indonesia, Vietnam, the Philippines) palatable to large institutional funds.
Discover more from The Economy
Subscribe to get the latest posts sent to your email.


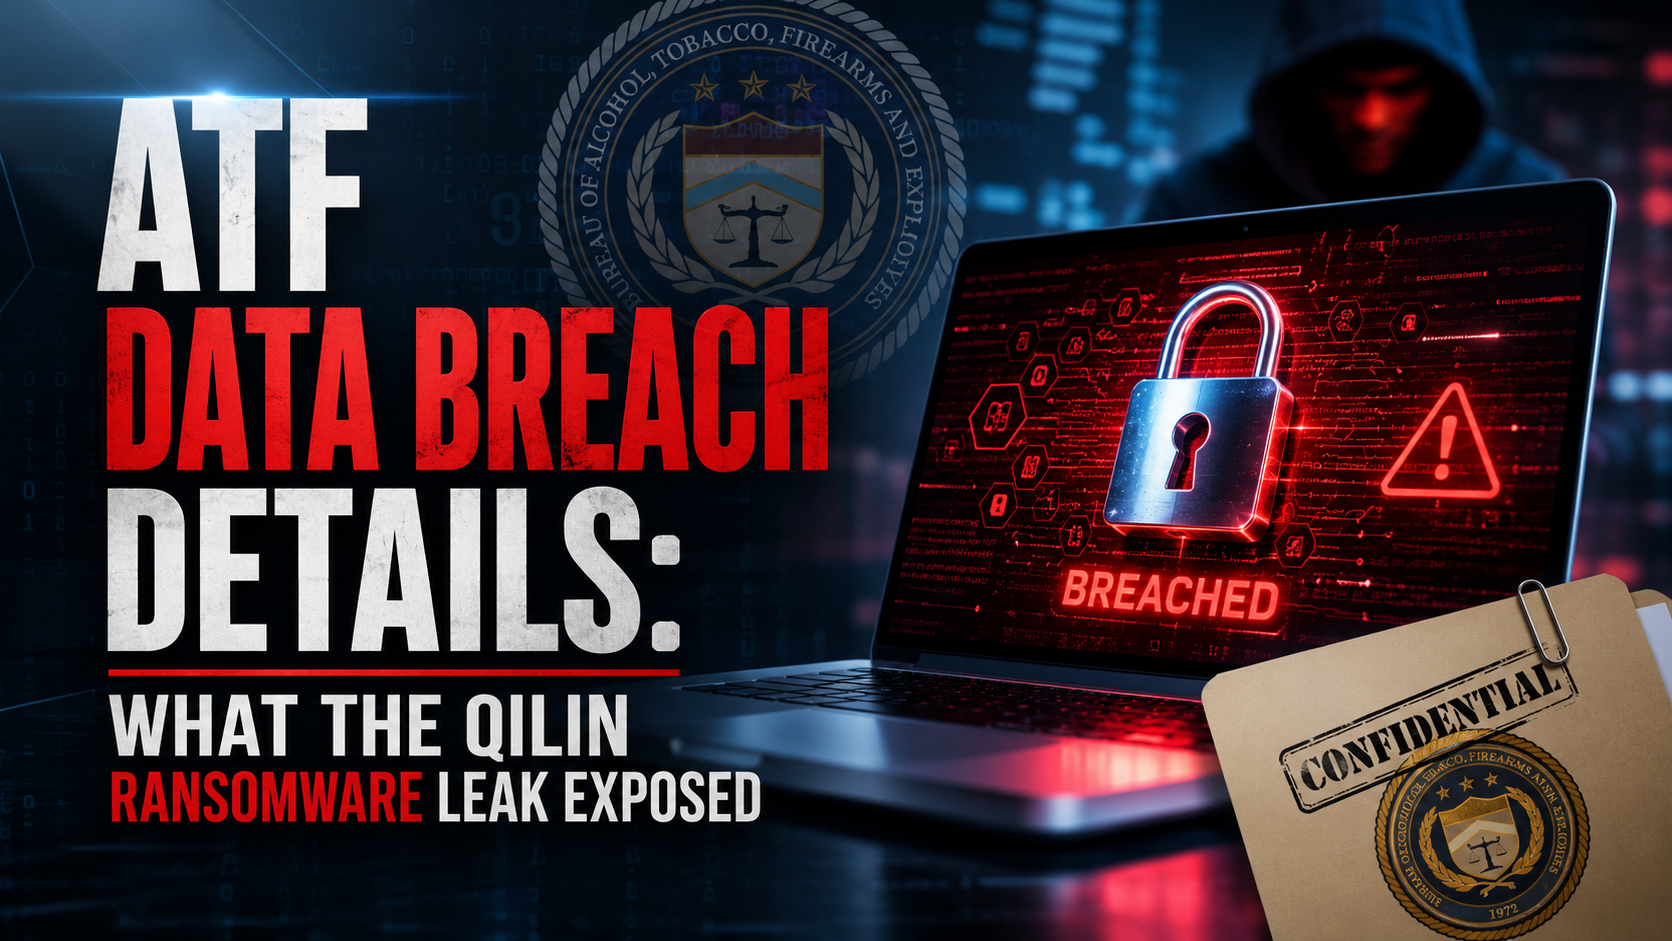
The Bureau of Alcohol, Tobacco, Firearms and Explosives confirmed on August 26, 2026, that a ransomware gang breached a standalone computer system containing active criminal investigation data, a “major incident” under federal guidelines that triggered mandatory Congressional notification — and by September 1, leaked files reviewed by CNN and an independent cybersecurity researcher appeared to expose ATF investigative targets, phone communication analyses, and case details tied to armed robbery, arson, explosives, and homicide investigations, including a significant cluster from the agency’s Houston Field Division.
Timeline: From Ransom Deadline to Public Leak
The breach became public in stages over roughly a week:
August 26, 2026: The Qilin ransomware gang — a Russian-speaking ransomware-as-a-service operation — added ATF to its dark web leak site, listing the federal agency alongside five other victims, primarily from industrial and manufacturing sectors. The same day, ATF issued a press release confirming it was responding to “a cybersecurity incident affecting a standalone system.” The Department of Justice designated the event a “major incident” under federal guidelines, a formal classification requiring notification to Congress.
Late August 2026: Qilin’s initial listing did not include published sample data, file trees, or other typical proof-of-breach materials, and ATF’s own statement did not name Qilin by name at all — the attribution came entirely from the ransomware group’s own leak-site post and subsequent media reporting.
August 31–September 1, 2026: After ATF reportedly missed a 72-hour ransom deadline, Qilin published roughly 6.3GB of data to its dark web leak site. Independent cybersecurity researcher Ron Fabela, along with CNN’s review of the material, found the dumped files appeared to include information on targets of past ATF investigations and analyses of their phone communications, corresponding in some cases to specific ATF agents and the high-profile cases they had apparently worked on.
What the Leaked Files Reportedly Contain
According to Fabela’s analysis, the leaked data covers investigations related to armed robbery, arson, explosives, and homicide. A significant portion of the referenced cases fall under the ATF’s Houston Field Division specifically. ATF itself has been notably cautious in its public characterization of the material, stating it “cannot confirm the authenticity, nature, or scope of the material at issue” and that it is working with the Department of Justice and other federal partners to assess the claims and determine appropriate next steps.
ATF’s Official Position: Containment and Scope Limitations
Throughout its public communications, ATF has consistently emphasized that the breach was contained to a single, isolated system. The agency stated there was “no indication that the incident has affected the ATF enterprise network, the ATF eForms system, or any other ATF system,” and separately confirmed the affected standalone system was not connected to other ATF operational infrastructure, including case management systems or laboratory systems. ATF has maintained that its ability to carry out its core law enforcement mission has not been impacted by the incident.
Immediately upon discovering the intrusion, ATF said it cut off access to the affected system and initiated incident-response and forensic activities. The agency has also asked for public assistance, urging anyone with information about the breach to call its tipline at 1-888-ATF-TIPS.
Why This Breach Carries Unusual National Security Weight
The nature of ATF’s mission gives this particular breach a distinct risk profile compared to many corporate ransomware incidents. ATF investigations routinely target firearms trafficking networks, violent gangs, bomb makers, terror suspects, and individuals under investigation for domestic violence-related firearms offenses. Leaked information about the inner workings of these investigations — including which individuals are under scrutiny and what evidence investigators have gathered against them — could expose confidential informants, compromise ongoing investigations, and in some cases create direct safety risks for both the investigative targets whose data was exposed and the ATF agents who worked those cases.
Under federal law, a “major” cyber incident designation is generally reserved for breaches that could harm U.S. national security, foreign relations, or economic security, or that could result in demonstrable harm to public confidence, civil liberties, or public health and safety — meaning ATF’s classification of this incident reflects a serious assessment of its potential downstream consequences, not merely a bureaucratic formality.
Part of a Broader Pattern of Federal Law Enforcement Breaches
The ATF incident is not occurring in isolation. It lands amid a documented wave of intrusions targeting federal law enforcement and homeland security infrastructure throughout 2026. In March 2026, the FBI disclosed that China-linked hackers had infiltrated its Digital Collection System Network — the infrastructure used to manage court-authorized wiretaps and FISA surveillance warrants — in an incident investigators attributed to a vendor supply-chain compromise. Separately, a broader Cybernews investigation found that more than 75% of U.S. government websites suffered some form of data breach in 2025, exposing everything from employee credentials to sensitive internal information across federal agencies.
Historical precedent within the justice and law enforcement sector reinforces the pattern: a 2023 ransomware attack on the U.S. Marshals Service affected personal information tied to the subjects of the service’s investigations, and that same year, hackers breached an FBI New York field office computer system used in child exploitation investigations, reportedly including a system tied to the Jeffrey Epstein investigation.
Who Is Qilin?
Qilin, previously tracked under the name Agenda, is among the most prolific ransomware-as-a-service operations active in 2025–2026, with reported claims against 885 total victims listed on its dark web leak site as of early August 2026. As a ransomware-as-a-service operation, Qilin provides its ransomware infrastructure to affiliated criminal groups in exchange for a share of any extorted proceeds, a business model that has made it one of the most active and geographically diverse ransomware brands currently tracked by cybersecurity researchers.
Practical Guidance Emerging From the Incident
Cybersecurity analysts and legal commentators tracking the breach have offered specific, audience-targeted guidance in its wake:
- Federal contractors working with justice-sector systems should expect stricter multi-factor authentication and VPN access reviews in the near term.
- Defense attorneys handling firearms-related cases should monitor court dockets for discovery disputes that may arise tied to the incident, since compromised investigative files could affect evidentiary chains in active prosecutions.
- Journalists and members of the public are cautioned against republishing unverified Qilin-sourced samples as authenticated ATF records without independent agency confirmation, given ATF’s own stated inability to confirm the authenticity of the leaked material.
- General public should be skeptical of social media posts claiming to offer “leaked ATF gun owner lists,” a recurring scam pattern that tends to emerge following firearms-agency data breach headlines, regardless of whether such lists have any connection to the actual leaked material.
Key Takeaways
- ATF confirmed a ransomware breach of a standalone system on August 26, 2026, later designated a “major incident” requiring Congressional notification.
- The Qilin ransomware gang published approximately 6.3GB of data after ATF reportedly missed a 72-hour ransom deadline.
- Independent analysis suggests the leaked files include information on ATF investigative targets, phone communication analyses, and cases involving armed robbery, arson, explosives, and homicide, with a concentration tied to the Houston Field Division.
- ATF maintains the breach was isolated to a standalone system and did not affect its core operational infrastructure, including case management or eForms systems.
- The incident is part of a broader documented pattern of cyberattacks against U.S. federal law enforcement and government systems throughout 2025–2026.
Frequently Asked Questions
What data was exposed in the ATF breach?
Leaked files reviewed by independent researchers and journalists appear to include information on ATF investigative targets, phone communication analyses, and case details related to armed robbery, arson, explosives, and homicide investigations, with a significant portion tied to the Houston Field Division.
Who is responsible for the ATF hack?
The Russian-speaking ransomware group Qilin claimed responsibility by listing ATF on its dark web leak site; ATF’s own public statements have not directly named or confirmed Qilin as the responsible party.
Did the ATF breach affect the agency’s core operations?
ATF states the breach was confined to a standalone system not connected to its enterprise network, eForms system, or other operational infrastructure, and that its ability to carry out its mission was not impacted.
Discover more from The Economy
Subscribe to get the latest posts sent to your email.

Buddy Stephens, the five-time national championship-winning head football coach made famous by Netflix’s “Last Chance U” and the winningest coach in East Mississippi Community College history, is no longer with the program, the school announced abruptly on August 31, 2026 — just days before the Lions were set to open their season — with reports pointing to critical comments Stephens made about conference changes as the trigger for his exit.
A Legacy Built Over 18 Seasons
Wofford Oran “Buddy” Stephens Jr., born September 6, 1966, in Huntsville, Alabama, took over the East Mississippi Community College Lions program in 2008 after serving as an assistant at Pearl River Community College. Over 18 seasons in Scooba, Mississippi, Stephens built one of the most dominant programs in junior college football history, compiling an overall coaching record of 155–31 — an .833 winning percentage — and a perfect 7–0 record in bowl games.
His championship résumé is extraordinary by any measure of junior college football success:
- 5 NJCAA National Championships: 2011, 2013, 2014, 2017, 2018
- 9 MACJC/MACCC State Championships: 2009, 2011, 2013, 2014, 2016, 2017, 2018, 2022, 2023
- 14 MACJC/MACCC North Division Championships: spanning 2008–2009, 2011–2019, 2021, 2023, and 2025
Beyond the trophy case, Stephens developed a remarkable pipeline of talent into higher levels of football. On average, roughly 25 EMCC players moved on to four-year programs each season, and as many as 25 of his former athletes have gone on to play in the NFL, UFL, CFL, or IFL. Nine of his players have been drafted into the NFL outright, including notable names like Chad Kelly, Jarran Reed, and Dakota Allen. Stephens also coached 35 NJCAA All-Americans and nine All-America quarterbacks over his tenure, and was named NJCAA Football Coach of the Year three times.
The Netflix Spotlight That Made Him a National Figure
Stephens’ profile extended well beyond junior college football circles thanks to Netflix’s “Last Chance U,” which followed the EMCC program during its first two seasons and turned Stephens — along with his players — into recognizable figures well outside traditional college football media coverage. The show captured both the program’s championship intensity and the high-stakes, high-pressure environment junior college football represents for players seeking a pathway back to major college programs, cementing Stephens’ reputation as one of the sport’s most compelling and complicated figures.
His standing within the coaching profession was formally recognized in 2024, when Stephens was announced as the lone honoree inducted into the NJCAA Football Coaches Association Hall of Fame, capping what was then his 17th season with the program and a coaching record of 143–23.
The Abrupt August 2026 Departure
Just as the 2026 season was set to begin, East Mississippi Community College announced Sunday night, August 31, 2026, that Stephens was no longer with the program. The announcement came via the athletic department’s social media, which named offensive coordinator and associate head coach Preston Rice — now in his second season with the program — as interim head coach. Notably, the school’s initial statement gave no explanation for Stephens’ departure from a position he had held for 18 years.
Multiple sports outlets reporting on the story attributed the exit to critical comments Stephens made about changes implemented by the conference, though the full context and content of those remarks had not been comprehensively detailed in initial coverage. The timing was especially jarring given that Stephens had spent the preceding weeks finalizing his 2026 coaching staff, including the additions of former Mississippi State teammates Michael Story and Maurice Smitherman as assistant coaches — moves announced as recently as mid-July 2026, just weeks before his exit.
What Happens Now for the Lions
EMCC’s season opener was scheduled for Thursday, September 3, against Hinds Community College, meaning interim head coach Preston Rice inherited the program with essentially no transition runway. Rice’s promotion from within — rather than an external interim hire — suggests the school prioritized continuity for a roster and coaching staff that had just been finalized under Stephens days earlier.
| Category | Buddy Stephens (2008–2026) | Notable Detail |
|---|---|---|
| Overall Record | 155–31 (.833) | Winningest coach in EMCC history |
| National Titles | 5 (2011, 2013, 2014, 2017, 2018) | NJCAA Division I Football Championship |
| Bowl Record | 7–0 | Undefeated in postseason bowl appearances |
| NFL Draft Picks | 9 | Including Chad Kelly, Jarran Reed |
| Hall of Fame | 2024 NJCAA Football Coaches Association | Lone honoree that year |
Why This Story Resonates Beyond Junior College Football
Stephens’ exit carries significance beyond the immediate coaching change for a few reasons. First, EMCC’s football program has functioned as one of the sport’s most visible and successful pipelines from junior college to Power Conference and NFL careers, meaning any leadership instability there has ripple effects for recruiting pathways used by players nationwide who don’t take the traditional four-year route. Second, the circumstances — a coach reportedly pushed out over public criticism of conference decisions rather than performance, contract expiration, or a rival job offer — raise broader questions about the balance of power between successful individual coaches and the athletic conferences and governing bodies they operate under, a tension increasingly visible across multiple levels of American football as conference realignment and rule changes accelerate nationwide.
For a program that had built its identity so thoroughly around one coach’s two-decade tenure and Netflix-era fame, replacing that continuity — even with an internal promotion just days before kickoff — represents one of the more consequential and unusual offseason (or, in this case, pre-season) coaching transitions in junior college football in recent memory.
Key Takeaways
- Buddy Stephens, EMCC’s head coach since 2008 and the winningest coach in program history (155–31), is no longer with the program as of August 31, 2026.
- Stephens won five NJCAA National Championships and coached nine players who were later drafted into the NFL.
- His tenure gained national visibility through Netflix’s “Last Chance U,” which covered the program’s first two seasons.
- Offensive coordinator Preston Rice was named interim head coach just days before EMCC’s September 3 season opener against Hinds Community College.
- Reports attribute the departure to critical comments Stephens made about conference changes, though full details remain limited.
Frequently Asked Questions
Why did Buddy Stephens leave East Mississippi Community College?
Reports indicate Stephens’ exit followed critical comments he made about changes implemented by the conference, though EMCC’s initial announcement did not specify a reason.
Who is the interim head coach at EMCC?
Preston Rice, EMCC’s offensive coordinator and associate head coach, was named interim head coach following Stephens’ departure.
What is Buddy Stephens’ coaching record?
Stephens compiled an overall record of 155–31 across 18 seasons at EMCC, including five NJCAA National Championships and a perfect 7–0 bowl record.
Discover more from The Economy
Subscribe to get the latest posts sent to your email.

High school football’s national rankings landscape in 2026 runs on a patchwork of systems — MaxPreps’ algorithm-driven state-by-state rankings, the human-and-statistical USA Today Super 25, and individual state association polls — while a separate and increasingly consequential system, Name, Image, and Likeness compensation, is now reshaping which programs attract elite talent long before any of those rankings matter for recruiting.
How the Major Ranking Systems Actually Work
Unlike college football’s Associated Press or Coaches Poll, high school football has no single, unified national ranking authority. Instead, three systems dominate:
MaxPreps operates the most granular system, generating rankings for every high school football team in the country broken out by state and classification. Crucially, its rankings update automatically based on entered game results rather than preseason reputation, meaning a program’s ranking is only as accurate as the completeness of its reported scores — teams that don’t consistently report results can end up ranked lower than their actual performance would justify, purely due to incomplete data.
The USA Today Super 25 takes a different approach, combining human voting from a panel of prep-sports journalists and editors with statistical analysis to produce a national top 25. Because the poll focuses primarily on large, open-enrollment programs that attract nationally recognized recruiting talent, it tends to spotlight a narrower band of powerhouse programs rather than reflecting the full breadth of competitive teams nationwide.
State association rankings and computer-generated polls round out the landscape, and matter most practically for the athletes and families involved, since playoff seeding in many states is directly tied to these ranking algorithms rather than to national polls. A crucial point applies across all systems: no major high school football ranking exists purely on preseason talent or history — every significant ranking system requires actual current-season game-result data, meaning even the most talent-loaded roster starts the year unranked until it plays and wins.
Why the Rankings Carry Real Financial and Institutional Stakes
National and state rankings aren’t just a matter of local pride. Recruiters use them as an initial filter to identify programs worth scouting, meaning a highly ranked program gets disproportionate exposure to college coaching staffs regardless of whether every individual player on the roster is a top recruit. Community investment in athletic programs — booster support, facility upgrades, coaching stability — also tends to track closely with ranking prominence, creating a self-reinforcing cycle where already-strong programs attract the resources needed to stay strong.
The NIL Disruption: A Patchwork More Fragmented Than College Football
While Division I college athletes now operate under a relatively centralized reporting structure — third-party NIL deals worth $600 or more must be reported through the NIL Go system within five business days, with the College Sports Commission clearing thousands of deals monthly — high school NIL remains far less uniform. There is no single national high school NIL rulebook; state legislatures, state athletic associations, and even individual school district policies determine what’s permitted, and those rules can shift with little advance notice.
As of 2026, twenty-nine states plus the District of Columbia allow high school athletes to profit from their name, image, and likeness while retaining eligibility. Notably, several of the most talent-rich states in the country — Florida, Georgia, Texas, and Ohio — currently prohibit high school NIL deals for eligible athletes, creating a stark geographic disparity in opportunity that has already reshaped recruiting behavior.
Reclassification and Transfer: The Real-World Consequences
This uneven legal landscape has produced two distinct athlete responses that are now well-documented in recruiting circles:
- Early reclassification: Talented players in NIL-restrictive states sometimes reclassify to an earlier graduating class specifically to enroll early in college and access collegiate NIL opportunities sooner, effectively skipping their final year of high school NIL-restricted eligibility.
- State-to-state transfers: Families in NIL-restrictive states increasingly consider transferring to programs in NIL-permissive states to allow their athletes to monetize their profile while still competing at the high school level.
California, historically one of the most talent-rich states in the country, was among the first to permit high school NIL deals without forfeiting eligibility — a first-mover advantage that continues to shape how the state’s elite recruits approach their final prep seasons, with reported NIL valuations for some five-star recruits approaching seven figures by the time they enroll in college.
Comparing the Ranking Systems at a Glance
| System | Basis | Scope | Best For |
|---|---|---|---|
| MaxPreps | Algorithm, updated after every reported game | Every team, every state, every classification | Tracking a specific team’s actual season performance |
| USA Today Super 25 | Human voting + statistical analysis | National top 25, skewed toward large open-enrollment powerhouses | Identifying nationally recognized recruiting hotbeds |
| State Association Rankings | State-specific algorithms | Statewide, tied directly to playoff seeding | Understanding a team’s actual postseason positioning |
What Families and Programs Should Understand Going Into the Season
For families navigating this landscape, the practical guidance from sports-law and NIL-focused analysts is consistent: never rely on generic social media posts or outdated articles when it comes to state-specific NIL eligibility rules. Because state legislatures and athletic associations can and do amend these rules with little warning, families considering a transfer for NIL purposes should verify current requirements directly with the relevant state athletic association before making a decision that could affect a student’s eligibility.
For programs themselves, the intersection of national rankings and NIL creates a new strategic dimension: a program’s ranking prominence now indirectly affects its ability to attract and retain elite talent not just through exposure to college recruiters, but through the visibility that drives local and regional NIL opportunities for its top players — turning Friday night rankings into a genuine competitive-advantage lever well beyond bragging rights.
Key Takeaways
- High school football has no single national ranking authority; MaxPreps, the USA Today Super 25, and state association polls each use different methodologies.
- All major ranking systems require actual in-season game-result data — none are based purely on preseason talent or history.
- High school NIL is permitted in 29 states plus D.C. as of 2026, but is explicitly prohibited in talent-rich states including Florida, Georgia, Texas, and Ohio.
- The NIL patchwork has driven both early reclassification into college and state-to-state transfers among elite prep athletes seeking monetization opportunities.
- Rankings carry real financial and institutional stakes, from playoff seeding to college recruiter exposure to community athletic investment.
Frequently Asked Questions
What is the most accurate national high school football ranking?
There isn’t a single definitive system; MaxPreps offers the most comprehensive state-by-state, algorithm-driven coverage, while the USA Today Super 25 focuses specifically on a curated national top 25 of powerhouse programs.
Can high school football players make money from NIL deals?
Yes, in 29 states plus Washington, D.C. as of 2026 — but rules vary significantly by state, and several talent-rich states, including Texas and Florida, currently prohibit high school NIL deals entirely.
Why do some highly talented teams start the season unranked?
Because every major high school football ranking system requires actual current-season game results; preseason talent alone does not generate a ranking under any major polling system.
Discover more from The Economy
Subscribe to get the latest posts sent to your email.

Latest iPhone Rumors 2026: iPhone 18 Pro & Foldable Specs

ATF Data Breach Details: What the Qilin Ransomware Leak Exposed

GoPro Stock Analysis (GPRO): Why It Surged 46% in One Day

Buddy Stephens Football Coach: Why He Left EMCC in 2026

High School Football National Rankings 2026: Full Guide

Tesla Stock Buy or Sell 2026: TSLA Q2 Earnings Breakdown

Shein Clothes Quality & Safety in 2026: What Lab Tests Show

Fidelity Investments Review 2026: SPAXX Yields & Zero-Fee Funds

Motley Fool Stock Advisor Review 2026: Worth $99/Year?

American Airlines Trump Accounts Matching: $2,000 Kids Benefit

British Man Recovers £3.3M Lost Bitcoin After 12 Years

The Global AI Export War: How the Fable 5 Shutdown Is Reshaping Startup Strategy

CHIPS Act and Intel’s Crisis: How Interest Rates Threaten US Chip Manufacturing

MacKenzie Scott vs. Jeff Bezos: The $26 Billion Philanthropy Paradox Explained

State Farm’s $5B Dividend 2026: Who Qualifies & Payout Dates

Top 15 Financial Stocks for Investment in PSX

US-China Relations in Q3 2026: Trade Tariffs and Supply Chain Risks

Gold’s Wild 2026: From a Record $5,600 Peak to a 24% Crash and Back Toward $4,500

Oil Surges as Strait of Hormuz Traffic Collapses Again

Pakistan IMF Program 2026: Inside the Push Toward an Interest-Free Economy

Gold Price 2026: Why Bullion Has Fallen 25% From Its January Record High

Russia Oil Revenue 2026: How Sanctions on Rosneft and Lukoil Are Draining the War Chest

SpaceX Stock Lockup Expiration Explained: Why $123B in Shares Could Hit the Market

Russia Oil Revenue 2026: The Iran War Windfall and What a Hormuz Deal Means for Moscow

The Rocket That Won’t Quit: Inside SpaceX’s Falcon 9 Launch Machine

China Economy 2026: How AI Exports and a Property Crash Are Splitting Growth in Two

Canada US Trade War 2026: Inside Carney’s Push to Cut Ties With Trump’s Tariffs

Pakistan Economy 2026: Why GDP Growth Isn’t Reaching Ordinary Households
-

 Markets & Finance8 months ago
Top 15 Stocks for Investment in 2026 in PSX: Your Complete Guide to Pakistan’s Best Investment Opportunities
-

 Analysis6 months ago
Johor’s Investment Boom: The Hidden Costs Behind Malaysia’s Most Ambitious Economic Surge
-

 Analysis7 months ago
Top 10 Stocks for Investment in PSX for Quick Returns in 2026
-

 Analysis7 months ago
Brazil’s Rare Earth Race: US, EU, and China Compete for Critical Minerals as Tensions Rise
-

 Banks8 months ago
Best Investments in Pakistan 2026: Top 10 Low-Price Shares and Long-Term Picks for the PSX
-

 Investment8 months ago
Top 10 Mutual Fund Managers in Pakistan for Investment in 2026: A Comprehensive Guide for Optimal Returns
-

 Global Economy8 months ago
15 Most Lucrative Sectors for Investment in Pakistan: A 2025 Data-Driven Analysis
-

 Global Economy8 months ago
Pakistan’s Export Goldmine: 10 Game-Changing Markets Where Pakistani Businesses Are Winning Big in 2025