
Analysis
Sales of Used EVs Surge in US as Petrol Prices Pass $4 a Gallon oil

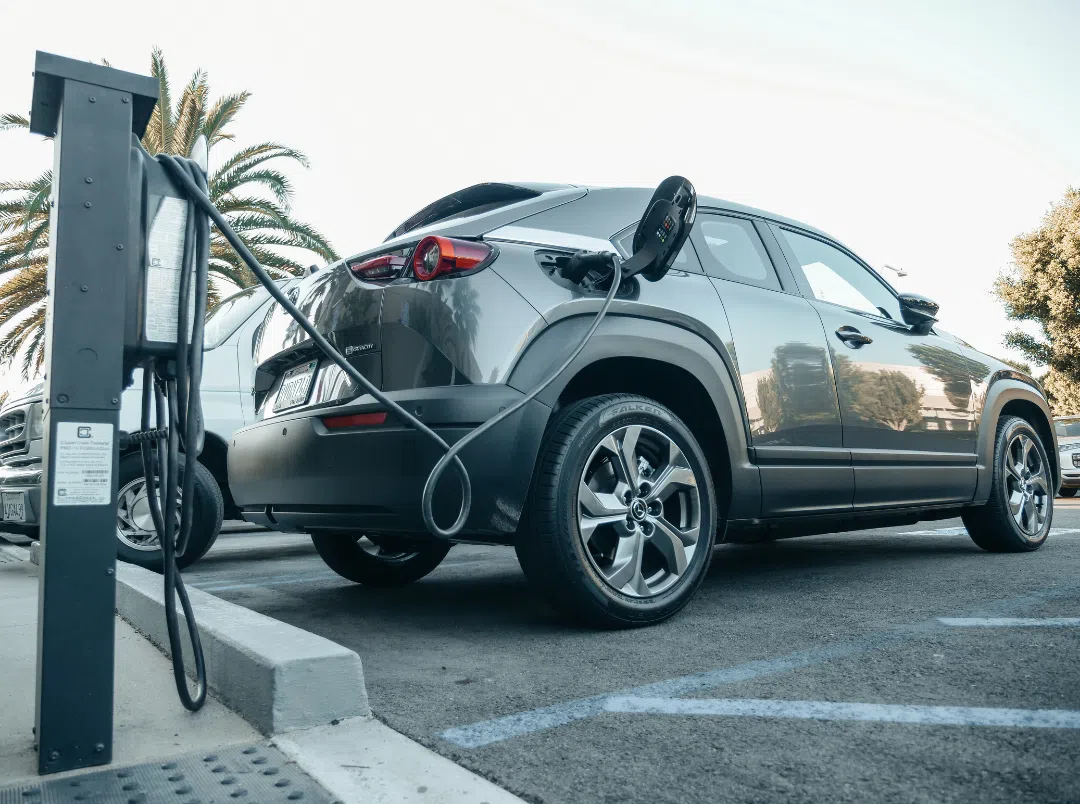
The Pump That Changed Everything
Picture this: a Torrance, California dealership lot on a Tuesday morning in late March. A 34-year-old nurse named Diana Reyes stares at the window sticker on a three-year-old Tesla Model 3. The price — $29,400 — is roughly what she’d pay for a mid-trim Honda CR-V at the lot across the street. Behind her, the Chevron station on Pacific Coast Highway is already flipping its sign to $5.97. She has done the math on the back of a receipt: at her commute distance, she’d save north of $280 a month on fuel alone. She swipes her card for the deposit.
Diana is not a climate activist. She is not a tech early adopter. She is a cost-conscious middle-class consumer responding to a price signal as rational and ancient as economics itself. And right now, across the United States, millions of Americans are doing exactly what she did — and their aggregate decision is writing the most consequential energy story of 2026.
The used EV market is booming. Market forces — not Washington subsidies — are finally cracking open mass electrification. Yet, simultaneously, a parallel drama is unfolding 5,000 miles east in Brussels, where the European Commission is sounding alarm bells of a different kind: warning its 27 member states that their instinct to throw fiscal relief at surging energy costs could detonate a sovereign debt crisis more damaging than the energy shock itself. This is the dual-screen picture of the global energy transition at its most volatile, its most promising, and its most perilous — all at once.
Section 1: The Used-EV Surge Is Real, It’s Big, and It’s Just Getting Started
The data landed this week and it is striking. According to Cox Automotive, 93,500 used EVs were sold in the first quarter of 2026 — a 12% year-over-year jump, with January and February volumes running even higher in some regional markets. CarGurus, the automotive analytics platform, reported a 40% spike in views on used EV listings since gas prices began their Iran-war-driven ascent, with Tesla Model 3 searches alone surging 52%. Edmunds data showed electrified vehicle research hitting 23.8% of all car-shopping activity in the week of March 9–15 — the highest weekly share of 2026.
But the deeper story is structural, not cyclical. This isn’t merely a knee-jerk search spike that evaporates when oil settles. This surge has a supply-side foundation that didn’t exist in 2022.
Price parity has effectively arrived for used EVs. Cox Automotive’s January 2026 data puts the average transaction price for a used EV at $34,821 — just $1,334 more than a comparable used internal combustion vehicle, down from a gap exceeding $10,000 just two years ago. Even more telling: Recurrent, which tracks EV ownership economics, reports that 56% of used EVs now list below $30,000, and some late-model off-lease units are clearing at $19,000–$22,000 — price points that, factoring in fuel and maintenance savings, make them the cheapest vehicles to own in American history.
Why the flood of affordable inventory? Three words: the lease wave. Between January 2023 and September 2025, manufacturers and dealers pushed more than 1.1 million EVs through lease structures, leveraging a commercial vehicle tax credit loophole that delivered the full $7,500 federal incentive without consumer income caps. Those leases are now maturing. Cox projects EV and plug-in hybrid returns will account for nearly 20% of all lease returns in 2026, with monthly volumes expected to reach roughly 50,000 units by late 2027. Jeremy Robb, Cox’s Chief Economist, framed it bluntly: “The point we’ve been trying to make to dealers for the last few years is that if you are dependent on a 3-year-old car, the cars you’re going to get your hands on are EVs.”
This isn’t the trickle-down economics of expensive Tesla Model S units filtering to the aspirational class. This is a structural democratisation of electric mobility — the 2023-vintage Hyundai IONIQ 5, Chevy Bolt EUV, and Volkswagen ID.4 cascading into the mainstream used-car market at prices the median American household can actually consider.
And the operating economics are extraordinary. At the national average residential electricity rate of roughly $0.17 per kWh, a home-charged EV costs approximately $0.05 per mile to run. A gasoline car averaging 30 mpg costs around $0.13 per mile at $4 a gallon. For the average driver logging 12,000 miles annually, that gap translates to roughly $960 in annual fuel savings — before accounting for roughly $1,000 less in annual maintenance costs on an EV (no oil changes, fewer brake jobs, simpler drivetrain). As one Detroit driver quoted by PBS News put it: “Electricity can go up, but it won’t go up nearly as much as gas and it won’t go up nearly as fast, either.”
The irony — sharp and worth dwelling on — is that new EV sales are collapsing even as used ones boom. Cox Automotive reports new EV sales fell 28% year-over-year in Q1 2026 to just 213,000 units, dragging the new EV share down to 5.8% of the market. The death of the $7,500 federal tax credit last September, combined with new-vehicle average transaction prices near $48,766 and average new-car loan APRs hitting 7.0% (up from 4.4% in early 2022), has rendered new EVs simply unaffordable for the median buyer. But the used market has stepped into the breach — organically, without a government nudge — and that matters enormously for how we think about the energy transition.
Section 2: The Geopolitical Detonator — Iran, Hormuz, and the $100 Barrel
The trigger for the current price shock is specific, violent, and consequential in ways that differentiate it sharply from 2022.
On February 28, 2026, U.S. and Israeli airstrikes targeting Iranian nuclear and military infrastructure ignited a conflict that has since significantly disrupted oil and gas flows through the Strait of Hormuz — the narrow maritime chokepoint through which roughly 20% of global oil supply transits daily. The results at American pumps have been swift and severe. According to AAA, the national average price of regular gasoline crossed $4.02 per gallon on March 31 — a 35% jump from the $2.98 average recorded the day before the war began. By April 3, it had climbed further to $4.09. Diesel reached $5.45 per gallon, a 45% rise. California hit $5.87 per gallon, with some coastal counties brushing $6.20. Global oil benchmarks surpassed $100 a barrel — a level not sustained since mid-2022.
This differs from the 2022 Russia-Ukraine shock in critical ways. The Ukraine crisis triggered a supply-destruction event: Russian gas physically stopped flowing through pipelines to Europe, forcing structural changes to the continent’s energy infrastructure. The Iran conflict is, at its core, a chokepoint disruption — a partial throttling of maritime flows whose ultimate duration and severity depend on military developments that no analyst can confidently forecast. Energy Commissioner Dan Jørgensen told the Financial Times with unusual bluntness: “This will be a long crisis. Energy prices will be higher for a very long time.”
But for American consumers, the distinction barely registers at the pump. What matters is that in the first 17 days of the Iran crisis, the EU alone spent approximately €6 billion more on fossil fuel imports than it would have at pre-war prices. In the US, the household energy pain is already measurable: at $4 per gallon, the average American household spending 50–60 gallons monthly now faces a $240 monthly fuel bill — the equivalent of about a third of the average new-car payment.
That is the price signal that is driving Diana Reyes and hundreds of thousands of Americans like her toward used EV lots. And unlike previous gas-price spikes — notably in 2022, when EV search traffic jumped but sales barely budged — the structural conditions are different now. The used EV market is four times larger than it was in 2020. Off-lease supply is flooding the market. Prices have reached genuine parity. The 2026 surge has a foundation the 2022 spike lacked entirely.
Section 3: Brussels Sounds the Alarm — Fiscal Discipline in the Face of Political Temptation
The scene in Brussels is both more complicated and more ominous.
On March 31, as American gas stations were ticking past $4, EU Energy Commissioner Dan Jørgensen convened an emergency meeting of European energy ministers and issued a blunt warning: “We need to avoid fragmented national responses and disruptive signals to the market to avoid worsening supply and demand conditions.” European gas prices had surged more than 70% since February 28. Oil prices had risen over 60%. EU import bills for fossil fuels had climbed by €14 billion since the conflict began. Electricity prices were spiking as gas-fired power generation became dramatically more expensive.
The political reflex in several European capitals was immediate and entirely predictable: fuel tax cuts, blanket price caps, energy subsidies for all. Five finance ministers — from Germany, Italy, Spain, Portugal, and Austria — wrote jointly to Climate Commissioner Wopke Hoekstra demanding an EU-wide windfall tax on energy companies, with revenues earmarked for broad consumer relief.
Here is where the EU’s response becomes both admirable in its caution and essential as a lesson for policymakers globally. Brussels pushed back — firmly. A European Commission document seen by this columnist warned that any fiscal response must be “targeted and fiscally sustainable,” with explicit sunset clauses. The Commission’s own analysis of the 2022–23 response is damning: EU governments spent €651 billion shielding citizens from that energy shock, but only 27% of those measures were properly targeted — nearly three-quarters went to blanket price controls and tax cuts that benefited wealthy households as much as vulnerable ones. The Commission’s draft guidance put it plainly: income measures that protect the most vulnerable without distorting price signals are “a preferred option” — but they “require precise targeting to avoid ineffective support and excessive fiscal burden.”
The fiscal stakes could not be higher. European gas storage levels entering April stood at just 29% on average — near the lowest levels since 2022, with France and Germany at 22% and the Netherlands at a harrowing 9%. Refilling storage ahead of winter 2026–27 at elevated LNG prices could cost member states tens of billions of euros on top of any consumer subsidy programs. Meanwhile, Jørgensen is explicitly warning that Brussels is not yet in a “security of supply crisis” — but the situation could deteriorate sharply “for some more critical products in the weeks to come.”
The political economy of energy subsidies is seductive. Cutting fuel taxes is fast, visible, and electorally popular. It is also, as the IEA noted explicitly in its response to the current disruption, “economically counterproductive” — it suppresses the very price signal that is driving Americans toward used EVs right now. The EU’s own history should be its cautionary guide: after 2022, the bloc emerged with strained public finances, elevated inflation, and — crucially — no structural reduction in fossil fuel dependence. Wind and solar generation did reach a milestone in 2025, supplying more EU electricity than fossil fuels for the first time. But that transition took years of investment. It cannot be shortcut by a crisis response that bails out fossil fuel consumption while undermining the market signals that make clean energy economically rational.
Section 4: The Big Picture — Market Forces vs. Policy Dependency, and What It Reveals
Stand back and the transatlantic contrast is instructive.
In the United States, the used-EV surge is happening without policy support. The federal $7,500 used clean vehicle credit expired in September 2025. Many state programs have been rolled back. The Trump administration has been publicly hostile to EV mandates. And yet: 93,500 used EVs sold in a single quarter, prices at near-parity with gas cars, 40% spikes in search traffic. The market is doing what markets eventually do when the economics align — it is allocating.
This is not an argument against policy. The lease wave that is now flooding the used market with affordable EVs was itself a product of the Inflation Reduction Act’s commercial vehicle credit, which expired last year. The IRA planted a tree whose shade we are now sitting in. But the crucial point is that the energy transition has now reached an inflection point where market forces are self-sustaining in the used-vehicle segment — and that changes the policy calculus entirely.
Europe’s path has been different: heavily policy-driven, with aggressive subsidy programs, ETS carbon pricing, and binding fleet emission targets pushing manufacturers toward EVs regardless of consumer demand. The result has been faster headline new-EV penetration rates than the US in most years — but at enormous fiscal cost and with growing political backlash. As the current crisis reveals, Europe’s structural vulnerability to fossil fuel price shocks remains profound, because the transition at the household consumption level — particularly for heating and road transport — remains incomplete. Europe’s EV market is doing well on new sales; its political resilience to energy shocks is doing poorly.
The irony is exquisite: the US, which largely dismantled its EV policy architecture over 2025–26, is seeing organic used-EV adoption surge in direct response to market price signals. Europe, which built an elaborate policy architecture to force the transition, is now being tempted to undermine those very price signals with blanket subsidies to blunt the shock. The US approach — messy, market-driven, inequitable in its distribution of early adopters — is producing a more durable behavioral shift at the household level than anyone in Brussels expected.
That said, I do not romanticise the American situation. The 28% collapse in new EV sales is a genuine problem for the long-term industrial pipeline. Ford has abandoned the F-150 Lightning. Volkswagen shuttered the ID. Buzz in the US market. If current trends persist, the US auto industry will fall so far behind Chinese and European manufacturers on EV technology that the eventual policy correction — and there will be one — will be far more expensive. The used-EV surge buys time. It does not substitute for a coherent industrial policy.
And for middle-class buyers specifically, this moment is transformational. For the first time in the history of the automobile, the cheapest new category of vehicle to own — measured over a five-year total cost of ownership — is a used electric car. That is not a green talking point. That is arithmetic. The democratisation of electrification is underway, not because governments planned it, but because depreciation curves, lease mathematics, and a war in the Persian Gulf conspired to make it inevitable.
Section 5: What Policymakers on Both Sides of the Atlantic Should Do — Right Now
The current moment demands precision, not reflex. Here are five policy recommendations I believe the evidence supports:
1. Targeted used-EV incentives — not blanket EV subsidies. The US should introduce a means-tested used EV credit capped at $3,000 for buyers earning below the median household income. Unlike the $7,500 new-vehicle credit that largely benefited upper-middle-class buyers of $55,000 Teslas, a well-targeted used-EV credit would accelerate the democratisation already underway — putting affordable zero-emission transportation into the hands of the households most hurt by $4 gasoline. The cost would be a fraction of the IRA’s original EV spend.
2. Windfall taxes, yes — but revenues earmarked for the transition, not fuel subsidies. The EU finance ministers calling for an energy windfall tax are right on the mechanism, wrong on the application. Revenues should fund targeted income transfers to energy-poor households and accelerated grid investment — not blanket fuel price caps that suppress the incentive to switch. The precedent the UK set with its energy profits levy in 2022 is worth revisiting: structured correctly, it raised tens of billions without strangling investment.
3. Strategic petroleum reserves as a buffer, not a bailout. Both the US and EU should coordinate a calibrated release from strategic reserves — sufficient to blunt the sharpest price spikes and give consumers time to adjust, but not large enough to eliminate the price signal that is driving behavioral change. The IEA’s coordinated response mechanism exists precisely for this scenario. Use it sparingly and visibly.
4. Accelerate the used-EV dealer ecosystem. Half the battle in used-EV adoption is dealer education and charging infrastructure at the point of sale. Federal and state programs should fund training grants for independent used-car dealers — who move the majority of used vehicles in the US — to understand EV battery health, range characteristics, and home charging installation. The NIADA Convention is already moving in this direction; government should amplify it.
5. Defend the price signal — in Europe especially. The single most damaging thing Brussels could do right now is cave to political pressure for untargeted fuel tax holidays. The IEA is clear on this. Bruegel is clear on this. The Commission’s own internal guidance is clear on this. The price of gasoline and diesel should be high enough to make EVs the rational choice — that is the energy transition working as designed. The task of government is not to eliminate that signal but to ensure that its burden falls equitably, through income transfers that leave market prices intact.
Conclusion: The Pump Is the Policy
In the end, the story of Diana Reyes at that Torrance Tesla lot is the story of the energy transition as it actually works — not as it was planned in think-tank white papers or EU Green Deal annexes, but as it unfolds in the friction between geopolitics, market prices, and household balance sheets.
The used-EV surge is proof of concept: when the economics align, Americans choose rationally. The EU’s fiscal warning is equally valid: when governments panic, they reach for the subsidy bazooka and end up subsidising the problem they’re trying to solve. The Iran war didn’t create this inflection point — it merely illuminated it.
The energy transition was always going to be won or lost at the point of sale, in the mind of a buyer doing the math on a monthly car payment. We are, for the first time, winning that argument in the used-car lot. Whether policymakers on both sides of the Atlantic are wise enough to let the market keep making that case — while protecting only those who genuinely cannot afford to participate — will determine whether this moment becomes a turning point or merely another headline that faded when oil prices did.
History, unfortunately, gives us reason for both hope and doubt.
Discover more from The Economy
Subscribe to get the latest posts sent to your email.



Key Takeaways
- Rolex’s secondary market rose approximately 7.9% year-over-year as of 2026 (per WatchCharts data) — trailing Patek Philippe (+16.2%) and Tudor (+11.4%) but still outperforming Audemars Piguet (+3.4%).
- Rolex raised U.S. retail prices 4–9% in January 2026 (steel models ~5.6%, gold models ~8.7%), narrowing the historical gap between retail and pre-owned pricing.
- Not every model appreciates: steel sports references (Submariner, GMT-Master II, Daytona) have held value far better than two-tone or widely available dress references like the standard Datejust.
- The Lady-Datejust posted the sharpest 2026 gain among tracked collections — up 22.73%, from roughly $9,269 to $11,376 — driven by demand for smaller, “everyday luxury” watches.
- Gold’s rise past $2,400/oz has directly lifted the investment case for Rolex’s precious-metal references (Day-Date, Sky-Dweller, Yacht-Master).
The Model-by-Model Picture
| Category | 2026 Trend |
|---|---|
| Lady-Datejust | +22.73% (strongest performer among tracked collections) |
| Steel sports models (Submariner, GMT-Master II) | Held value well; corrected from 2022 peak but stabilized above retail |
| Daytona | Corrected from highs above $50,000 to the mid-$30,000s; still among the most sought-after references |
| Two-tone/widely available Datejust | Flat to negative — “holds value” is an overstatement for this category |
| Gold references (Day-Date, Sky-Dweller) | Lifted by gold’s rise above $2,400/oz |
Why the “Rolex Always Appreciates” Myth Is Fading
The pandemic-era boom pushed some references — the Daytona above all — to speculative highs disconnected from historical norms. Since the March 2022 peak, steel sports models have compressed meaningfully, and dealers who bought inventory near the top have in some cases faced 20–40% markdowns on liquidation. The lesson for 2026 buyers: Rolex as a category is not a monolith. Value retention depends heavily on specific reference, condition, and whether the piece comes with box and papers (“full set”).
What’s Actually Driving 2026 Strength
- Retail price increases raise the floor. When a new Submariner retails at $10,050 (up from $9,500), a pre-owned example at $11,000–$12,000 suddenly represents a smaller premium — narrowing the gap without secondary prices actually moving.
- Supply discipline remains Rolex’s core lever. The brand has never confirmed production numbers, and secondary-market premiums remain entirely a function of Rolex’s own manufacturing decisions — a risk factor as much as a support.
- Certified Pre-Owned rollout. Rolex’s now fully rolled-out CPO program has changed how buyers transact in the used market, adding a layer of brand-verified legitimacy that supports pricing.
The Case for Rolex as a Portfolio Diversifier
Financial advisors increasingly frame luxury watches not as a replacement for equities or bonds, but as a tangible, historically low-correlation diversifier — one that carries its own risks (illiquidity, condition-dependent pricing, no yield) but has demonstrated multi-decade resilience for specific references.
Is Rolex a good investment in 2026?
It depends heavily on the specific reference. Steel sports models like the Submariner and Daytona have held or grown in value; two-tone and widely available dress models generally have not. Overall, Rolex’s secondary market rose about 7.9% year-over-year in 2026, trailing Patek Philippe but ahead of Audemars Piguet.
Discover more from The Economy
Subscribe to get the latest posts sent to your email.

Navigating Mortgage and Loan Refinancing in a High-Yield Environment
Global public debt crossing critical thresholds has kept central bank policies volatile, resulting in fluctuating US Treasury yields throughout 2026. For homeowners and commercial property holders burdened by previous high-interest borrowing cycles, finding optimal refinance windows has become a high-stakes financial puzzle. Stalled disinflation and stubborn employment numbers mean rate cuts are incremental, requiring borrowers to act with precision.
Timing your mortgage or commercial loan refinance in this environment requires a deep understanding of yield curve movements and lender risk appetites.
Decoding 2026 Refinance Dynamics
The 10-Year Treasury Yield Benchmark
Mortgage rates continue to track closely with the 10-year US Treasury yield. When macroeconomic anxiety spikes debt issuance, yields rise, tightening consumer borrowing capacity. Savvy borrowers monitor weekly Treasury auctions to lock in rates during brief dip windows.
Hybrid ARMs and Alternative Structures
With fixed rates remaining elevated, 7/1 and 10/1 adjustable-rate mortgages (ARMs) have surged in popularity. These products offer lower initial monthly payments, giving borrowers breathing room until central bank easing cycles fully materialize.
| Loan Product | Current Rate Range | Best For | Key Risk Factor |
| 30-Year Fixed Mortgage | 6.2% – 6.8% | Long-term predictability | Higher initial monthly outlay |
| 7/1 Hybrid ARM | 5.5% – 5.9% | Short-term ownership / flipping | Rate reset risk after year 7 |
| Commercial Refinance | 7.0% – 8.2% | Corporate asset restructuring | Strict DSCR lender covenants |
Actionable Steps for Successful Refinancing
To maximize your chances of securing favorable refinance terms in a volatile market, follow a disciplined preparation strategy.
Boost Your Credit Score Immediately: Lenders in 2026 are applying stringent credit tiering; a 20-point increase can drop your APR by a crucial quarter-point.
Shop Regional Credit Unions: Smaller financial institutions often offer portfolio loans with more flexible underwriting than major national banks.
Calculate the Break-Even Point: Ensure your total closing costs are recouped through monthly savings within 24 months of closing.
“Market Strategist View: Refinancing in 2026 is an exercise in opportunistic timing. Borrowers must maintain immaculate financial profiles ready to strike the moment Treasury yields dip.”
Mastering the complexities of today’s debt environment ensures you can successfully lower your debt service costs and protect your long-term financial stability.
Discover more from The Economy
Subscribe to get the latest posts sent to your email.

The days of pulling generic auto insurance quotes based purely on your zip code and age are officially over. In 2026, insurance comparison engines are powered entirely by generative AI and real-time telematics. These platforms digest thousands of live data points—ranging from your driving smoothness via connected vehicle sensors to real-time traffic congestion patterns—to generate hyper-personalized premiums instantly.
For consumers, this evolution represents both a massive opportunity for savings and a hidden trap for penalty pricing. Understanding how AI algorithms evaluate risk is essential for anyone looking to lower their monthly auto insurance premiums.
How AI Comparison Engines Evaluate Your Risk Profile
Behavioral Telematics and Connected Cars
Modern cars stream performance data directly to insurance aggregators. Generative AI models analyze braking sharpness, acceleration curves, cornering G-forces, and phone distraction metrics. Drivers who maintain smooth, defensive habits are rewarded with dynamic rate cuts of up to 40% compared to traditional rating tiers.
Predictive Traffic and Weather Modeling
AI tools now cross-reference your daily commute route with predictive weather and accident probability models. If your standard parking location or driving corridor has a statistically higher incidence of uninsured motorist claims, your quotes will reflect that hyper-local risk assessment.
| Comparison Factor | Traditional Rating Model | 2026 Generative AI Model | Impact on Premium |
| Mileage & Usage | Annual estimated odometer reading | GPS tracking & live trip duration | High (up to 35% savings) |
| Driving Behavior | MVR driving record & accidents | Real-time braking, speed, & G-force | Critical (determines tier) |
| Vehicle Tech | Make, model, and safety rating | ADAS calibration & repair cost data | Moderate |
Strategies to Lower Your AI-Driven Insurance Quote
To outsmart the algorithm and secure the lowest possible premium in 2026, drivers must proactively manage their digital footprint on insurance platforms.
Opt-In for Telematics Trial Periods: Many insurers offer immediate 15% discounts just for installing their driving app; let it track safe habits for 30 days to lock in permanent savings.
Scrub Unverified Public Records: Ensure your motor vehicle report is free of clerical errors that AI risk models misinterpret as reckless behavior.
Compare AI Aggregators: Use platforms that integrate multi-carrier API feeds rather than single-brand comparison sites to find the best risk-adjusted rate.
“Industry Note: AI-driven pricing rewards transparency and precision. Drivers who actively manage their telematics data consistently out-save those relying on legacy quote calculators.”
Embracing AI comparison tools allows savvy policyholders to customize coverage limits precisely to their driving habits, eliminating wasted premium spend while ensuring robust protection.
Discover more from The Economy
Subscribe to get the latest posts sent to your email.

US–China AI Export Controls in 2026: Chips, Testing Rules and Corporate Risk

World Trade in 2026: Tariffs, Supply Chains and the Cost of Fragmentation

Global Economy Outlook 2026–27: What to Watch Ahead of the IMF October Report

Strait of Hormuz in 2026: Why Shipping Risks Matter for Oil, Insurance and Food Prices

US–China Critical Minerals Competition in 2026: Who Controls the Supply Chain?

Oil and Diesel Prices in October 2026: How Supply Shocks Can Reach Inflation

AI Chip Demand in 2026: What TSMC, Nvidia and Data-Center Spending Reveal

Q3 2026 Earnings Season: The Bank, AI and Consumer Signals That Really Matter

Treasury Yields in 2026: Why Higher Bond Rates Matter for Stocks, Mortgages and Savings

KOSPI 2026: Why South Korean Stocks Turned Volatile and What AI Investors Should Watch

IREN Stock in 2026: AI Cloud Growth, Bitcoin Transition and the Risks Investors Miss

Stock Market Crash in 2026? Warning Signs, Scenarios and a Calm Investor Checklist

Peso Mexicano vs Dólar Estadounidense: A Practical USD/MXN Guide for October 2026

Is the Stock Market Open on Columbus Day 2026? NYSE, Nasdaq and Bonds Explained

China Stocks Today: Are Big Economies in Asia Nearing a Market Bottom?

World’s Largest Economies: Ranking the Top Global Powers

Global Pension Systems Ranked: The World’s Best and Worst Retirement Frameworks

Elon Musk’s Next Moves: Disrupting the 2026 Global Economy

Crude Oil & Petroleum Market Analysis: OPEC+ Decisions and Price Forecasts

Pakistan Economy 2026: Inside the SBP’s Balancing Act

GasBuddy Market Insights: How Crude Price Shifts Impact Local Fuel Cost Averages

Global Equity Market Divergence: US Tech vs. European Dividend Stocks vs. Asian Growth

IMF & World Bank Global Economic Outlook: Growth Forecasts Across Europe and Asia

Silver Price Today: Why the Xi-Trump AI Standoff Is Fueling a Safe-Haven Rally

Bitcoin Price Forecast 2026–2027: Will the 4-Year Cycle Hold?

The Future of Silicon: Supply Chain Vulnerabilities in the 2026 Tech Sector

Asian Stock Markets 2026: Japan, China, Pakistan & More

Stagflation vs. Soft Landing: How Central Bank Rates Are Reshaping European and Asian Economies
-

 Markets & Finance9 months ago
Top 15 Stocks for Investment in 2026 in PSX: Your Complete Guide to Pakistan’s Best Investment Opportunities
-

 Analysis8 months ago
Johor’s Investment Boom: The Hidden Costs Behind Malaysia’s Most Ambitious Economic Surge
-

 Analysis8 months ago
Top 10 Stocks for Investment in PSX for Quick Returns in 2026
-

 Banks9 months ago
Best Investments in Pakistan 2026: Top 10 Low-Price Shares and Long-Term Picks for the PSX
-

 Analysis8 months ago
Brazil’s Rare Earth Race: US, EU, and China Compete for Critical Minerals as Tensions Rise
-

 Investment9 months ago
Top 10 Mutual Fund Managers in Pakistan for Investment in 2026: A Comprehensive Guide for Optimal Returns
-

 Global Economy10 months ago
15 Most Lucrative Sectors for Investment in Pakistan: A 2025 Data-Driven Analysis
-

 Global Economy10 months ago
Pakistan’s Export Goldmine: 10 Game-Changing Markets Where Pakistani Businesses Are Winning Big in 2025