
Global Economy
PSX Bull Run 2025: Why Pakistan’s Market Is Suddenly on Every Global Radar

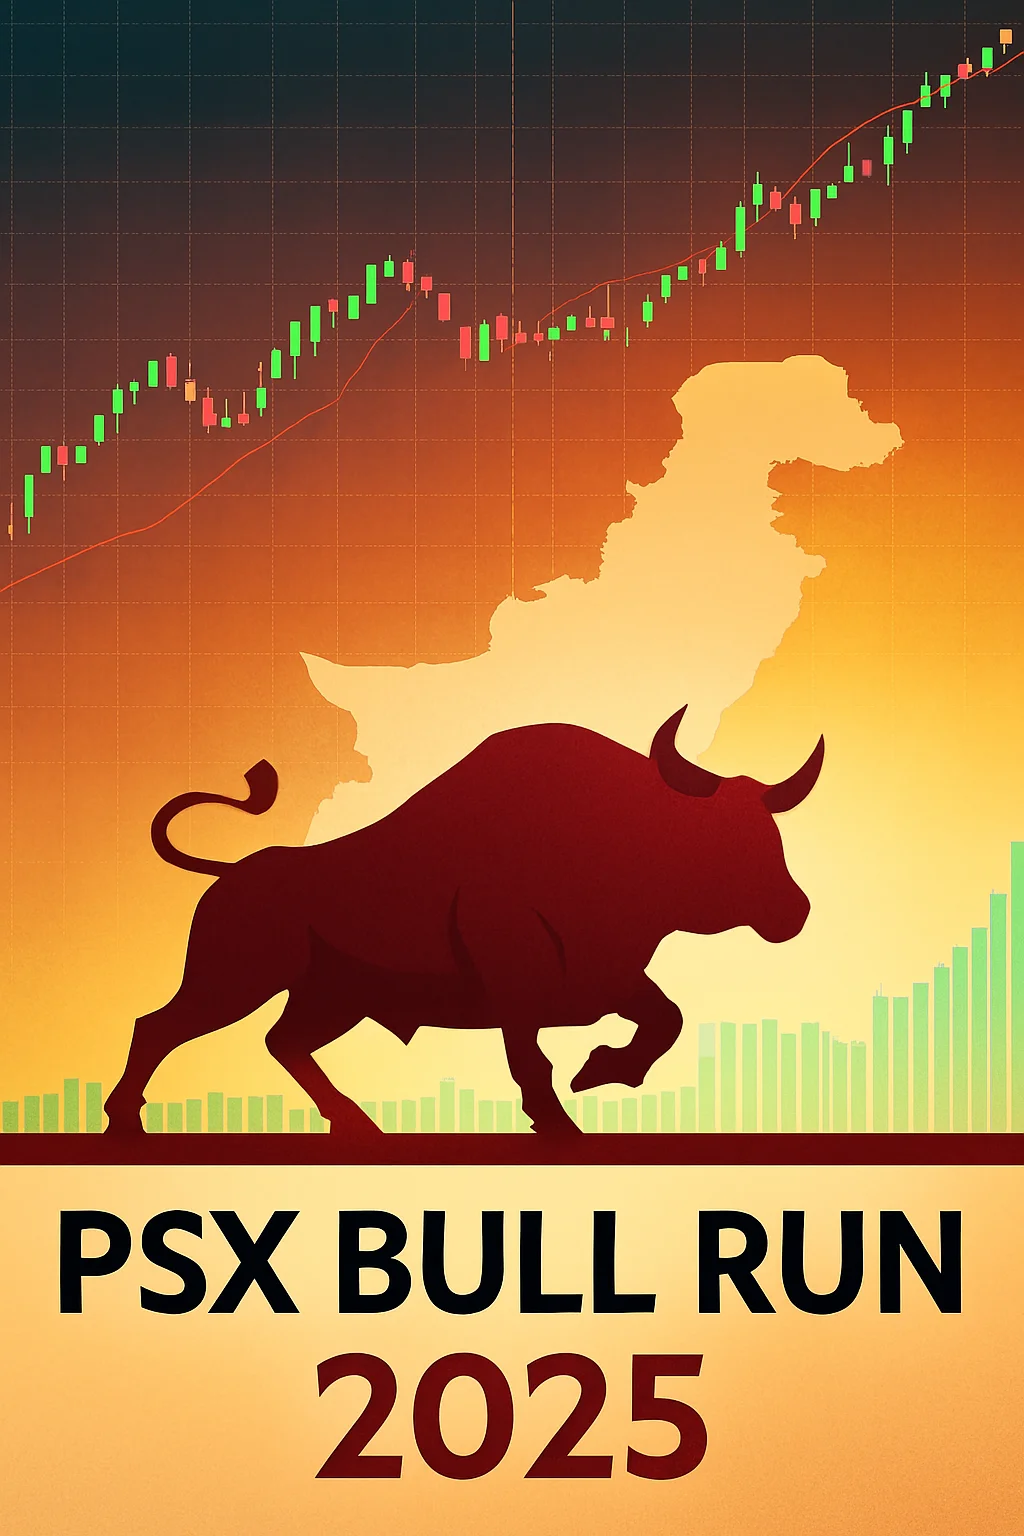
By any conventional metric, Pakistan should not be leading the pack of global equity returns in 2025. It is a frontier‑to‑emerging‑market hybrid with a long history of fiscal slippage, external vulnerability, and political volatility. Yet the Pakistan Stock Exchange (PSX) has staged one of the most remarkable bull runs in its modern history, turning what was once seen as a high‑beta, crisis‑prone market into a surprising outperformer.
From late 2024 into 2025, the benchmark KSE‑100 index has powered through successive resistance levels, with rallies often accompanied by surging trading volumes and broad‑based sector participation. In December 2025, the index is trading near record territory, with cumulative returns that put it ahead of many larger emerging markets. The question that investors—domestic and foreign alike—are now asking is straightforward: what is really fueling this confidence, and is it sustainable?
The answer lies at the intersection of macroeconomic stabilization, monetary policy recalibration, geopolitical risk repricing, and underappreciated structural changes in market infrastructure and participation. The PSX rally is not just a story of “cheap valuations”; it is a case study in how a market moves from the brink of recurring crisis to a cautiously credible recovery narrative.
From Crisis Narrative to Reform Story
For much of the past decade, Pakistan featured in headlines for all the wrong reasons: balance‑of‑payments stress, repeated IMF engagements, a sliding currency, and a persistent trust deficit between policymakers and markets. The 2022–2023 period in particular cemented perceptions of Pakistan as a perennially fragile economy, with the KSE‑100 under heavy pressure, foreign investors exiting, and the rupee in freefall.
The turning point began when the government—under intense domestic and external pressure—finally embraced orthodox stabilization. Subsidies were cut, energy prices adjusted, tax measures introduced, and a new IMF program negotiated. Painful as they were, these steps helped achieve three critical outcomes:
- Inflation peaked and started to trend lower, reducing the sense of macroeconomic freefall.
- Foreign exchange reserves stabilized, even if at modest levels, helped by concessional inflows, remittances, and controlled imports.
- The rupee found a floor, with volatility subdued relative to the worst of the crisis period.
By late 2024 and into 2025, investors began to see a discernible shift in narrative: from “Pakistan might default” to “Pakistan has bought time and breathing space.” For equity markets, this distinction is enormous. A market that survives the worst‑case scenario often gets repriced, not merely to reflect current fundamentals, but on the expectation that the worst risks have already been realized.
Monetary Policy: From Punishing to Supportive
No bull market in a macro‑fragile country is possible without a visible pivot in monetary policy. Pakistan’s central bank spent years running one of the most aggressive tightening cycles in the region. Policy rates were kept high to rein in inflation, defend the currency, and signal seriousness to international creditors and the IMF.
By 2025, that phase had largely run its course. With inflation finally decelerating—helped by base effects, moderation in global commodity prices, and domestic demand compression—the State Bank had room to shift gears. Even the anticipation of rate cuts was enough to move markets.
For equity investors, particularly those running discounted cash flow (DCF) models, the implication of a lower policy rate is straightforward:
- Lower discount rates increase the present value of future corporate earnings.
- Reduced borrowing costs improve profitability, especially for capital‑intensive firms.
- Portfolio rebalancing favors equities as the relative attractiveness of fixed‑income instruments declines.
Banks, in particular, benefited from a complex but favorable combination: they had enjoyed windfall gains during the high‑rate period via elevated yields, and now stood to gain from an eventual revival in credit growth as rates normalized. The market began to price in this dual advantage.
For foreign investors, a credible path to lower inflation and easing rates was a signal that Pakistan’s macro orthodoxy was returning. It reduced the perceived probability of a disorderly adjustment and improved the risk‑reward profile of the PSX relative to peers.
Earnings, Valuations, and the “Re‑Rating” of Pakistan
The PSX was not simply rising on the back of sentiment; it was rebounding from deeply depressed valuation levels. In the worst periods of the crisis, the KSE‑100 traded at price‑to‑earnings multiples that were not merely low—they were indicative of a market priced for failure.
As macro conditions stabilized, several factors drove a re‑rating:
- Corporate earnings proved more resilient than feared. Exporters benefited from a weaker rupee, remittance‑linked consumption held up reasonably well, and large conglomerates demonstrated cost discipline.
- Banks and energy names, long seen as systemically exposed, adjusted to new regulatory and fiscal realities.
- A handful of listed companies continued to deliver strong free cash flows, even under stress, reinforcing the idea that Pakistan hosts pockets of world‑class businesses despite the macro noise.
When a market trades at distressed multiples for too long, it only takes a modest shift in the macro narrative to trigger a sharp upside move. That is precisely what happened in 2025. Rising earnings, combined with still‑reasonable valuations, created the conditions for a powerful bull run once capital began to return.
Sector‑Wise Drivers: Where the Confidence Is Concentrated
Though broad‑based rallies make better headlines, serious investors know that bull markets are rarely uniform; they are led by sectors with convincing narratives. In the PSX’s 2025 rally, four clusters stand out.
1. Banking and Financials
Banks are at the heart of Pakistan’s financial system and often the first to react to shifts in policy. Investors saw a multi‑layered story:
- High yields on government securities previously padded earnings, providing a cushion through the worst of the crisis.
- Prospects of renewed private‑sector credit growth as rates normalize suggested new revenue opportunities.
- Improving asset quality, once the worst of the economic contraction passed, reassured analysts that non‑performing loans would not spiral out of control.
As risk premiums compressed, financials became core holdings in both domestic and foreign portfolios, amplifying the overall index move.
2. Energy and Utilities
Energy has long been central to Pakistan’s macro vulnerabilities: circular debt, price distortions, and under‑investment. By 2025, incremental steps to rationalize tariffs, streamline subsidies, and improve billing and recovery mechanisms gave investors hope that the sector was finally moving toward a more sustainable model.
Listed energy companies benefited from:
- Clearer tariff regimes
- Better prospects of receivables recovery
- Ongoing discussions on restructuring legacy obligations
This translated into multiple expansion and renewed investor interest—especially among institutions looking for yield and hard‑asset exposure.
3. Export‑Oriented Industrials and Textiles
Pakistan’s textile and export‑oriented sectors found themselves in a position to take advantage of global supply chain reconfiguration. As multinational firms continued to diversify away from over‑reliance on a single geography, countries like Pakistan—offering competitive labor, improving infrastructure, and trade links—stood to gain.
Exporters saw a double benefit: a weaker rupee improved price competitiveness abroad, while local cost structures, despite inflation, remained manageable relative to peers. The equity market responded by rewarding firms that demonstrated the ability to secure orders, move up the value chain, and reinvest in capacity.
4. Technology, Telecom, and the Digital Economy
The story of Pakistan’s tech and telecom sectors is more nascent but no less important. Rising connectivity, a young demographic profile, and government rhetoric around “Digital Pakistan” created a supportive backdrop for listed telecom firms and tech‑adjacent plays.
Although the PSX remains underweight on pure‑play tech relative to regional exchanges, increased interest in digital payments, fintech, and data services added a structural growth narrative to an otherwise traditional market.
The Infrastructure Beneath the Rally: Speed, Uptime, and Market Plumbing
One of the least discussed contributors to the PSX’s bull run has been its own quiet evolution as a trading platform. In the modern equity ecosystem, investor confidence is shaped not only by macro and policy, but by the perceived reliability, transparency, and efficiency of the venue itself.
Over recent years, the PSX has invested in:
- Improved trading engines and matching systems, capable of handling higher order volumes with lower latency.
- Better uptime and system reliability, reducing instances of market disruption, halts, or technical outages.
- Enhanced connectivity and co‑location services, enabling brokers and institutions to execute faster and more efficiently.
- Upgraded surveillance and compliance tools, improving the detection of abnormal trading behavior and bolstering market integrity.
While the PSX does not always broadcast granular metrics such as average execution time in milliseconds or annualized uptime percentages, the lived experience of market participants has changed. Days with exceptionally high volumes—where hundreds of millions of shares change hands—are now processed with fewer technical hiccups than in previous cycles. For sophisticated institutional investors, this matters: they are more willing to deploy large orders into a market whose “plumbing” they trust.
The cumulative effect of these improvements is subtle but powerful: liquidity begets liquidity. As more participants trade with confidence that the system will not fail them mid‑session, spreads tighten, depth improves, and the market becomes more investable for global funds.
Foreign Investors: From Capitulation to Gradual Re‑Entry
Foreign portfolio investors are often caricatured as fickle, but in reality, they respond to a combination of fundamentals, valuation, and global risk appetite. In Pakistan’s case, the 2025 bull run has coincided with several favorable global and local shifts:
- Global search for yield: As major central banks move from aggressive tightening to a more neutral or easing stance, capital begins to flow back into higher‑risk, higher‑return markets.
- Relative valuation appeal: When compared to other emerging and frontier markets, Pakistan’s equities, even after the rally, still look cheap on a historical and cross‑country basis.
- Perception of “risk already priced in”: After years of underperformance, many of the worst‑case scenarios—political disruption, fiscal slippage, external stress—were already reflected in prices. Any move away from the brink justifies re‑entry.
Flows remain measured rather than exuberant; foreign investors have not forgotten how quickly Pakistan can move from calm to crisis. But the direction of travel has shifted. Instead of being incremental net sellers, foreigners are selectively adding exposure in areas where earnings visibility is strong, governance is credible, and liquidity is sufficient.
Geopolitics and Regional Positioning: A Narrow Window of Stability
Markets do not trade in economic isolation. Pakistan’s 2025 rally is playing out against a backdrop of shifting geopolitical alignments and regional recalibration.
On one side, global investors are reassessing supply chains, energy routes, and security commitments in light of conflicts and tensions elsewhere. On the other, South Asia’s demographic and consumption stories continue to attract attention. Pakistan, positioned at the intersection of key trade corridors, is once again being marketed as a “gateway” to multiple regions.
More importantly, the domestic political environment, while hardly tranquil, has been less disruptive than in some recent years. Policy continuity—especially in areas of economic management, energy pricing, and fiscal reform—has improved. For investors with long memories, the absence of fresh shocks sometimes feels as bullish as good news.
All of this is precarious, of course. Pakistan’s political and security risks have not vanished; they have merely receded enough to allow the market to focus on earnings, valuations, and reforms. Whether this window stays open will play a significant role in determining whether the bull run becomes a sustained multi‑year story or just a powerful but finite rebound.
The Psychology of Confidence: From Survival to Strategy
Investor confidence is not solely a function of spreadsheets and macro charts; it is also psychological. The PSX’s 2025 bull run is, in part, a collective exhale after years of living at the edge of crisis.
When investors spend too long in defensive mode—rolling over positions, protecting cash, questioning solvency—there is a pent‑up demand for a more constructive story. As soon as macro stabilization becomes credible and early‑cycle signals appear, positioning can change rapidly:
- Domestic investors rotate from cash and property back into equities.
- Brokers, after years of depressed business, see volumes rise and become vocal advocates of the rally.
- The media narrative shifts from “how bad can it get?” to “have you missed the rally?”
The PSX has benefited from this psychological flip. Once the move began, it reinforced itself: each new high brought sidelined investors back in, while early entrants felt vindicated and emboldened.
SEO‑Visible Themes: How the Market Story Travels Beyond the Ticker
From a digital and editorial perspective, the PSX bull run intersects with several high‑interest themes that naturally attract global and regional readership:
- “Pakistan stock market 2025 performance”
- “PSX bull run analysis”
- “KSE‑100 index outlook”
- “Pakistan IMF program and stock market”
- “Emerging markets opportunity 2025”
- “Is Pakistan investable again?”
These search phrases map onto real investor questions. They also provide a framework through which this narrative is being disseminated to a wider audience. The more Pakistan appears in global financial discourse as a comeback story rather than a crisis case, the more self‑reinforcing the confidence cycle can become.
For seasoned investors, of course, the nuance matters: Pakistan is still a high‑risk market, with deep structural vulnerabilities and institutional constraints. But the recalibration from “uninvestable” to “selectively investable” is significant.
Is the Bull Run Sustainable?
The most important question for any serious investor is not why a rally has occurred, but whether it can last. On that front, Pakistan’s case is neither unequivocally bullish nor inevitably doomed. It is contingent.
Several factors will determine whether the PSX of 2025 is the start of a durable multi‑year trend or merely a powerful cyclical rebound:
- Fiscal Credibility: The government must move beyond budget‑day optics and credibly implement tax reforms, broaden the base, rationalize expenditure, and reduce reliance on unsustainable borrowing. Without this, debt dynamics could again spook markets.
- Monetary Prudence: The central bank’s eventual easing must remain anchored in inflation realities, not political pressure. Cutting too fast or too far could reignite inflation and undermine currency stability—killing the very confidence that underpins the bull run.
- Structural Reforms: Energy sector restructuring, state‑owned enterprise reform, digitalization of tax and payments infrastructure, and improvements in ease of doing business are not optional. They are the foundation on which any credible long‑term bull market must rest.
- External Resilience: Pakistan’s external account remains vulnerable to global shocks. Commodity price spikes, sudden stops in funding, or geopolitical flare‑ups can quickly reverse capital flows. Building buffers—reserves, reliable credit lines, diversified export markets—is essential.
- Institutional Strength and Governance: Markets ultimately thrive in environments where rules are predictable, contracts are respected, and governance is improving. Any regression in these areas will show up, sooner or later, in risk premiums and valuations.
The Final Verdict: A Market Re‑Rated, Not Yet Redeemed
The PSX bull run of 2025 is best understood not as an irrational exuberance, nor as a purely technical rally, but as a re‑rating of Pakistan’s risk profile after a period of extreme pessimism. Macroeconomic stabilization, a credible monetary pivot, incremental fiscal improvements, and better market infrastructure have collectively nudged investors from survival mode into selective optimism.
Yet optimism is not destiny. Pakistan’s stock market has been here before: episodes of strong performance followed by abrupt reversals when politics, policy, or global conditions turned. The challenge now is to avoid replaying that script.
If the country uses this window of market confidence to deepen reforms, strengthen institutions, and build resilience, the PSX of 2025 may mark the beginning of a longer secular story: a frontier market maturing into a more robust, though still volatile, emerging market opportunity.
If, however, complacency sets in—if reform fatigue returns, if fiscal and monetary discipline frays, if governance regresses—the bull run will, in hindsight, be remembered as another missed opportunity: a technically impressive rally that failed to translate into a durable re‑write of Pakistan’s economic trajectory.
For now, the verdict is still being written. What is clear is that investors have given Pakistan another chance. Whether policymakers, corporates, and institutions make good on that chance will determine whether the PSX remains a tactical trade—or finally earns its place as a strategic allocation in global portfolios.
Discover more from The Economy
Subscribe to get the latest posts sent to your email.


When the benchmark 10-year U.S. Treasury yield crosses the 5.0% threshold, financial markets undergo a structural paradigm shift. Far beyond a routine spike in borrowing costs, a 5% yield alters the hurdle rate for global capital, re-prices risk across every asset class, and exposes systemic sovereign debt fragilities.
1. The 5.0% Benchmark: Why the “Risk-Free” Rate Reshapes Equities
The 10-year U.S. Treasury note is the foundational anchor of global finance. Its yield represents the risk-free rate ($R_f$) utilized in the Capital Asset Pricing Model (CAPM) and Discounted Cash Flow (DCF) models worldwide.
When $R_f$ rises from 2%–3% to over 5%, the present value of future corporate earnings contracts exponentially.
$$\text{Present Value} = \sum_{t=1}^{n} \frac{CF_t}{(1 + WACC)^t}$$
As the Weighted Average Cost of Capital ($WACC$) climbs alongside Treasury yields:
- Growth Stocks & Big Tech: Long-duration growth equities—where the majority of projected cash flows sit far in the future—suffer the sharpest valuation multiple compressions.
- Equity Risk Premium (ERP) Squeeze: With risk-free Treasury bills yielding 5%, the additional premium required to hold volatile equities shrinks dramatically, prompting institutional capital to migrate from stocks to bonds.
- Corporate Liquidity Crunch: Corporate debt refinancing costs double or triple compared to pre-2022 issuance levels, directly eroding net profit margins reported to the U.S. Securities and Exchange Commission.
2. Macroeconomic Catalysts: What Is Driving the Bond Sell-Off?
The surge to 5%+ yields is driven by three primary structural forces rather than a single economic data point:
┌─────────────────────────────────────────────────────────────────────────┐
│                      DRIVER 1: FISCAL EXPANSION                         │
│  U.S. national debt interest + mandatory entitlement outlays now absorb │
│  ~98% of federal tax revenues (Source: U.S. Treasury Department).       │
└────────────────────────────────────┬────────────────────────────────────┘
                                     │
                                     ▼
┌─────────────────────────────────────────────────────────────────────────┐
│                     DRIVER 2: ISSUANCE MISMATCH                         │
│  84% of 12-month Treasury debt issuance concentrated in short-term T-   │
│  Bills, creating severe rollover sensitivity to rate hikes.             │
└────────────────────────────────────┬────────────────────────────────────┘
                                     │
                                     ▼
┌─────────────────────────────────────────────────────────────────────────┐
│                     DRIVER 3: CAPITAL COMPETITION                       │
│  Corporate AI CAPEX spending (~$700B–$900B/yr) competes with sovereign  │
│  bond issuance for global institutional capital reserves.               │
└─────────────────────────────────────────────────────────────────────────┘
Sovereign Debt & Supply Shock
As documented by the U.S. Department of the Treasury, massive fiscal deficit spending has accelerated net bond issuance. Because traditional central bank buyers engaged in quantitative tightening (QT) while foreign sovereign buyers reduced purchases, price discovery has shifted to price-sensitive private institutional investors who demand higher yields (term premium) to absorb debt supply.
Global Central Bank Tightening Synchronicity
Monetary policy decisions from the Federal Reserve System and global partners—such as the Bank of Japan raising interest rates—have reinforced elevated global rate floors. Official global debt perspectives from the International Monetary Fund highlight how high real yields strain emerging market borrowing capacity.
3. Sector Impact Analysis & Asset Class Vulnerabilities
| Asset Class / Sector | Impact Level | Primary Vulnerability / Opportunity |
| Mega-Cap Big Tech | Moderate to High | CAPEX borrowing costs rise; DCF discount rate expansion reduces forward P/E multiples. |
| Commercial & Residential Real Estate | Severe Headwind | Mortgage rates track 10-year yields; refinancing resets create valuation pressure. |
| Short-Term T-Bills & Money Market | Highly Favorable | Yields above 5% offer competitive risk-adjusted real returns without duration risk. |
| Hard Assets (Gold / Precious Metals) | Strategic Hedge | Fiscal deficit concerns and dollar devaluation risks enhance gold’s monetary status. |
| Asian & Emerging Market Equities | Selective Upside | Valuations in South Korea, Japan, and India trade at significant discounts relative to U.S. multiples. |
4. Tactical Asset Allocation Framework
Navigating a 5%+ Treasury yield environment requires balancing yield capture, capital preservation, and equity growth.
Core Portfolio Takeaways
- The Cash-Equivalent Shield: Allocating 35% to short-dated T-Bills mimics Warren Buffett’s liquidity strategy at Berkshire Hathaway, locking in 5%+ yields while preserving optionality for market corrections as reported by CNBC Markets.
- Selective Equity Quality: Focus equity exposure on companies with pristine balance sheets, low debt-to-equity ratios, and pricing power capable of outrunning inflation.
- Monetary Hedges: Gold and hard assets provide downside protection against potential currency weakness if central banks step in to cap bond yields through yield curve intervention. Further macroeconomic debt analysis is regularly updated by Bloomberg Markets and Reuters Financial News.
Discover more from The Economy
Subscribe to get the latest posts sent to your email.
IMF sees 3.0% global growth in 2026, the World Bank just 2.5%. Compare Europe and Asia forecasts, the gap between them, and what it means for capital.
Executive Summary / Key Takeaways
- The IMF’s July 2026 World Economic Outlook Update projects global growth of 3.0% in 2026 and 3.4% in 2027, down from the 3.5% average of 2024–25.
- The World Bank’s June 2026 Global Economic Prospects is far darker: 2.5% in 2026, the weakest since the pandemic, with two-thirds of economies downgraded since January.
- The two institutions are not contradicting each other — they use different weighting methodologies — but the direction of both revisions is the same, and the driver is the Middle East war.
- Europe and Central Asia was cut to 2.1% for 2026; East Asia and Pacific to 4.2%. The Middle East, North Africa, Afghanistan and Pakistan region takes the worst hit at 1.6%.
- The divergence that matters for allocators is not regional but structural: economies plugged into the AI-led technology cycle are outperforming energy importers that are not.
1. Introduction & Immediate Context
Two flagship forecasts, two very different headline numbers, one identical story underneath. Anyone building a 2027 capital plan needs to understand why.
The IMF’s July update projects global growth of 3.0% in 2026 and 3.4% in 2027, down from the 3.5% average observed across 2024–25 and broadly unchanged on a cumulative basis from the April 2026 World Economic Outlook. The Fund attributes the modest slowdown to the effects of the war in the Middle East, partly offset by accelerated demand-driven momentum in the global technology cycle thanks to advances in artificial intelligence and its adoption.
The World Bank is blunter. It forecasts global growth slowing to 2.5% in 2026 from 2.9% in 2025 — the lowest rate since the onset of the COVID-19 pandemic — amid higher energy prices, steeper inflation and increased borrowing costs. Forecasts for two-thirds of economies were downgraded relative to January. Growth is expected to improve to 2.8% in 2027 but will remain 0.4 percentage point below the 2010s average.
The gap between 3.0% and 2.5% is largely methodological: the IMF aggregates at purchasing-power-parity weights, the World Bank at market exchange rates, which gives slower-growing advanced economies more influence. Read the revisions, not the levels.
2. Core Market / Strategic Analysis
2.1 Regional forecasts side by side
| Region | World Bank 2026 | World Bank 2027 | Revision direction | Source |
|---|---|---|---|---|
| World | 2.5% | 2.8% | Cut from 2.6% (Jan) | World Bank |
| East Asia & Pacific | 4.2% | 4.4% | Cut from 4.4% (Jan) | World Bank |
| Europe & Central Asia | 2.1% | 2.3% | Cut from 2.4% (Jan) | World Bank |
| South Asia | 6.3% | 6.9% | Fastest-growing region | World Bank |
| MENA, Afghanistan & Pakistan | 1.6% | 5.0% | Cut from 3.6% (Jan) | World Bank |
| Sub-Saharan Africa | 4.0% | 4.4% | Marginal easing | World Bank |
| Low-income countries | 5.4% | — | Cut 0.3pp on the conflict | World Bank |
The MENAAP line is the single most violent revision in the dataset: from 3.6% to 1.6% for 2026 in five months, followed by a mechanical 5.0% rebound in 2027 as base effects and assumed energy normalisation kick in. For frontier-market investors with Pakistan or Gulf exposure, that V-shape is the entire investment thesis — and it rests on an assumption about how long the conflict lasts.
2.2 The European picture
Growth in Europe and Central Asia is projected to decelerate to 2.1% in 2026, weakening in roughly 70% of economies in the region, according to the World Bank’s regional highlights. Domestic demand remains the primary driver but is constrained in 2026 by elevated energy prices, which raise inflation and erode real incomes, and by tighter financial conditions.
Commodity exporters in the region — Azerbaijan, Kazakhstan and Turkmenistan among them — see export revenues supported by higher energy prices even as growth slows. In Russia, the World Bank estimates oil revenue gains at roughly 1.5% of 2025 GDP for each $10 per barrel increase in prices, with those gains mainly directed toward fiscal consolidation.
The euro area itself sits at the sluggish end. The IMF’s January 2026 update had projected euro-area growth steady at 1.3% in 2026 and 1.4% in 2027, noting that the region benefits less than others from the technology-driven investment boost and that lingering energy-price effects continue to drag on manufacturing. Planned defence spending increases are expected to show up in output only in later years given phased commitments running to 2035.
2.3 The Asian picture
East Asia and Pacific is projected to fall to 4.2% in 2026 before firming to 4.4% in 2027 — a downgrade, but still comfortably the second-fastest-growing region. South Asia leads globally at 6.3% in 2026 and 6.9% in 2027.
The IMF’s framing explains why Asia holds up better than Europe: economies plugged into the technology-led upturn experience stronger activity even when they are energy importers, while activity weakens for energy importers with limited participation in that cycle. Energy exporters outside the conflict zone benefit from favourable terms of trade.
3. Structural Drivers and Competitor Gaps
Most coverage treats these as two competing headline numbers. The more useful read is that both institutions have converged on the same three-channel transmission mechanism, articulated by IMF Chief Economist Pierre-Olivier Gourinchas when the April outlook was released: higher energy and food prices themselves; persistence in wage and price inflation; and a confidence shock. The Fund noted at the time that the global economy had been on a roughly 3.3% trajectory and was heading for an upgrade before the war stopped that momentum, with inflation instead rising toward 4.4%.
Three structural points follow that competitors miss:
The dispersion is the story. The April WEO recorded a cumulative growth revision of nearly three percentage points for 2026 in the Middle East and North Africa, against comparatively modest effects in advanced economies. A single global number conceals a distribution this wide.
The 2027 rebound is conditional, not forecast. The World Bank’s recoveries across all regions in 2027–28 are driven by an assumed decline in energy prices and rebound in global activity. If Brent stays above $100, the rebound does not arrive on schedule.
AI is now a macro line item, not a sector story. Both institutions explicitly cite broader AI adoption as an upside risk offsetting the energy shock. That reframes technology capital expenditure as a national growth input, which is why Singapore, Malaysia and Taiwan are outperforming regional peers with similar energy exposure.
4. Key Implications for Stakeholders
Macro allocators. The IMF–World Bank spread is not noise to be averaged away; it is a signal about where you sit in the distribution. Market-weight exposure to advanced economies should be benchmarked against the World Bank’s 2.5%, not the IMF’s 3.0%.
Corporate strategists. Fiscal pressure is the binding constraint in developing markets. The World Bank flags that fiscal pressures will affect the ability to reduce poverty and food insecurity and to create jobs — which translates into weaker public procurement and slower infrastructure pipelines across frontier markets through 2027.
Frontier and EM investors. Emerging market and developing economies face their weakest per capita income growth since the pandemic. Pair that with the MENAAP downgrade and the case for selectivity over beta exposure is straightforward.
Watch the October calendar. The IMF’s next full World Economic Outlook lands with the Annual Meetings. Given the energy trajectory since July, the risk to the 3.0% figure is to the downside.
5. Frequently Asked Questions
Q1: What is the IMF’s global growth forecast for 2026?
The IMF projects 3.0% global growth in 2026 and 3.4% in 2027, per its July 2026 World Economic Outlook Update — down from the 3.5% average recorded across 2024–25, with the Middle East war the principal drag.
Q2: Why does the World Bank forecast lower growth than the IMF?
The World Bank aggregates using market exchange rates while the IMF uses purchasing-power-parity weights, giving slower-growing advanced economies more influence in the World Bank’s 2.5% figure. Both revised downward for the same reasons.
Q3: Which region is growing fastest in 2026?
South Asia, at a projected 6.3% in 2026 rising to 6.9% in 2027, according to the World Bank. East Asia and Pacific follows at 4.2%.
Q4: How badly has the Middle East conflict hit growth forecasts?
The World Bank cut its MENA, Afghanistan and Pakistan forecast from 3.6% to 1.6% for 2026, and downgraded two-thirds of all economies since January. Global growth is now at its weakest since the pandemic.
Discover more from The Economy
Subscribe to get the latest posts sent to your email.
Global Economy
Fed Rate Hike Projections vs. Trump’s Interest Rate Policy: What Global Markets Expect Next

The Fed hiked to 3.75%-4% on Sept 16 as Trump demanded 1% rates. See the dot plot, the market reaction and what it means for borrowers next.
Executive Summary / Key Takeaways
- On 16 September 2026 the Federal Open Market Committee voted 12-0 to raise the federal funds target range by a quarter point to 3.75%–4.00% — the first US rate increase since July 2023.
- The statement was blunt: inflation remains elevated, and the action is meant to support a timelier return to the 2% goal.
- The dot plot showed 16 of 18 participants expecting at least one more quarter-point hike before year-end, with four seeing room for two. Chair Kevin Warsh declined to submit a projection at all.
- President Trump responded within hours, demanding that US rates fall to 1% “or less” — while saying he still has confidence in the chair he appointed.
- Markets sold the decision then partly reversed: the Dow fell more than 600 points, the 10-year Treasury yield topped 5%, and the two-year reached its highest level since 2024.
1. Introduction & Immediate Context
For three and a half years the direction of travel in US monetary policy was one-way — cuts, pauses and arguments about the pace of easing. That ended on Wednesday afternoon.
The Federal Reserve approved its statement by a 12–0 vote, lifting the target range for the federal funds rate by a quarter percentage point to 3¾–4 percent while continuing its policy of maintaining ample reserves in the banking system. The Committee described economic activity as expanding at a solid pace, noted that uncertainty remains elevated partly because of geopolitical developments, and observed that domestic spending has been resilient, productivity growth strong and capital investment robust.
Alongside that assessment sat a one-line justification for tightening: inflation remains elevated, and the policy action will support a timelier return to the 2 percent objective. That combination — firm growth, firm inflation — is what separates this decision from the reflexive easing bias markets carried through the first half of the year. As CNBC reported, futures markets had priced better than a 90% chance of the move, but the accompanying projections were more hawkish than most desks expected.
2. Core Market and Policy Analysis
2.1 What the dot plot actually says
The Summary of Economic Projections is the part institutional desks will trade for the next six weeks. Sixteen of eighteen policymakers anticipate at least one more quarter-point increase by the end of this year, and only two expect rates to stay where they are, according to Reuters. Four of those officials see two further hikes as possible.
Warsh’s refusal to publish his own dot is a deliberate break with a decade of Fed communication practice; he has said repeatedly that he opposes issuing forward guidance. For rate-sensitive borrowers that matters. The committee’s central tendency is now the only signal available, and it points higher.
| Metric / Indicator | Current Status | Projected Impact | Primary Source |
|---|---|---|---|
| Federal funds target range | 3.75%–4.00% (raised 25 bps, 12-0) | At least one further hike signalled for 2026 | Federal Reserve |
| FOMC dot plot | 16 of 18 see ≥1 more hike; 4 see two | Terminal-rate debate shifts toward 4.25%–4.50% | Reuters |
| PCE inflation projection | 3.7% in 2026, falling to 2.3% in 2027 | Above target across the forecast horizon | Fox Business |
| 10-year Treasury yield | Above 5% | Higher mortgage and corporate borrowing costs | Yahoo Finance |
| Prior policy path | Three cuts in 2025 to 3.50%–3.75%, then five holds | First reversal of the easing cycle since 2023 | Trading Economics |
2.2 The inflation case for tightening
Fed projections put PCE inflation at 3.7% in 2026, falling to 2.3% in 2027, with domestic spending remaining resilient, Fox Business reported. That is a second consecutive year of above-target inflation on the central bank’s own numbers, driven substantially by energy costs.
Warsh framed the decision in unusually plain terms at his press conference, saying that inflation is too high and has been for too long, and describing the vote as a sober, serious, responsible decision. Speaking to Bloomberg, he characterised the move as removing a dose of accommodation so that financial and credit conditions would sit more consistently with the Fed’s ultimate objectives — and said the action begins to show the central bank is serious about delivering price stability. He also noted that the economy has gathered speed since the July hold, with little sign of inflation cooling.
3. Structural Drivers and Competitor Gaps: The Independence Test
This is where most coverage stops short. The interesting variable is not 25 basis points; it is the institutional test now underway.
In the week before the meeting, the president, vice president, Treasury secretary and a senior White House economic counselor all publicly urged the Fed not to raise rates and in some cases to cut — an unusually broad pressure campaign even by the standards of Trump’s long-running criticism of the central bank, CNBC reported. Vice President JD Vance said the administration believes the Fed should be lowering rates and would appreciate help from the central bank. Treasury Secretary Scott Bessent argued that the Fed typically does not raise rates during a supply shock until second- or third-order inflationary effects appear.
The decision went the other way. Warsh voted with a unanimous committee despite that pressure, in a move read by analysts as an unambiguous signal that the White House should keep its hands off the Federal Reserve. Trump had selected Warsh in January after souring on former chair Jerome Powell — which is precisely what makes the vote consequential. This was not an inherited adversary defying the administration; it was the administration’s own appointee.
The presidential response came within hours. Trump wrote on Truth Social that US interest rates should be 1% or less because America is the best credit in the world, ending with a demand that rates be lowered fast, Reuters reported. He also appeared to link persistent US trade deficits to the central bank’s borrowing costs, though the two are largely unrelated. Asked later whether he believed Warsh had decided based on White House input, the president said he did not think so, and confirmed he still has confidence in the chair.
For sovereign allocators the pricing question is whether September establishes a durable precedent of operational independence, or whether the pressure campaign intensifies into 2027 as the midterm cycle bites. Long-end term premium is the cleanest instrument for expressing a view either way.
4. Key Implications for Stakeholders
Mortgage borrowers. The transmission channel is the long end, not the policy rate. The 10-year Treasury topped 5% around the decision while oil traded solidly above $100 per barrel, according to Yahoo Finance. Thirty-year fixed mortgage pricing tracks the long bond far more closely than the funds rate, so the term-premium repricing matters more than the hike itself.
Equity investors. Stocks reversed during Warsh’s press conference as markets read his remarks as hawkish, with the Dow dropping more than 600 points — over 1.2% — while the S&P 500 fell 0.4% and the Nasdaq finished near flat. Yardeni Research cut its year-end S&P 500 target to 7,900 from 8,400, citing higher Treasury yields driven by rising energy prices and an increased risk of a downturn over the next three to six months, CNBC noted.
Global markets. By Thursday, sentiment had steadied. Bloomberg reported Treasuries paring losses and US equity futures climbing as Warsh’s resolve reassured investors, with the two-year note easing a basis point to 4.72% after touching its highest level since 2024, and the 10-year and 30-year both slipping around two basis points.
Institutional positioning. The base case is now higher-for-longer with a live December hike. Markets are pricing one more 25-basis-point increase in 2026 followed by further tightening extending into 2027, per Seeking Alpha analysis of CME FedWatch pricing.
5. Frequently Asked Questions
Q1: What is the current Fed interest rate after the September 2026 meeting?
The federal funds target range is 3.75%–4.00%, raised by 25 basis points on 16 September 2026 in a unanimous 12-0 FOMC vote. It was the first US rate increase since July 2023 and partially reversed the 2025 easing cycle.
Q2: Will the Fed raise rates again in 2026?
The dot plot indicates 16 of 18 FOMC participants expect at least one further quarter-point increase before year-end, and four see two as possible. Markets currently price one additional hike in December, with more tightening possible into 2027.
Q3: How did Trump react to the Fed rate hike?
He demanded on Truth Social that US rates be cut to 1% or less, while telling reporters afterwards that he retains confidence in Chair Kevin Warsh and does not believe Warsh acted on White House instruction.
Q4: Why is the Fed hiking when inflation was supposed to be falling?
Fed projections put PCE inflation at 3.7% in 2026, well above the 2% target, driven substantially by energy prices. The Committee judged growth, productivity and capital investment strong enough to absorb tighter policy.
Discover more from The Economy
Subscribe to get the latest posts sent to your email.

VIX Index Explained: How to Trade Wall Street’s Fear Gauge Today

Commercial vs Residential Real Estate: Which Wins in 2026?

Presidential Stock Market Performance: How Trump’s Second Term Compares to History

2026 Real Estate Market News: Are We Heading for a Correction?

Bitcoin Price Forecast 2026–2027: Will the 4-Year Cycle Hold?

Fidelity Crypto vs. Traditional Brokerages: A Guide for Modern Investors

The 2026 Global Smartphone Market: AI Integration and Competitor Analysis

SpaceX IPO: How Aerospace Is Reshaping Tech Startup News

Fidelity Investments Review: Maximizing Returns in a Volatile Stock Market

How Crypto Transformed the Trump Fortune: A $1.4 Billion Financial Breakdown

Global Pension Systems Ranked: The World’s Best and Worst Retirement Frameworks

Global Supply Chain Vulnerabilities: From Eurasian Trade Corridors to Food Consumer Recalls

Why 5% U.S. Treasury Yields Signal a Global Market Regime Shift.

Federal Reserve Defies White House Pressure: Inside Trump’s Demand for Sub-1% Interest Rates After Historic 2026 Rate Hike

State Farm’s $5B Dividend 2026: Who Qualifies & Payout Dates

US-China Relations in Q3 2026: Trade Tariffs and Supply Chain Risks

Top 30 Stocks for Investment in PSX for Massive ROI in 2026

SpaceX Starship Flight 14: First Orbital Attempt & Starlink V3 Launch Explained

The 2026 Crypto Regulatory Shift: What It Means for Institutional Investors

AI Chip Stocks 2026: The Best Semiconductor Investments Beyond Marvell

Tween Back-to-School Trends 2026: What’s Driving the $85B Season

AI-Powered Training: The Next Multi-Billion Dollar Ecosystem in Fitness

Oil Prices Break $100 in 2026: Middle East Conflict & Energy Markets

10-Year Treasury Yield Hits 4.80%: What It Means for Rates & Portfolios

Fidelity Investments Review 2026: SPAXX Yields & Zero-Fee Funds

Shein Clothes Quality & Safety in 2026: What Lab Tests Show

BRICS+ Cross-Border Payments 2026: Interoperability Explained

MRVL Earnings 2026: Why Marvell Sank Despite Beating Estimates
-

 Markets & Finance9 months ago
Top 15 Stocks for Investment in 2026 in PSX: Your Complete Guide to Pakistan’s Best Investment Opportunities
-

 Analysis7 months ago
Johor’s Investment Boom: The Hidden Costs Behind Malaysia’s Most Ambitious Economic Surge
-

 Analysis7 months ago
Top 10 Stocks for Investment in PSX for Quick Returns in 2026
-

 Analysis8 months ago
Brazil’s Rare Earth Race: US, EU, and China Compete for Critical Minerals as Tensions Rise
-

 Banks8 months ago
Best Investments in Pakistan 2026: Top 10 Low-Price Shares and Long-Term Picks for the PSX
-

 Investment8 months ago
Top 10 Mutual Fund Managers in Pakistan for Investment in 2026: A Comprehensive Guide for Optimal Returns
-

 Global Economy9 months ago
15 Most Lucrative Sectors for Investment in Pakistan: A 2025 Data-Driven Analysis
-

 Global Economy9 months ago
Pakistan’s Export Goldmine: 10 Game-Changing Markets Where Pakistani Businesses Are Winning Big in 2025