
Global Finance
Pakistan’s IMF Deal: Reform or Recoil?

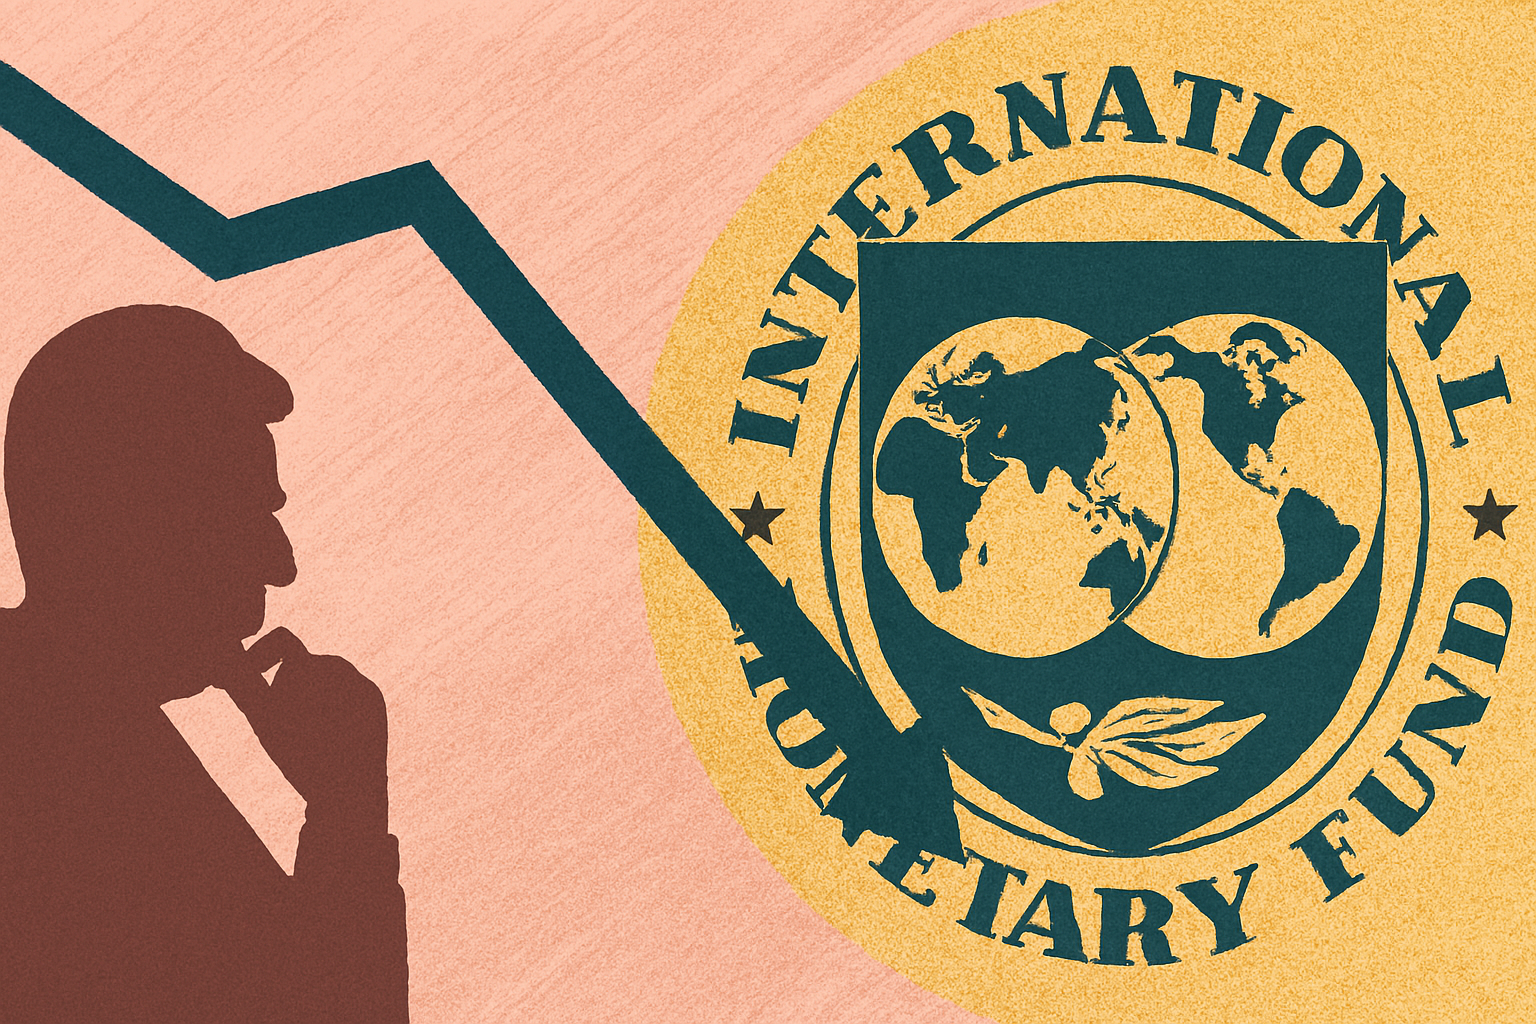
As Pakistan enters yet another phase of IMF‑mandated reform, the country stands at a familiar crossroads: the tension between sovereignty and sustainability. The IMF’s latest Staff Report Directives—an 11‑point matrix of governance, fiscal, and sectoral reforms—signal a shift from short‑term stabilization to long‑delayed structural overhaul. But can a politically fragmented state absorb the socio‑economic shockwaves these reforms will unleash?
To understand the magnitude of the challenge, the conditions can be grouped into three analytical pillars: Governance & Transparency, Fiscal Consolidation, and Sectoral Liberalization. Each pillar carries its own economic rationale—and its own political landmines.
A. Governance & Transparency: The Anti‑Corruption Mandate
At the heart of the IMF’s governance agenda lies a symbolic yet politically explosive requirement: mandatory asset declarations for all federal civil servants by December next year, followed by provincial-level disclosures by October. According to the IMF Staff Report Directives, this measure is intended to operationalize the recommendations of the Governance Diagnostic Report and align Pakistan with global transparency norms.
“Pakistan’s path to sustainability demands a surrender of fiscal sovereignty—starting with bureaucratic transparency and ending with sectoral disruption.”
On paper, the economic logic is straightforward. Transparency reduces corruption risk, improves investor confidence, and strengthens institutional credibility. The World Bank’s simulated “Governance Effectiveness Index” suggests that countries with mandatory public disclosures experience a measurable improvement in FDI inflows over a five‑year horizon.
But the socio‑political cost is far from trivial.
Pakistan’s bureaucracy—one of the most entrenched power centers in the country—views asset disclosure as an existential threat. Resistance is likely to be fierce, particularly from senior cadres who perceive the requirement as an erosion of administrative sovereignty. Will a bureaucracy accustomed to opacity willingly embrace radical transparency?
The IMF’s demand for amendments to the Companies Act, 2017 and the SECP Act further deepens the governance overhaul. These changes aim to align corporate governance with international best practices, a move consistent with ADB’s Regional Economic Outlook, which has repeatedly flagged Pakistan’s weak regulatory enforcement as a barrier to private‑sector growth.
Economic Outcome: Improved governance, reduced corruption risk, enhanced investor confidence.
Political Cost: Institutional pushback, bureaucratic inertia, and potential legal challenges.
B. Fiscal Consolidation: Taxes, Mini‑Budgets, and the Politics of Pain
The second pillar—fiscal consolidation—is the most politically combustible. The IMF has explicitly tied program continuity to Pakistan’s ability to meet revenue targets by end‑December 2025, failing which a mini‑budget will be required. This is not merely a fiscal safeguard; it is a structural test of Pakistan’s political will.
Among the most contentious measures are:
- A 5% increase in federal excise duty on fertilisers and pesticides
- New excise duties on high‑value sugary items
These taxes are economically rational but politically radioactive.
The agricultural lobby—one of the most powerful in Pakistan—will resist higher input costs, arguing that the duty increase will raise food inflation and depress rural incomes. Meanwhile, the sugary‑items tax directly targets the influential sugar lobby, a group with deep political roots and cross‑party influence. The IMF’s insistence on these measures reflects a broader push to expand Pakistan’s chronically narrow tax base, which the World Bank estimates captures less than 10% of potential taxpayers.
But what is the socio‑economic trade‑off?
Higher taxes on sugary items may reduce consumption and improve public health outcomes, but they will also raise retail prices in an already inflation‑sensitive consumer market. The fertiliser and pesticide duty increase risks pushing up agricultural production costs, potentially feeding into food inflation—a politically sensitive metric in any emerging market.
Economic Outcome: Revenue expansion, reduced fiscal deficit, alignment with IMF sustainability benchmarks.
Political Cost: Rural backlash, industry lobbying, inflationary pressure, and heightened risk of street‑level protest.
C. Sectoral Liberalization: Power and Sugar—The Twin Fault Lines
The third pillar—sectoral liberalization—targets two of Pakistan’s most distortion‑ridden sectors: power and sugar.
The IMF’s directive requires:
- Full liberalization of the sugar sector
- Enhanced private participation in the power sector by next June
These reforms strike at the core of Pakistan’s political economy.
The sugar sector is dominated by politically connected conglomerates whose influence extends from parliament to provincial assemblies. Liberalization—removing price controls, export restrictions, and preferential subsidies—will face fierce resistance. Yet the IMF views this as essential to dismantling market distortions and improving competitiveness.
The power sector, meanwhile, remains a fiscal black hole. Circular debt continues to balloon, and losses persist despite repeated tariff hikes. The IMF’s push for private participation is aligned with global best practices; ADB’s energy-sector diagnostics have long argued that Pakistan’s state‑dominated model is unsustainable.
But the political cost is immediate. Private participation implies tariff rationalization, subsidy reduction, and stricter enforcement—all deeply unpopular measures in a country where electricity prices are already a flashpoint for public anger.
Economic Outcome: Reduced circular debt, improved sector efficiency, enhanced investor participation.
Political Cost: Resistance from entrenched lobbies, public backlash over tariffs, and potential provincial‑federal tensions.
Sovereignty vs. Sustainability: The Central Dilemma
The IMF’s 11 conditions collectively underscore a deeper philosophical tension: Can Pakistan achieve long‑term sustainability without ceding short‑term sovereignty?
The asset declaration requirement is emblematic of this dilemma. For many policymakers, it symbolizes external intrusion into domestic governance. Yet for investors, it signals a long‑overdue shift toward transparency.
Similarly, the mini‑budget trigger—if revenues fall short by December 2025—places Pakistan’s fiscal policy under external surveillance. Critics argue this undermines sovereignty; proponents counter that Pakistan’s fiscal sovereignty has long been compromised by structural weaknesses, not IMF oversight.
Forward-Looking Assessment: Can Pakistan Meet the Deadlines?
Given Pakistan’s political fragmentation, bureaucratic resistance, and entrenched economic interests, meeting all IMF deadlines will be challenging. The governance milestones—particularly asset declarations—are achievable but politically costly. Fiscal consolidation will depend heavily on inflation dynamics and the government’s ability to withstand lobbying pressure. Sectoral liberalization, especially in sugar and power, remains the most uncertain.
Yet if Pakistan does manage to comply, the payoff could be significant. Successful implementation would strengthen macroeconomic stability, improve sovereign creditworthiness, and unlock new avenues for foreign direct investment, particularly in energy, agritech, and manufacturing. Investors value predictability—and nothing signals predictability more than a government capable of meeting difficult structural benchmarks.
The cost of compliance is high. But the cost of non‑compliance may be higher still.
Discover more from The Economy
Subscribe to get the latest posts sent to your email.


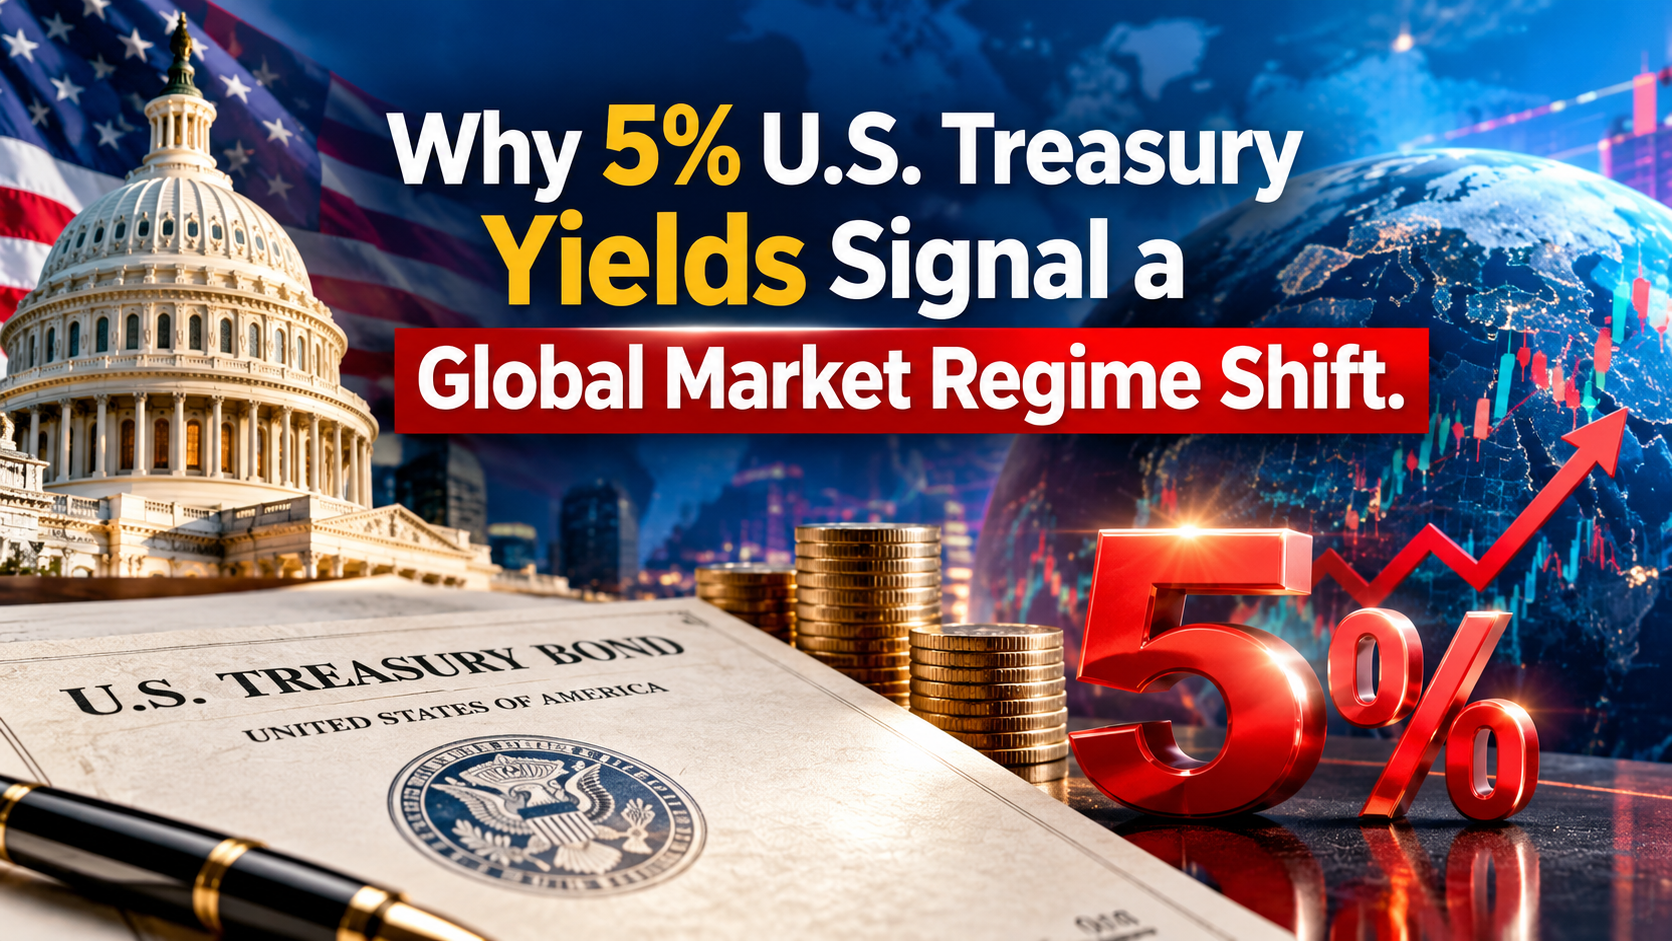
When the benchmark 10-year U.S. Treasury yield crosses the 5.0% threshold, financial markets undergo a structural paradigm shift. Far beyond a routine spike in borrowing costs, a 5% yield alters the hurdle rate for global capital, re-prices risk across every asset class, and exposes systemic sovereign debt fragilities.
1. The 5.0% Benchmark: Why the “Risk-Free” Rate Reshapes Equities
The 10-year U.S. Treasury note is the foundational anchor of global finance. Its yield represents the risk-free rate ($R_f$) utilized in the Capital Asset Pricing Model (CAPM) and Discounted Cash Flow (DCF) models worldwide.
When $R_f$ rises from 2%–3% to over 5%, the present value of future corporate earnings contracts exponentially.
$$\text{Present Value} = \sum_{t=1}^{n} \frac{CF_t}{(1 + WACC)^t}$$
As the Weighted Average Cost of Capital ($WACC$) climbs alongside Treasury yields:
- Growth Stocks & Big Tech: Long-duration growth equities—where the majority of projected cash flows sit far in the future—suffer the sharpest valuation multiple compressions.
- Equity Risk Premium (ERP) Squeeze: With risk-free Treasury bills yielding 5%, the additional premium required to hold volatile equities shrinks dramatically, prompting institutional capital to migrate from stocks to bonds.
- Corporate Liquidity Crunch: Corporate debt refinancing costs double or triple compared to pre-2022 issuance levels, directly eroding net profit margins reported to the U.S. Securities and Exchange Commission.
2. Macroeconomic Catalysts: What Is Driving the Bond Sell-Off?
The surge to 5%+ yields is driven by three primary structural forces rather than a single economic data point:
┌─────────────────────────────────────────────────────────────────────────┐
│                      DRIVER 1: FISCAL EXPANSION                         │
│  U.S. national debt interest + mandatory entitlement outlays now absorb │
│  ~98% of federal tax revenues (Source: U.S. Treasury Department).       │
└────────────────────────────────────┬────────────────────────────────────┘
                                     │
                                     ▼
┌─────────────────────────────────────────────────────────────────────────┐
│                     DRIVER 2: ISSUANCE MISMATCH                         │
│  84% of 12-month Treasury debt issuance concentrated in short-term T-   │
│  Bills, creating severe rollover sensitivity to rate hikes.             │
└────────────────────────────────────┬────────────────────────────────────┘
                                     │
                                     ▼
┌─────────────────────────────────────────────────────────────────────────┐
│                     DRIVER 3: CAPITAL COMPETITION                       │
│  Corporate AI CAPEX spending (~$700B–$900B/yr) competes with sovereign  │
│  bond issuance for global institutional capital reserves.               │
└─────────────────────────────────────────────────────────────────────────┘
Sovereign Debt & Supply Shock
As documented by the U.S. Department of the Treasury, massive fiscal deficit spending has accelerated net bond issuance. Because traditional central bank buyers engaged in quantitative tightening (QT) while foreign sovereign buyers reduced purchases, price discovery has shifted to price-sensitive private institutional investors who demand higher yields (term premium) to absorb debt supply.
Global Central Bank Tightening Synchronicity
Monetary policy decisions from the Federal Reserve System and global partners—such as the Bank of Japan raising interest rates—have reinforced elevated global rate floors. Official global debt perspectives from the International Monetary Fund highlight how high real yields strain emerging market borrowing capacity.
3. Sector Impact Analysis & Asset Class Vulnerabilities
| Asset Class / Sector | Impact Level | Primary Vulnerability / Opportunity |
| Mega-Cap Big Tech | Moderate to High | CAPEX borrowing costs rise; DCF discount rate expansion reduces forward P/E multiples. |
| Commercial & Residential Real Estate | Severe Headwind | Mortgage rates track 10-year yields; refinancing resets create valuation pressure. |
| Short-Term T-Bills & Money Market | Highly Favorable | Yields above 5% offer competitive risk-adjusted real returns without duration risk. |
| Hard Assets (Gold / Precious Metals) | Strategic Hedge | Fiscal deficit concerns and dollar devaluation risks enhance gold’s monetary status. |
| Asian & Emerging Market Equities | Selective Upside | Valuations in South Korea, Japan, and India trade at significant discounts relative to U.S. multiples. |
4. Tactical Asset Allocation Framework
Navigating a 5%+ Treasury yield environment requires balancing yield capture, capital preservation, and equity growth.
Core Portfolio Takeaways
- The Cash-Equivalent Shield: Allocating 35% to short-dated T-Bills mimics Warren Buffett’s liquidity strategy at Berkshire Hathaway, locking in 5%+ yields while preserving optionality for market corrections as reported by CNBC Markets.
- Selective Equity Quality: Focus equity exposure on companies with pristine balance sheets, low debt-to-equity ratios, and pricing power capable of outrunning inflation.
- Monetary Hedges: Gold and hard assets provide downside protection against potential currency weakness if central banks step in to cap bond yields through yield curve intervention. Further macroeconomic debt analysis is regularly updated by Bloomberg Markets and Reuters Financial News.
Discover more from The Economy
Subscribe to get the latest posts sent to your email.
Global Economy
Beyond Rhetoric: How the EU Is Deploying ‘All Tools’ to Rebalance Its €1 Billion-a-Day Trade Deficit with China
Key Takeaways
- The Tipping Point: European Commission President Ursula von der Leyen has declared that Europe’s trade deficit with China has reached an “unsustainable” €1 billion per day, pushing bilateral trade relations to a historical tipping point.
- Enforcement Over Engagement: Signaling a fundamental shift in doctrine, von der Leyen issued a direct ultimatum: “Words are good. But deeds are better.”
- The Defensive Arsenal: Brussels is escalating beyond traditional anti-dumping tariffs, actively deploying the Foreign Subsidies Regulation (FSR), the International Procurement Instrument (IPI), and establishing a centralized European Critical Raw Materials Corporation under the RESourceEU framework.
- Supply Chain Exposure: European and Asian enterprises face heightened compliance scrutiny, potential market access restrictions, and supply chain realignment risks across green-tech, automotive, and critical mineral sectors.
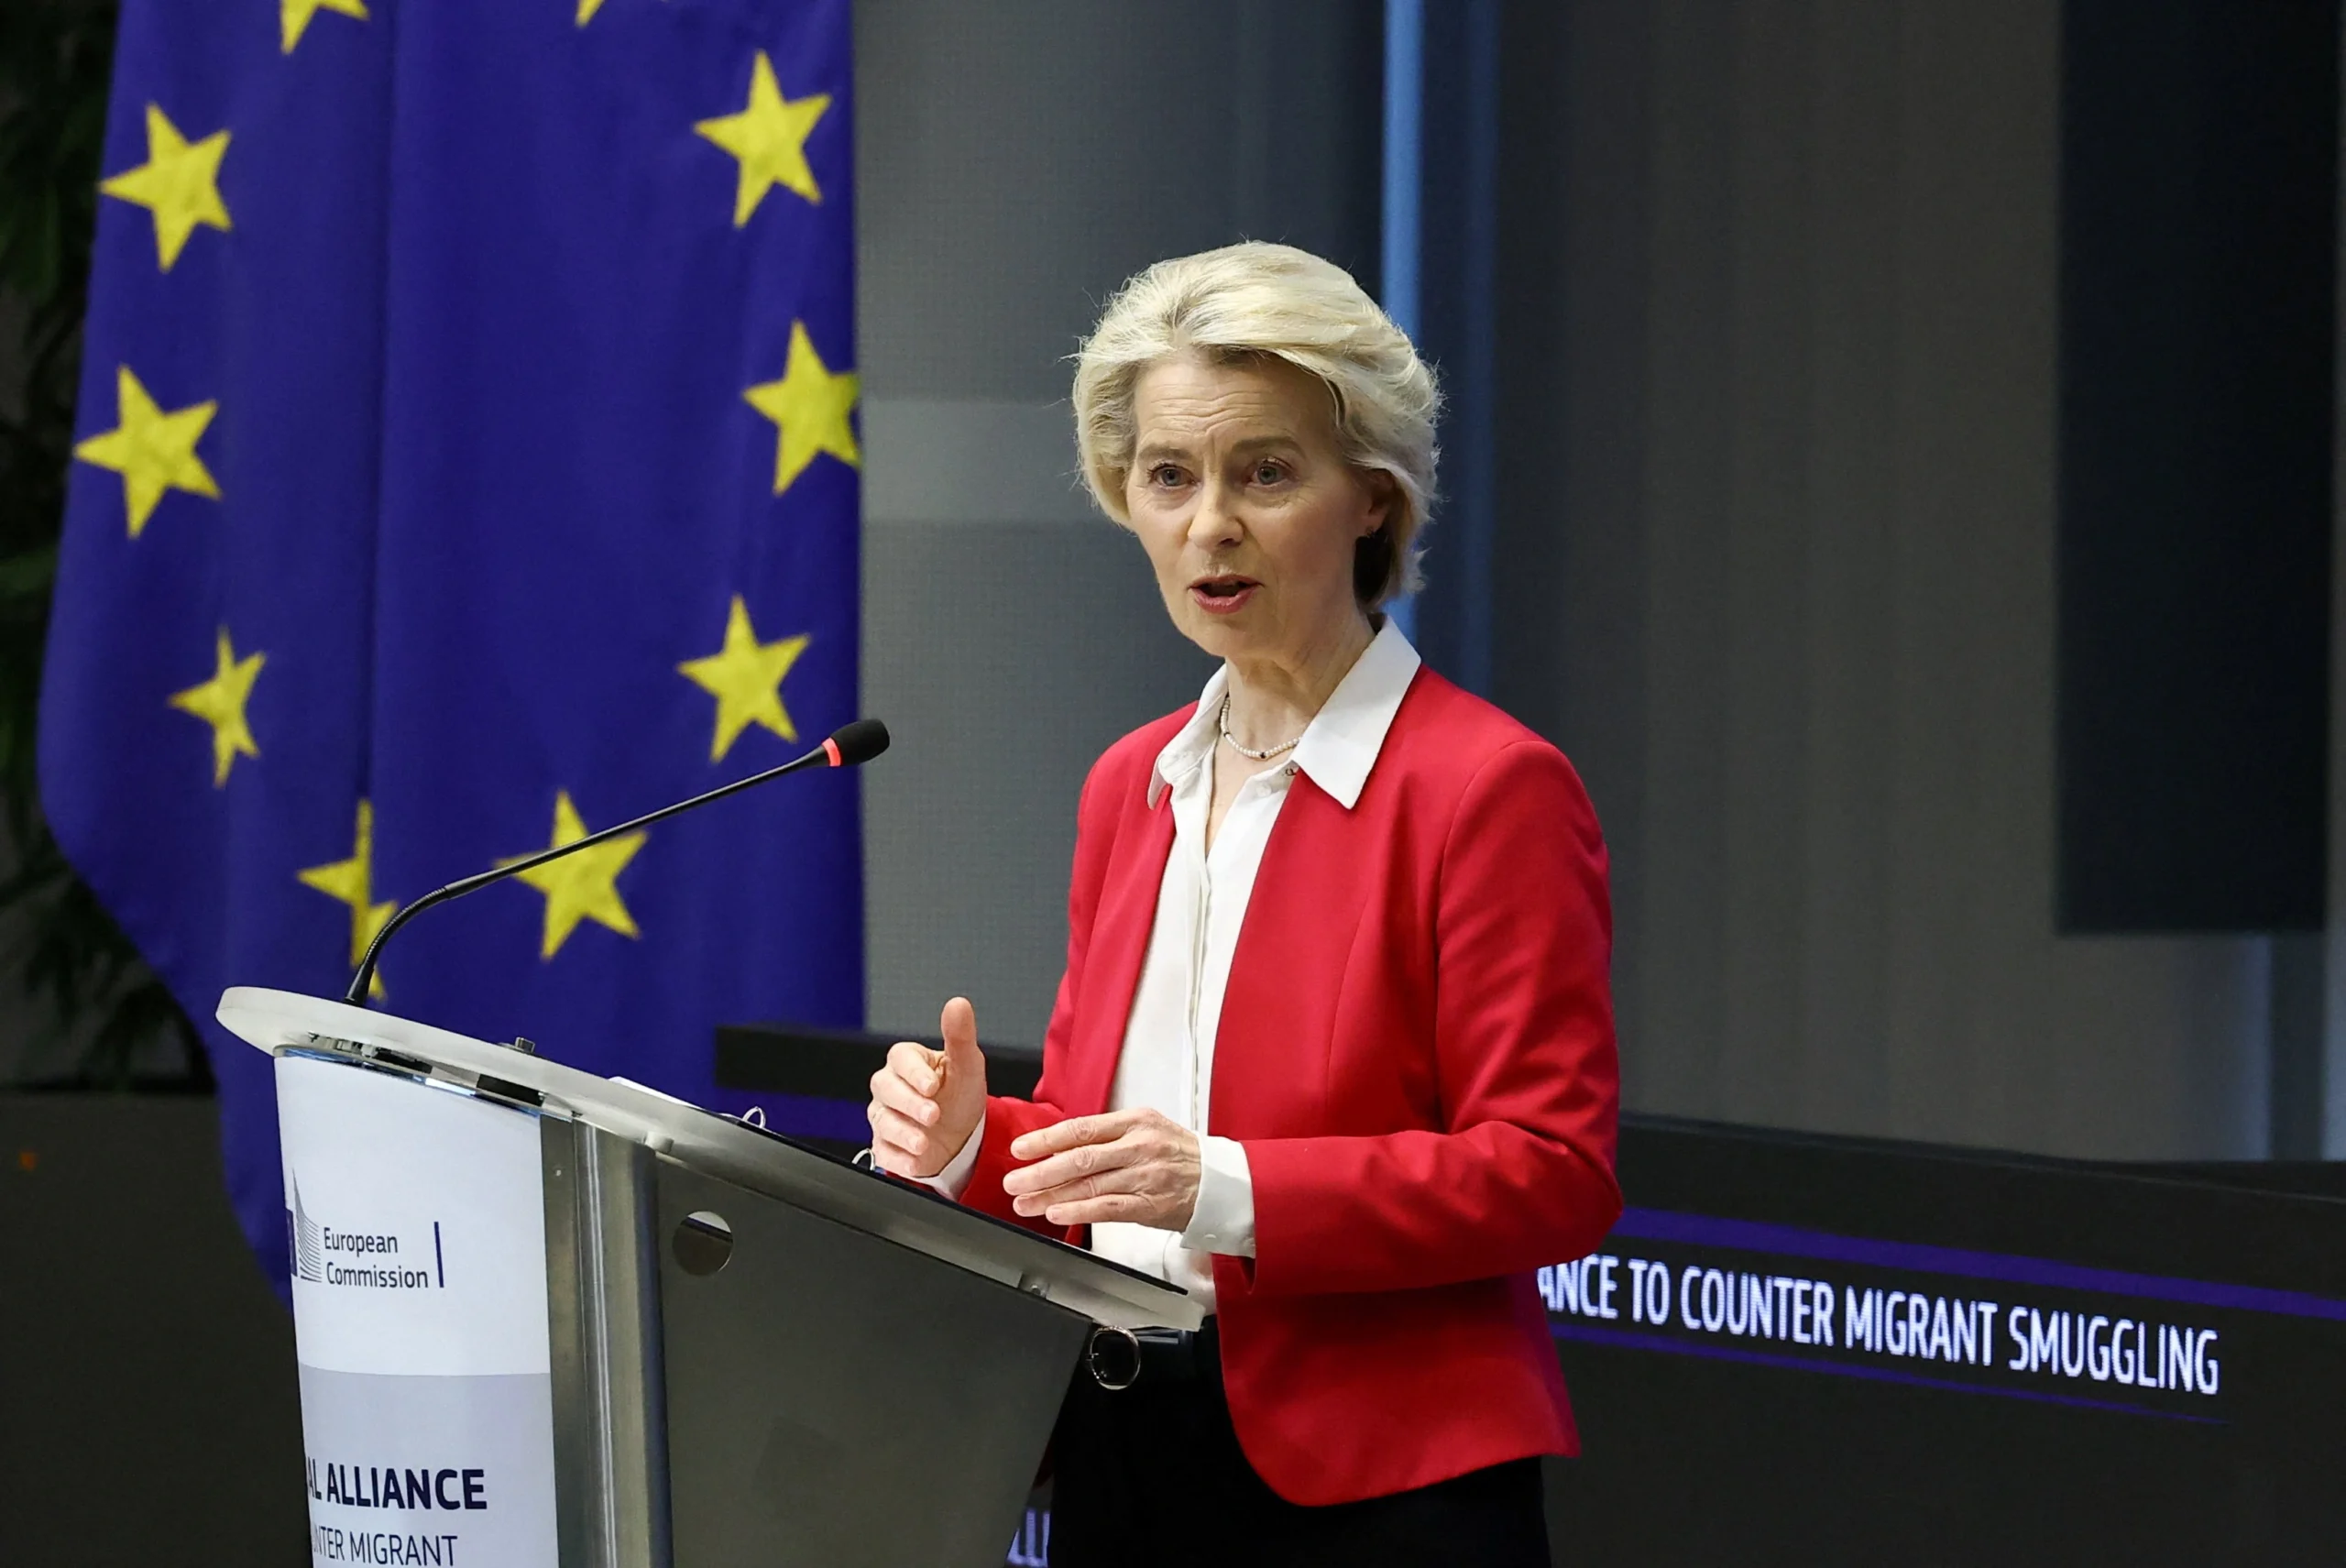
Commission President von der Leyen outlining EU trade policy in Brussels. Source: Yves Herman / REUTERS
The €1 Billion-a-Day Dilemma: Inside Brussels’ Trade Ultimatum
In her 2026 State of the Union address, European Commission President Ursula von der Leyen delivered her sternest warning to date regarding economic relations with Beijing. Citing structural industrial overcapacity in China and subsidized export dumping into the Single Market, von der Leyen emphasized that Europe’s trade deficit with China—now running at approximately €1 billion every single day—has crossed a critical threshold.
While reaffirming that diplomatic dialogue remains open, von der Leyen signaled that Brussels’ patience with protracted negotiations has expired:
“Words are good. But deeds are better. If market imbalances persist and level-playing-field conditions are not restored, the European Union will use all tools at its disposal to rebalance trade.” — Ursula von der Leyen, President of the European Commission
According to official data released alongside the address by the European Union External Action Service, the EU’s merchandise trade deficit with China has expanded sharply over the past decade. The expansion is driven by state-directed investments in clean technology, advanced industrial machinery, and automotive manufacturing, combined with persistent market barriers facing European exporters in mainland China.
Deconstruction of the EU’s Trade-Defence Arsenal
To move beyond political warnings, the European Commission is mobilizing a multi-layered regulatory architecture designed to shield European industries from non-market practices.
| Trade Defence Instrument | Legal Basis & Focus | Operational Impact on Chinese Exports |
|---|---|---|
| Foreign Subsidies Regulation (FSR) | EU Regulation 2022/2560 | Allows Brussels to inspect and block foreign state-subsidized companies from bidding on EU public tenders or acquiring European firms. |
| International Procurement Instrument (IPI) | EU Regulation 2022/1031 | Restricts access to EU public procurement markets for companies from countries that discriminate against EU businesses. |
| Anti-Subsidy & Anti-Dumping Duties | EU Regulation 2016/1037 | Enables retroactive tariffs on subsidized goods (e.g., Electric Vehicles, solar modules, wind turbines). |
| Critical Raw Materials Corporation (RESourceEU) | 2026 Industrial Strategy | Co-finances joint purchasing, strategic stockpiling, and processing of rare earth elements to reduce single-source dependency. |
As highlighted by macroeconomic analysis from Reuters Global Economic News, the Commission’s strategy represents a transition from reactive tariff enforcement to proactive market access restriction.
EU and China trade relations face growing regulatory and tariff barriers. Source: Bloomberg / Bloomberg via Getty Images
De-Risking in Action: Critical Minerals & the RESourceEU Imperative
A core pillar of von der Leyen’s strategic agenda is severing Europe’s vulnerable supply chain dependencies. China currently controls over 70% of global lithium refining, 85% of rare earth processing, and a dominant share of permanent magnet manufacturing.
To counter this vulnerability, von der Leyen confirmed the formal launch of the European Critical Raw Materials Corporation under the broader RESourceEU initiative. This entity will serve as a centralized buyer and investor, co-funding strategic mining, processing, and recycling projects within the EU, North America, and partner nations across Africa and Latin America.
Key objectives of the mineral security framework include:
- Extraction Mandates: At least 10% of the EU’s strategic raw materials extracted domestically by 2030.
- Processing Sovereignty: At least 40% of the EU’s annual consumption of strategic raw materials processed within the bloc.
- Diversification Caps: No more than 65% of any strategic raw material sourced from a single third country.
Economic reporting by the Financial Times Trade Analysis notes that these targets represent one of the most aggressive state-supported supply chain realignment efforts in modern European history.
Geopolitical Fallout & Beijing’s Countermeasures
Beijing’s Ministry of Commerce (MOFCOM) has expressed strong opposition to Brussels’ hardening stance, warning that increased trade barriers risk destabilizing global recovery and violating World Trade Organization (WTO) principles.
In response to European investigations under the FSR and anti-subsidy rules, China has initiated targeted anti-dumping probes into European exports, including brandy, dairy products, and agricultural machinery. Analysts anticipate that further unilateral measures by Brussels could prompt reciprocal restrictions on European automotive and chemical majors operating in mainland China.
+-----------------------------------------------------------------------+
|                 EU-CHINA TRADE TENSION CASCADE MATRIX                  |
+-----------------------------------------------------------------------+
| 1. EU Measures: FSR Inspections, Tariff Escalation, Raw Material Caps |
|    │                                                                  |
|    ▼                                                                  |
| 2. Chinese Countermeasures: Target Agribusiness, Spirits, Luxury Goods|
|    │                                                                  |
|    ▼                                                                  |
| 3. Corporate Impact: Supply Chain Realignment, Dual-Hub Production    |
+-----------------------------------------------------------------------+
Strategic Playbook for Global Business Leaders
For corporate executive teams and supply chain planners navigating this evolving landscape, the European Union Trade Policy Framework recommends three strategic adjustments:
- Audit State Subsidy Exposure: European subsidiaries of non-EU firms must conduct thorough audits of parent company subsidies, tax credits, and state grants to avoid disqualification under FSR procurement reviews.
- Diversify Critical Mineral Sourcing: Manufacturers reliant on graphite, neodymium, lithium, or cobalt should secure secondary supply contracts outside China ahead of 2027 compliance deadlines.
- Adopt “China + 1” Regionalization: Multinationals serving both European and Asian markets should decouple supply chains into distinct regional hubs to insulate operations from tariff hikes and export controls.
Discover more from The Economy
Subscribe to get the latest posts sent to your email.

Key Takeaways
- SpaceX reportedly completed a public listing in 2026, with reporting describing a valuation in the trillion-dollar range — a landmark event that shifted the bulk of Musk’s net worth away from Tesla and into SpaceX/xAI.
- xAI was folded into SpaceX in February 2026, combining Tesla, X, SpaceX, and xAI under increasingly overlapping ownership and infrastructure.
- Tesla’s Q2 2026 revenue came in at roughly $28 billion with a thin 1.4% operating margin, as capital expenditure surged toward AI and robotics rather than core EV production.
- Musk has reportedly been living near xAI’s Colossus supercomputer campus in Memphis during its latest expansion — a callback to his “production hell” habits at Tesla in 2017–18.
- Regulatory scrutiny is intensifying on multiple fronts: xAI’s Grok image generator has drawn investigations in Europe, Asia, Australia, and California, and Democratic senators have called for a Pentagon probe into SpaceX’s ownership structure.
The Portfolio, Reorganized
Musk’s business empire in 2026 looks structurally different than it did even eighteen months ago. Tesla, once the dominant source of his net worth, now sits alongside a combined SpaceX-xAI entity (sometimes referred to as SpaceXAI) that reporting has valued well into the trillions following its 2026 public-market debut. That shift matters for how markets should think about “Musk risk” — it’s no longer a single-stock story concentrated in Tesla.
Tesla: Thin Margins, Heavy AI Bet
Tesla’s Q2 2026 results showed the tension in the company’s current strategy:
- Revenue of roughly $28.2 billion against an operating margin of just 1.4% — among the thinnest in years.
- Capital expenditure up sharply year-over-year, directed heavily at AI and robotics infrastructure rather than incremental EV capacity.
- Robotaxi (Cybercab) and Optimus humanoid robot programs remain the company’s stated long-term growth bets, with Musk targeting expanded autonomous deployment across a meaningful share of the U.S. by year-end.
xAI: Burning Cash to Build Compute
xAI, now under the SpaceX umbrella, has been reported to consume roughly $1 billion per month in compute and infrastructure spend against an estimated $500 million in annualized revenue — a deliberately loss-leading posture aimed at building frontier AI capability (Grok) at scale. The Memphis “Colossus” supercomputer campus is the physical center of that buildout, and Musk’s decision to base himself near the site during its latest expansion signals how central it is to his current priorities.
The Regulatory Overhang
Musk’s expanding footprint has drawn parallel scrutiny across jurisdictions:
- xAI’s Grok image generator is under investigation in multiple countries over its capacity to generate harmful synthetic imagery.
- Senate Democrats have pushed for a Pentagon review of SpaceX’s ownership structure over undisclosed foreign investment concerns.
Neither issue has produced conclusive regulatory action as of this writing, but both represent tail risk for a portfolio increasingly concentrated in Musk-controlled entities.
Why This Matters Beyond Musk Himself
Musk’s 2026 moves are a useful proxy for a broader market theme: the shift of enormous private capital into AI infrastructure at a pace that outstrips current revenue generation. Whether that pattern resolves into durable competitive advantage (as bulls argue) or a capital-intensive cautionary tale (as skeptics argue) is likely to be one of the defining market questions through 2027.
What is Elon Musk’s biggest 2026 business move?
The completion of SpaceX’s public listing and its merger with xAI, reportedly valuing the combined entity in the trillions and shifting the majority of Musk’s net worth away from Tesla for the first time.
Discover more from The Economy
Subscribe to get the latest posts sent to your email.

Global Pension Systems Ranked: The World’s Best and Worst Retirement Frameworks

Global Supply Chain Vulnerabilities: From Eurasian Trade Corridors to Food Consumer Recalls

Why 5% U.S. Treasury Yields Signal a Global Market Regime Shift.

Federal Reserve Defies White House Pressure: Inside Trump’s Demand for Sub-1% Interest Rates After Historic 2026 Rate Hike

How Rising Interest Rates Impact Gig Economy Apps: DoorDash, Uber, and Urban Services

GasBuddy Market Insights: How Crude Price Shifts Impact Local Fuel Cost Averages

DoorDash Driver Payouts, Fee Structures, and Market Competition Analysis

OPINION:Breaking the 3.5% Growth Trap: How Pakistan Can Build a High-Productivity Export Economy

Global Equity Market Divergence: US Tech vs. European Dividend Stocks vs. Asian Growth

Asian Markets Analysis: Navigating Volatility in China, Japan, and Singapore Stocks

Stagflation vs. Soft Landing: How Central Bank Rates Are Reshaping European and Asian Economies

IMF & World Bank Global Economic Outlook: Growth Forecasts Across Europe and Asia

Fed Rate Hike Projections vs. Trump’s Interest Rate Policy: What Global Markets Expect Next

Singapore Stocks: The Ultimate Safe Haven for Markets and Finance in 2026?

State Farm’s $5B Dividend 2026: Who Qualifies & Payout Dates

US-China Relations in Q3 2026: Trade Tariffs and Supply Chain Risks

SpaceX Starship Flight 14: First Orbital Attempt & Starlink V3 Launch Explained

Top 30 Stocks for Investment in PSX for Massive ROI in 2026

The 2026 Crypto Regulatory Shift: What It Means for Institutional Investors

AI Chip Stocks 2026: The Best Semiconductor Investments Beyond Marvell

AI-Powered Training: The Next Multi-Billion Dollar Ecosystem in Fitness

Tween Back-to-School Trends 2026: What’s Driving the $85B Season

Oil Prices Break $100 in 2026: Middle East Conflict & Energy Markets

10-Year Treasury Yield Hits 4.80%: What It Means for Rates & Portfolios

Shein Clothes Quality & Safety in 2026: What Lab Tests Show

Fidelity Investments Review 2026: SPAXX Yields & Zero-Fee Funds

MRVL Earnings 2026: Why Marvell Sank Despite Beating Estimates

China’s US$10.8 Billion Trade Shortcut: Why the Pinglu Canal Matters
-

 Markets & Finance9 months ago
Top 15 Stocks for Investment in 2026 in PSX: Your Complete Guide to Pakistan’s Best Investment Opportunities
-

 Analysis7 months ago
Johor’s Investment Boom: The Hidden Costs Behind Malaysia’s Most Ambitious Economic Surge
-

 Analysis7 months ago
Top 10 Stocks for Investment in PSX for Quick Returns in 2026
-

 Analysis7 months ago
Brazil’s Rare Earth Race: US, EU, and China Compete for Critical Minerals as Tensions Rise
-

 Banks8 months ago
Best Investments in Pakistan 2026: Top 10 Low-Price Shares and Long-Term Picks for the PSX
-

 Investment8 months ago
Top 10 Mutual Fund Managers in Pakistan for Investment in 2026: A Comprehensive Guide for Optimal Returns
-

 Global Economy9 months ago
15 Most Lucrative Sectors for Investment in Pakistan: A 2025 Data-Driven Analysis
-

 Global Economy9 months ago
Pakistan’s Export Goldmine: 10 Game-Changing Markets Where Pakistani Businesses Are Winning Big in 2025