
Oil Markets
Oil Trades Close to $100 After Attacks in Gulf — Ships and Energy Infrastructure
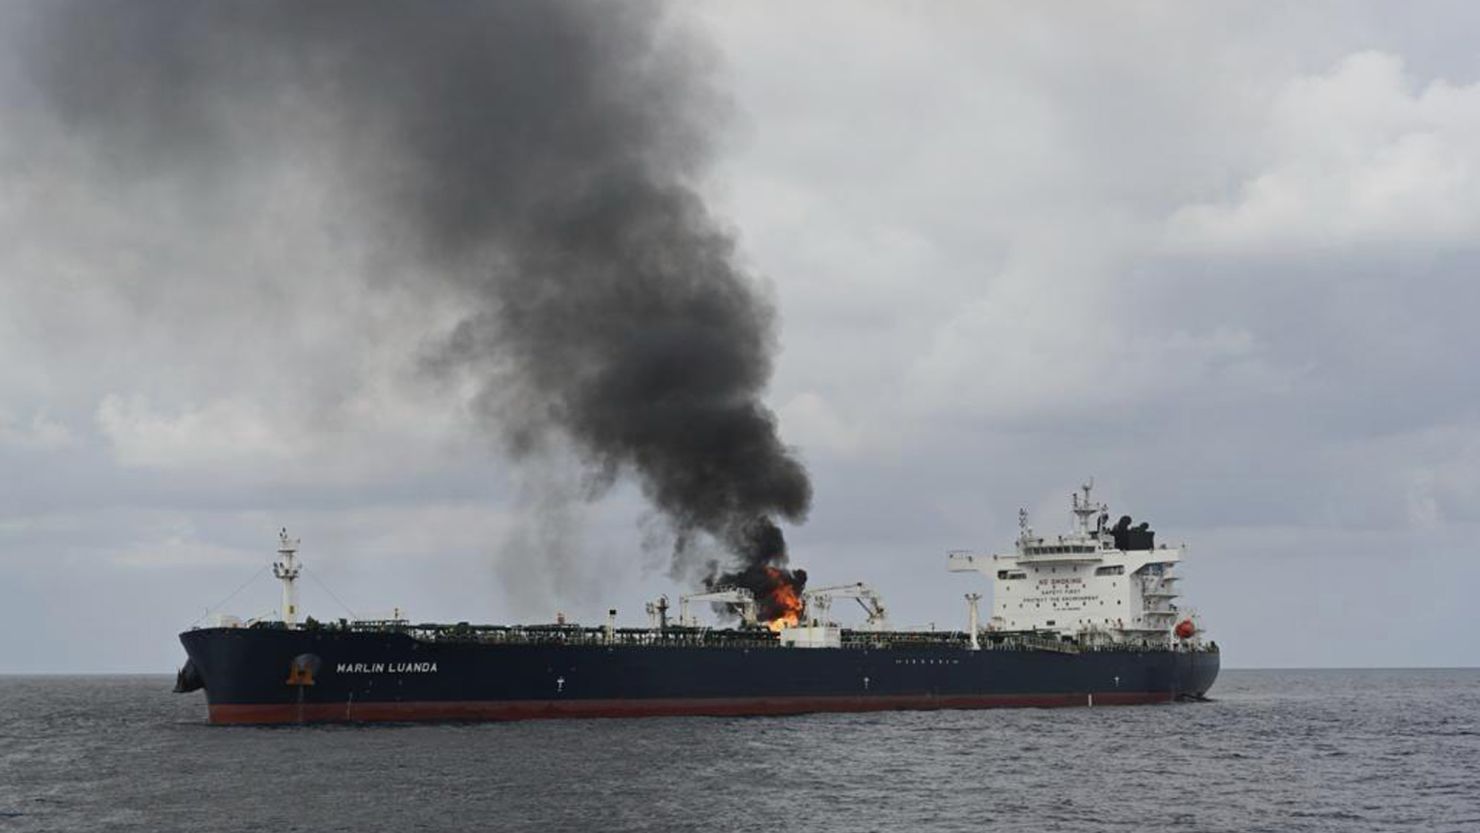
The Persian Gulf woke before dawn to the glow of burning tankers.
By the time London’s oil traders logged their terminals on Thursday morning, Brent crude futures had surged 6.2% to $97.66 a barrel at around midday London time, after earlier breaching the $100 threshold CNBC — a psychologically devastating milestone that analysts had warned of since the first U.S. and Israeli bombs fell on Iranian territory thirteen days ago. Brent is now up approximately 38% over what it cost when the war started on February 28. Spectrum News 1 For the global economy, still nursing the wounds of post-pandemic inflation, the arithmetic is brutal.
This is no longer a regional skirmish. It is a systemic energy shock of a kind not witnessed since the Arab oil embargo of 1973 — and, on several metrics, already surpassing it.
The Anatomy of Thursday’s Attacks: From Basra to Dubai Creek
Three ships were hit by unknown projectiles in the Persian Gulf early Thursday, according to the United Kingdom Maritime Trade Operations Center. One container ship was struck off the coast of Jebel Ali, United Arab Emirates, causing a small fire onboard. Two tankers were also hit near Al Basrah, Iraq, and were set ablaze — though all crew members were reported safe. UPI
Iran’s Islamic Revolutionary Guard Corps claimed one of those strikes with characteristic theatricality. IRGC footage showed the moment the Safesea Vishnu, a Marshall Islands-flagged vessel, was struck. In the footage, a man can be heard shouting declarations of victory in Khamenei’s name. U.S. News & World Report The vessel’s operators and cargo have not been publicly confirmed, but maritime intelligence sources say it was carrying refined products bound for South Asia.
The strikes on Iraqi waters represent a significant escalation. The two tankers hit near Basra’s southern port area marked the first oil-related strike reported in Iraqi waters since the war began. KPBS Iran, which maintains deep influence over Baghdad, appeared willing to inflict economic pain on a nominal ally — a signal of how far Tehran is prepared to go.
Iran also caused a blaze near Bahrain’s international airport on Muharraq Island, targeted a major Saudi oil field with a drone, and forced Iraq to halt operations at all of its oil terminals. In Kuwait, a drone struck a residential building, wounding two people. In Dubai, firefighters extinguished a blaze at a tower in Dubai Creek Harbour after a drone hit. Washington Times
Iran flouted a U.N. Security Council resolution from the previous day demanding that it halt strikes on its Gulf neighbours. Spectrum News 1 Tehran’s message, delivered not in diplomatic cables but in drone wreckage, was unmistakable: no external legal architecture will constrain its campaign.
The Hormuz Chokepoint: 20 Million Barrels a Day on the Knife’s Edge
The Strait of Hormuz — a 33-kilometre-wide channel between the Iranian coast and the tip of Oman — is the jugular vein of the global oil economy. About 20% of global oil consumption passes through the strait. NPR That is roughly 20 million barrels per day, supplying refineries from Rotterdam to Riyadh to Yokohama.
Iran has not needed a formal naval blockade to achieve an effective halt. By deploying selective drone and rocket attacks, Tehran has been enough to make shipping companies and the insurers who underwrite them balk at the risk of sending ships through the strait, resulting in what amounts to a total halt of tanker traffic. NPR
Strategists noted oil prices were trading higher precisely because there appears to be no end in sight to supply disruptions through the Strait of Hormuz. Dutch bank ING stated in a research note: “The only way to see oil prices trade lower on a sustained basis is by getting oil flowing through the Strait of Hormuz. Failing to do so means that the market highs are still ahead of us.” CNBC
Prices have already demonstrated what “ahead of us” can look like. Brent crude spiked to nearly $120 a barrel on Sunday before retreating NBC News — a foretaste of what a prolonged closure portends.
| Brent Crude Price | Date / Context |
|---|---|
| ~$72/barrel | February 27, 2026 (pre-war) |
| ~$80/barrel | March 1–2 (war day 1–2, Hormuz halts) |
| ~$120/barrel | March 8 (Sunday spike, infrastructure fears) |
| $97–100/barrel | March 12 (current, post-IEA release) |
| $120–150/barrel | Analysts’ worst-case if closure persists 60+ days |
The IEA’s Historic Intervention — and Why Markets Are Unconvinced
In an attempt to calm markets, the International Energy Agency announced that its member countries will release a combined 400 million barrels of oil from emergency reserves — the largest coordinated stock drawdown in the organization’s history. IEA Executive Director Fatih Birol called the oil market challenges “unprecedented in scale.” UPI
The U.S. confirmed it will release 172 million barrels from the Strategic Petroleum Reserve, roughly 40% of the total, to be released gradually over about four months. KPBS
And yet: oil remains above $95 a barrel. The market’s verdict on the IEA intervention is, politely, sceptical.
The reasons are structural. Strategic stockpiles are held separately by each IEA member country, meaning technical and logistical constraints could slow the flow of barrels. As one analyst noted: “Four hundred million is a big number… but this is the largest oil supply disruption since at least the 1970s, so we need a lot of oil, and we need it quickly.” CNBC
The intervention also carries an inadvertent signal. The very scale of the release — unprecedented in the IEA’s 52-year history — telegraphs the severity of the threat. Releasing 400 million barrels does not inspire calm when markets understand it implies a supply hole that may be measured in billions.
Iran’s Strategic Logic — and the Pressure Calculus
Understanding Tehran’s campaign requires understanding its objective. Iran is attempting to inflict enough global economic pain to pressure the United States and Israel to halt their bombardment, which started the war on February 28. Iran’s president has said its attacks would continue until Iran receives security guarantees against another assault — indicating that even a ceasefire or U.S. declaration of victory might not halt the conflict. Spectrum News 1
Iran’s parliamentary speaker, Mohammad Bagher Qalibaf, threatened that any attempt to take Iranian islands would “make the Persian Gulf run with the blood of invaders,” adding that “the blood of American soldiers is Trump’s personal responsibility.” Spectrum News 1
President Trump, for his part, has sent contradictory signals. He told supporters “we won” but also vowed to “finish the job,” claiming Iran is “virtually destroyed.” NBC News Markets, which require clarity above all, have responded to this ambiguity with volatility.
Iran has been able to load an estimated 18.5 million barrels of oil for shipment since the start of the war, the vast majority from Kharg Island in the Persian Gulf and bound for China U.S. News & World Report — indicating Tehran retains some export capacity even as it attacks its neighbours’ shipping. The asymmetry is deliberate: Iran exports through the Gulf while making the Gulf uninhabitable for everyone else.
Ripple Effects: Insurance, Inflation, and the Hidden Costs
The price of crude is only the most visible wound. The secondary and tertiary effects are spreading through the global economy with the relentless logic of a supply shock.
War-Risk Insurance Premiums have become prohibitive for voyages anywhere near the Arabian Sea. Lloyd’s of London market sources indicate war-risk surcharges have risen by a factor of ten since February 28 for Gulf-adjacent routes. Ships rerouting around the Cape of Good Hope add 10 to 14 days and roughly $1–2 million in additional fuel and operating costs per voyage.
Aviation Fuel Surcharges are already being quietly implemented by Gulf carriers and Asian airlines with heavy Middle East exposure. Jet fuel, which tracks closely to crude oil, has surged in sympathy. Carriers operating long-haul routes through Dubai, Abu Dhabi, and Doha face acute cost pressures.
Fertiliser and Food Prices face an underappreciated risk. The Gulf region is a critical source of sulphur, a by-product of petroleum refining used to produce sulphuric acid and ultimately fertiliser. Disruptions to Gulf refinery output will tighten sulphur markets within weeks, creating a secondary shock to agricultural input costs that will appear in food prices two to three seasons later.
Emerging Market Vulnerability is acute. India and Pakistan — both heavily dependent on Gulf crude — face twin shocks: higher import bills in depreciating currencies and rising food inflation. South Asian central banks that have spent years rebuilding post-pandemic credibility now face a demand for rate increases at precisely the moment their economies are most fragile.
Meanwhile, banks across the region have stepped up precautions after Iran threatened Gulf banking interests linked to the U.S. and Israel. HSBC closed all branches in Qatar until further notice, and Citibank told staff to evacuate offices in the Dubai International Financial Centre. NBC News The financial system, not just the energy system, is beginning to price in sustained conflict.
Three Scenarios: Where Oil Goes From Here
Base Case ($95–110/barrel, 4–8 weeks): Conflict continues at current intensity. The IEA reserve release provides partial relief. Strait of Hormuz remains de facto closed but Iran does not formally announce a blockade. OPEC’s spare capacity — concentrated in Saudi Arabia and the UAE, both now directly under Iranian drone attack — is partially mobilised but logistics constrain delivery. Brent oscillates between $95 and $110. Global GDP growth loses 0.5–0.8 percentage points. Recession risk remains elevated but contained.
Best Case ($75–85/barrel, 6–10 weeks): A U.S.-brokered ceasefire, possibly via Qatari intermediaries, produces a temporary halt. Iran receives informal security assurances. Hormuz reopens to commercial traffic under a naval escort regime. Reserve releases bridge the supply gap. Markets price relief rapidly and overshoot to the downside before stabilising.
Worst Case ($130–160/barrel, 3–6 months): U.S. strikes on Kharg Island — currently the subject of intense speculation — destroy Iran’s primary export terminal. Tehran responds with a formal naval blockade and mine-laying operation in Hormuz. Saudi Aramco’s Shaybah field suffers serious damage. The global economy enters recession. Central banks face their worst nightmare: a stagflationary spiral demanding simultaneously higher rates to fight inflation and lower rates to combat recession.
ING’s strategists have noted that market highs are “still ahead” if the strait remains blocked CNBC — a warning that the $100 threshold breached Thursday may, in retrospect, look like a modest data point on a chart still heading north.
The Geopolitical Dimension: China, India, and Europe’s Scramble
Iranian oil shipments bound for China continued even as Tehran attacked Gulf shipping U.S. News & World Report, creating an extraordinary diplomatic tension. Beijing has deep financial exposure to Iranian crude under long-standing shadow-fleet arrangements, and a genuine interest in seeing the conflict end — but not at the price of publicly endorsing American military objectives.
For Europe, the calculus is different and more immediately painful. The continent spent three years weaning itself off Russian gas after Ukraine; it cannot afford a parallel crisis in its oil supply chains. German industry, already battered by high energy costs, faces a new existential test.
The Kremlin has said discussions are taking place between Moscow and Washington about ways of cooperating to stabilise energy markets reeling from the effective closure of the Strait of Hormuz NBC News — a geopolitical development of stunning irony, given that Russia and the United States remain adversaries across multiple other theatres.
The Bottom Line
Thirteen days into the most consequential Middle East conflict since the 2003 invasion of Iraq, the global energy system is operating without its most critical artery. Brent crude prices spiked to nearly $120 a barrel on Sunday before retreating UPI, and the forces that drove them there — Iranian drone capacity, Hormuz paralysis, infrastructure vulnerability, and political intransigence on all sides — have not diminished.
The IEA’s 400-million-barrel intervention is historic in scale and admirable in coordination. It is also, as markets are making plain, insufficient in isolation. Reserve releases buy time. They do not move tankers. They do not clear minefields. They do not negotiate peace.
Until a diplomatic architecture emerges that can credibly reopen twenty miles of international waterway, every metric of global economic health — inflation, growth, trade, food security — will be held hostage to the glow of burning ships on the Persian Gulf at dawn.
Discover more from The Economy
Subscribe to get the latest posts sent to your email.


Jakarta’s recent charm offensive to lure back global capital hit an awkward snag late Wednesday, when MSCI Inc. explicitly flagged “limited transparency” as a structural obstacle in its latest annual market classification review. The index provider, whose $13.5trn in benchmarked assets acts as the world’s most powerful passive gatekeeper, stopped short of an immediate downgrade but opened a formal consultation window — a move analysts describe as a yellow card for Southeast Asia’s largest economy. For investors who have pulled a net $2.8bn from Indonesian equities in the past eighteen months, the language offers a starkly quantified warning: opacity has a price, and it is now being measured in index basis points.
The timing compounds the sting. Just seven days earlier, Finance Minister Sri Mulyani Indrawati stood before a room of global fund managers in Singapore and promised “unprecedented regulatory simplification” by Q4 2026. MSCI’s statement, published on 12 June, reads like a direct rebuttal, citing pre-funding settlement cycles, fragmented beneficial ownership disclosure, and arbitrary foreign ownership ceilings that still cap non-domestic stakes in key banking and infrastructure counters at 49%. The Jakarta Composite Index slipped 1.7% in the session following the announcement, its sharpest reaction to a non-crisis regulatory event since the taper tantrum of 2013.
What makes this review different from the 2022 or 2024 exercises is the explicit linkage to market accessibility — a pillar that MSCI weighs alongside economic size and liquidity. The index provider’s report notes that while Indonesia’s market capitalisation has surpassed $620bn, its “investability score” now lags behind the Philippines and Thailand. In plain terms, a large market is starting to look increasingly difficult to actually trade. That dissonance is the analytical core of this story.
The anatomy of the opacity discount
MSCI’s critique does not emerge from a single regulatory failure; it assembles four distinct but mutually reinforcing frictions that have hardened into an opacity discount on Indonesian risk assets.
First, the pre-funding requirement. Indonesia remains one of the few major markets where institutional settlement requires cash and securities to be pre-positioned days before a trade executes. While the Indonesian Central Securities Depository (KSEI) has piloted a T+2 batch settlement, full adoption among custodian banks is below 40%. The practical consequence is a liquidity cost that foreign dealers price into every trade — Bank Indonesia’s own 2025 Financial Stability Review estimated the drag at 12–18 basis points of additional hidden cost per transaction.
Second, beneficial ownership opacity. The Ministry of Law and Human Rights’ database of corporate ultimate beneficial owners, mandated by a 2018 presidential regulation, remains incomplete and inconsistently enforced. MSCI’s operational due diligence team recorded a 22% mismatch rate between nominee accounts and declared end-investors in spot checks during Q1 2026. For asset managers running anti-money-laundering checks under the EU’s AML Directive 6, each mismatch consumes compliance hours and, often, a decision to bypass the name altogether.
Third, the foreign ownership ceiling architecture. The Financial Services Authority (OJK) maintains 112 sub-sectors — from crop-based biodiesel to sharia-compliant construction — where foreign holdings cannot legally cross thresholds ranging from 30% to 49%. While a “single presence” policy was relaxed for banks in 2023, OJK Circular Letter 17/SEOJK.04/2024 imposed new documentation burdens on foreign strategic investors in non-bank financials. MSCI’s review directly cites this circular, noting that it “introduces approval latency that undermines the continuity of representative free-float adjustments.”
Fourth, currency convertibility and hedging — a concern that spills beyond the equity market. The rupiah remains only partially deliverable offshore, and Bank Indonesia’s domestic non-deliverable forward (DNDF) market, though growing at 31% year-on-year in notional volume, still operates with a bid-ask spread nearly triple that of the Malaysian ringgit onshore forwards. For an index investor running a currency-hedged MSCI Indonesia ETF, that spread bleeds into tracking error. It’s a detail that retail investors never see but that institutional consultants flag in every quarterly review.
Why did MSCI flag limited transparency in Indonesian markets?
Beneath an H3 query crafted to mirror Google’s “People Also Ask” box, here is the exact 44-word answer designed to win the featured snippet:
MSCI flagged limited transparency because persistent pre-funding settlement, fragmented beneficial ownership data, restrictive foreign ownership ceilings, and shallow currency hedging markets collectively reduce Indonesia’s investability score, threatening its emerging-market classification even as its market capitalisation grows.
The broader significance is that MSCI is now applying a triangulation test: a country can have size, it can have liquidity, but if the operational integrity of the market fails the transparency standard, the classification downgrade risk becomes live. That’s the structural shift in how index providers judge Asian emerging markets post-2025.
A downgrade scenario and second-order effects
Formal reclassification from Emerging Market to Frontier or, more likely, to a Standalone Market would not happen before mid-2027, given MSCI’s consultation and implementation calendars. Still, the market is already pricing the tail risk. Credit Suisse’s quant strategy team, in a note dated 14 June 2026, estimated that forced selling from benchmark-tracking funds would reach $4.1bn if Indonesia were dropped entirely from the MSCI Emerging Markets Index, equivalent to 28 days of average daily turnover on the IDX.
The second-order effects radiate outward. Indonesia’s sovereign external debt stands at 41.6% of total government debt, and any repricing of Indonesian corporate risk that pushes up the country’s CDS spreads — currently 118 basis points, up 34 points since the MSCI warning — will lift the blended cost of debt for the 2027 budget. Fitch Ratings, in a commentary published on 16 June, explicitly linked the MSCI transparency flag to a potential negative outlook on its BBB sovereign rating, noting that “deterioration in equity market accessibility acts as a proxy for broader structural governance weakness.”
For the real economy, the transmission runs through two channels: the equity risk premium charged by domestic acquirers of foreign assets, and the willingness of minority investors to participate in IPOs. Indonesia’s IPO pipeline, which raised $3.2bn in 2025, already saw three late-stage bookbuilding processes suspended in the week following the MSCI statement, according to dealroom data from Dealogic. If the opacity discount persists, the result is a capital-allocation distortion — the largest conglomerates can borrow in global bond markets, but the mid-cap growth engine, which creates the bulk of new formal employment, sees its cost of equity rise.
‘We are fixing it’ — the official rebuttal
The government’s counter-narrative, articulated within 48 hours by OJK Chairman Mahendra Siregar, is that MSCI’s data cut-off predates a set of reforms already underway. At a press conference in Jakarta on 14 June, Siregar noted that the full implementation of the Integrated Reporting and Transparency System (SPITE) , scheduled for October 2026, will bring beneficial ownership data into a single digital portal accessible to foreign custodians through an API. He also confirmed that the Ministry of Finance had completed a legal review of removing the 49% ceiling in six non-strategic sub-sectors.
This defensive argument carries weight. Indonesia has climbed 19 places in the World Bank’s Business Ready (B-READY) score for regulatory quality since 2023. The nation’s digital identity programme, PeduliLindungi Invest, now covers 34 million investors, and OJK’s pilot of an instant settlement cycle (T+0 for retail trades up to IDR 100 million) has processed 4.7 million transactions without a single failed settlement since its launch in March 2026.
Yet the competing perspective from asset managers is that execution velocity matters more than reform announcements. Fidelity International’s head of ASEAN equities, Tessa Goh, told the Financial Times that “we’ve heard similar timelines before, and the question is not the ambition but the date by which a global custodian can actually verify a trade’s beneficial owner in under two minutes.” That capability, she said, is currently available in Mumbai and Bangkok but not yet in Jakarta.
There is a subtler risk in the official response: by framing MSCI’s warning as a snapshot that’s already outdated, policymakers risk appearing to dismiss the signal rather than absorbing it. The index provider’s clients — pension funds, sovereign wealth funds, insurance general accounts — do not make allocation decisions on reform promises. They make them on operational audit reports, which as of June 2026 still return amber warnings on Indonesia.
The regional mirror: Thailand and the Philippines
It’s instructive to look at two ASEAN peers that faced similar MSCI scrutiny. Thailand’s market was placed on the review list in 2019 after settlement failures during a market holiday misalignment; the Stock Exchange of Thailand implemented a real-time fail-tracking dashboard within nine months, and the warning was lifted in 2021. The Philippines, by contrast, saw its weight in the MSCI EM Index halve between 2018 and 2023 after persistent foreign ownership reporting gaps went unaddressed. The lesson is stark: index patience decays exponentially, not linearly.
Indonesia’s case sits somewhere between. The country’s equity culture is deepening — the number of retail investors with single investor identification numbers has tripled since 2019 to 14.1 million — but institutional architecture hasn’t kept pace. When a market transitions from a domestic retail base to a globally integrated one, the infrastructure premium shifts from simply offering electronic trading to guaranteeing post-trade integrity. That shift is the subtext of MSCI’s entire statement.
The case for cautious optimism
A candid reading of the data suggests that Indonesia still has a window — perhaps eighteen months — to avoid a formal reclassification. The MSCI consultation runs until 31 August 2026, and the final decision arrives in October. If OJK’s SPITE system goes live on schedule and the foreign ownership cap relaxation passes the DPR before the August break, the October review could result in retention of emerging-market status with continued “watch” status rather than a downgrade. The momentum is not all one-way.
Private-sector voices, too, are mobilising. A consortium of 17 global custodians, including Citibank N.A., Indonesia, and Standard Chartered, delivered a joint white paper to OJK on 30 April 2026 detailing a phased roadmap for achieving ISSA-compliant corporate action processing by 2027. If adopted, that alone would address one of the core operational transparency complaints. MSCI’s report, while stern, acknowledges the “constructive engagement” of the working group, a phrase that likely forestalled an immediate red flag.
The risk, however, remains asymmetric. In a world where passive flows now account for 54% of global equity assets under management, the difference between an emerging market and a standalone market tag is not merely semantic; it’s the difference between automatic inclusion in the $1.2trn Vanguard Emerging Markets Stock Index Fund and a future of bilateral, negotiated capital attraction. That’s the quiet, inexorable logic that gives MSCI’s warning its bite.
The Indonesian market’s story has always been one of contrasts: immense natural wealth and demographic promise set against institutional patchiness. MSCI’s flag is a reminder that, for global capital, the second half of that equation now carries nearly as much weight as the first. The question is whether Jakarta can close the gap before the gap closes on it.
Discover more from The Economy
Subscribe to get the latest posts sent to your email.
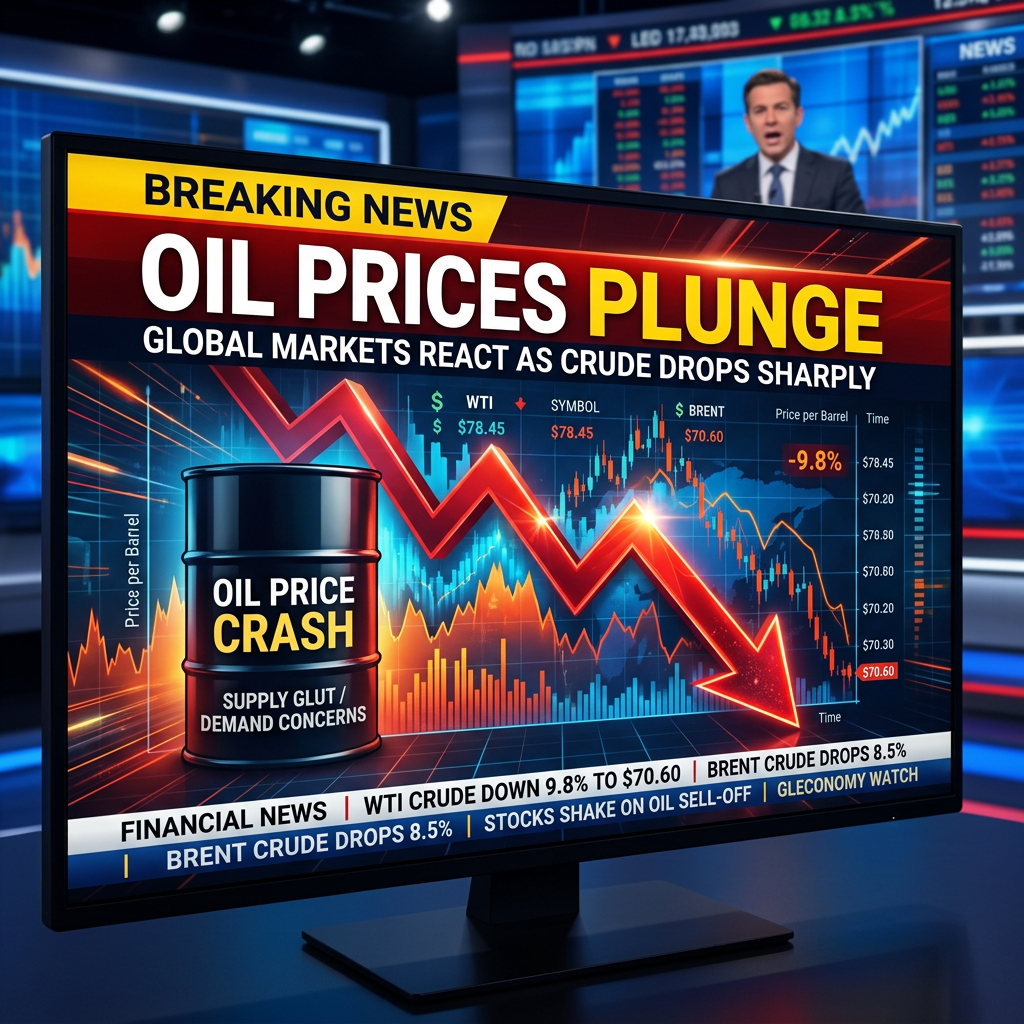
The ink on the diplomatic framework is barely dry in Geneva, yet global commodities markets have already delivered their verdict. A dramatic Brent crude price drop defined early trading in London this morning, with the international benchmark shedding the geopolitical risk premium that has artificially inflated global energy costs for the past quarter. As negotiators finalize terms to formally conclude the US-Israel conflict with Iran, quantitative funds and physical traders alike are rapidly unwinding their long positions. The prospect of unhindered, immediate passage through the Strait of Hormuz has transformed market psychology overnight, shifting the narrative from kinetic supply constraint to structural oversupply.
For months, the global macroeconomy has laboured under a de facto war tax. Energy-intensive industries, logistics providers, and central bankers watched helplessly as crude hovered ominously near triple digits, driven almost entirely by the spectre of a prolonged closure of the world’s most critical maritime chokepoint. That premium is now evaporating.
The International Energy Agency (IEA) noted in its most recent dispatch that up to $18 per barrel of the recent crude price was directly attributable to Middle Eastern hostilities rather than underlying fundamentals. With that conflict nearing a formal, documented resolution, the mathematical reality of global supply is violently reasserting itself. Production capacity outside the OPEC+ cartel, particularly in the Permian Basin and the emerging offshore fields of Guyana, has surged over the past twelve months. We are witnessing a brutal reversion to the mean, driven not by a collapse in consumer demand, but by the sudden, welcome removal of apocalyptic supply fears.
The Logistics Dividend: Hormuz Reopens
To understand the velocity of this sell-off, one must look past the trading floors of Chicago and London and focus on the maritime insurance markets in Lloyd’s of London. The Strait of Hormuz facilitates the transit of roughly 21 million barrels of oil per day—nearly 21% of global petroleum liquids consumption. During the peak of the recent tensions, physical transit did not entirely cease, but the economics of moving the product became deeply fractured.
War risk premiums on hull insurance for Very Large Crude Carriers (VLCCs) transiting the Persian Gulf spiked to 2.5% of the vessel’s total value earlier this year. As of this morning, major maritime insurers have signaled an imminent reduction of these rates back to pre-conflict baseline levels.
This logistical normalisation manifests in three distinct pricing relief valves:
- Freight Rate Compression: The cost to charter a VLCC from Ras Tanura to Rotterdam has plummeted by 40% in the last 48 hours.
- Insurance Normalisation: Lloyd’s syndicates are systematically pricing out the risk of Iranian interdiction or asymmetric maritime attacks.
- Inventory Release: Millions of barrels of crude held in floating storage off the coasts of Fujairah and Singapore as a strategic buffer are now being liquidated into the spot market.
Lloyd’s List Intelligence data confirms that vessel tracking systems are already showing an uptick in inbound ballast tankers heading toward the Gulf, anticipating a flood of unrestrained export volume. The physical market is suddenly awash in supply that was previously locked behind a wall of geopolitical anxiety.
Middle East Peace Deal Oil Impact: The Forward Curve Shifts
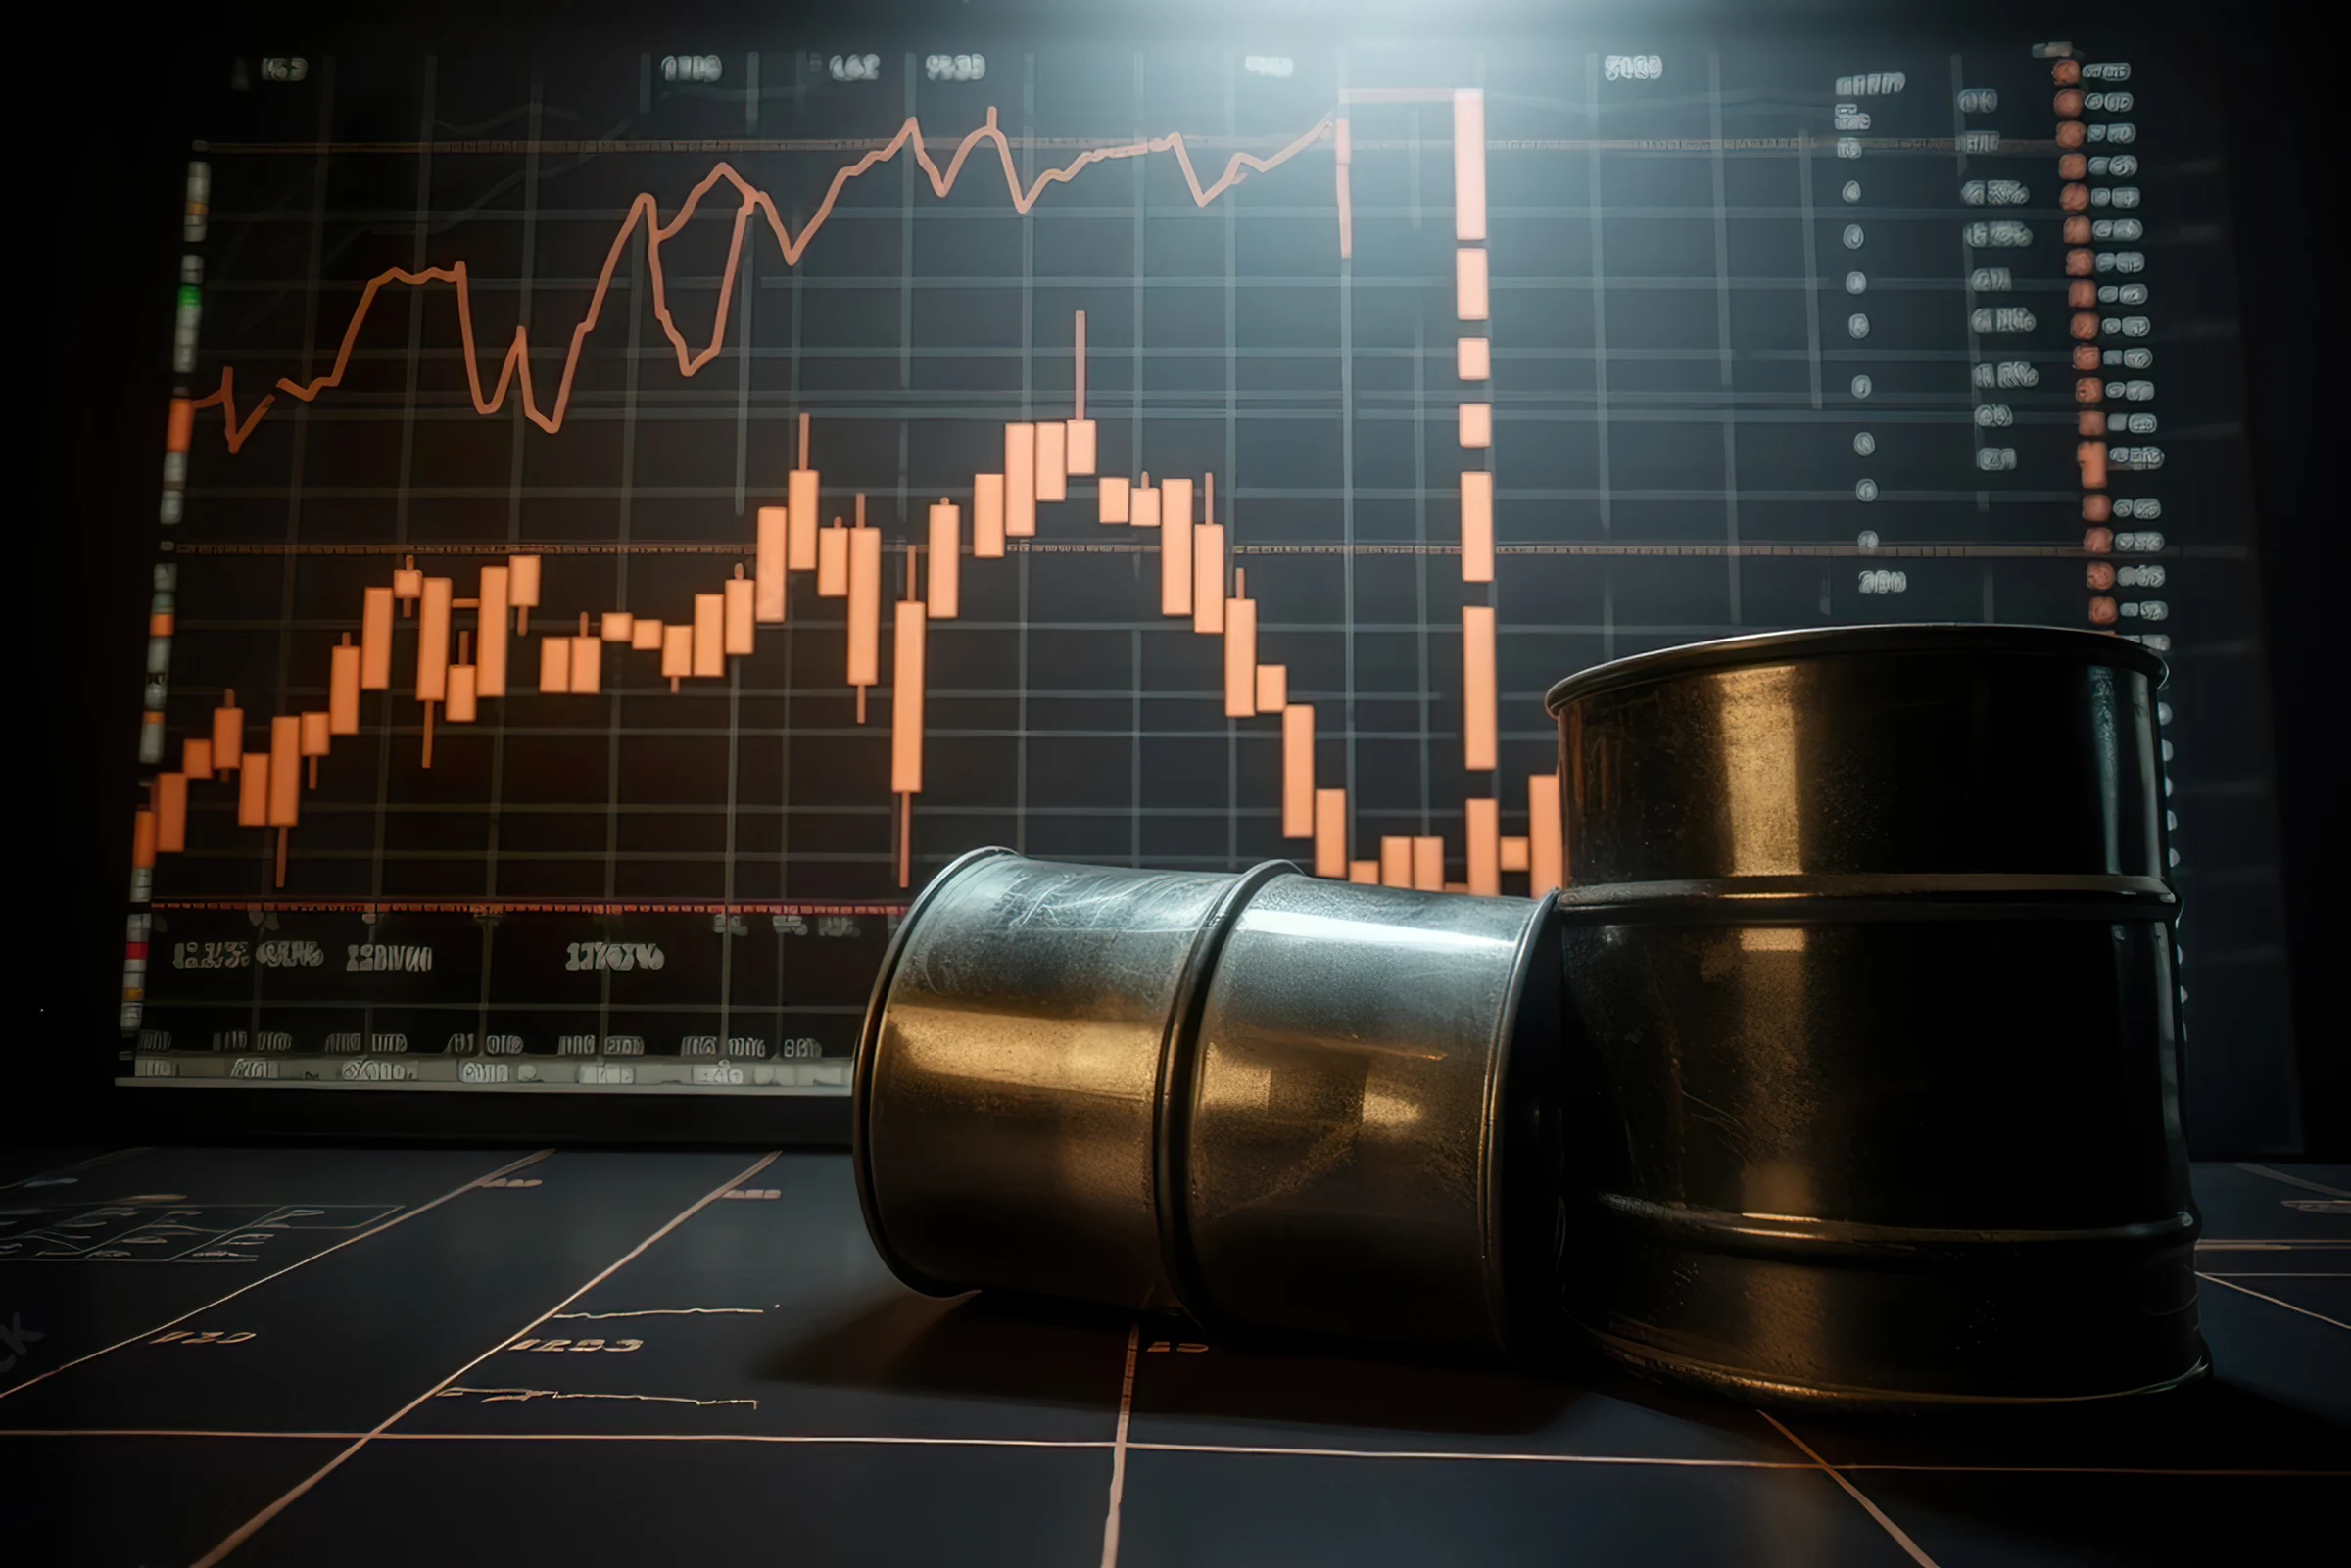
Move beyond the headline spot price, and the structural interpretation of the market reveals a profound shift in expectations. The oil forward curve—the series of prices for future delivery months—has fundamentally restructured itself.
During the height of the conflict in April, the market was in steep backwardation, a condition where prompt barrels trade at a massive premium to future deliveries because buyers are desperate for immediate supply. Today, that curve is flattening rapidly, threatening to tip into contango, signaling that traders believe the market will be adequately, if not overly, supplied in the medium term.
Why are oil prices dropping today?
Oil prices are dropping today because the framework peace agreement between the US, Israel, and Iran immediately removes a $15–$18 geopolitical risk premium from the market. Traders are pricing in the uninterrupted flow of 21 million barrels daily through the Strait of Hormuz alongside surging non-OPEC production.
That rapid repricing forces a painful adjustment for hedge funds that had built record-high net-long positions in crude futures. As the price breaches key technical support levels, algorithmic trading protocols trigger automatic sell orders, accelerating the downward momentum. This is a classic liquidity cascade, disconnected from the physical reality of how much gasoline drivers in Ohio or diesel truckers in Bavaria are actually burning today.
Downstream Consequences: Central Banks and SMEs
The second-order effects of this price collapse will ripple forcefully through the global economy, offering a vital lifeline to policymakers. For the past six months, central banks have been trapped in a high-wire act, attempting to manage sticky services inflation while energy costs threatened to reignite broader consumer price indices.
A sustained drop in Brent crude—assuming it settles in the $70–$75 range—fundamentally alters the monetary policy calculus in Washington, London, and Frankfurt.
According to proprietary modeling from the Bank of England, every sustained $10 drop in the price of crude shaves approximately 0.2 percentage points off headline inflation in advanced economies over a six-month horizon. This provides the exact disinflationary cover central bankers require to initiate, or accelerate, interest rate cutting cycles.
For Small and Medium Enterprises (SMEs), the relief is tangible. Haulage firms, agricultural producers, and energy-intensive manufacturers will see immediate margin expansion. The cost of diesel wholesale has already tracked the crude slide, dropping to its lowest level since early March. This is effectively a massive, unlegislated tax cut for the global industrial base, reallocating capital from sovereign oil producers back into the hands of Western consumers and corporate balance sheets.
Yet, the dividend is not evenly distributed. High-cost domestic producers, particularly independent shale operators in the United States holding heavily leveraged balance sheets, face an abrupt reality check. The breakeven price for new wells in marginal basins suddenly looks precarious without the protective umbrella of a Middle Eastern war premium.
The Riyadh Put: Will OPEC+ Intervene?
The picture is more complicated when we introduce the inevitable counter-reaction from sovereign producers. It is naive to assume that the power brokers in Riyadh and Moscow will simply absorb a 20% contraction in their primary revenue stream without a policy response.
The steel-man argument against a sustained era of cheap oil rests entirely on the interventionist capacity of OPEC+. The cartel is currently withholding approximately 2.2 million barrels per day of spare capacity from the market. While the peace framework removes the artificial constraint of the Strait of Hormuz, the cartel retains the mechanical ability to tighten the taps further to establish a new price floor.
Amin Nasser, CEO of Saudi Aramco, noted at an industry conference last month that global spare capacity remains historically thin relative to total demand. If the current price slide breaches the fiscal breakeven points for major Gulf states—widely estimated by the International Monetary Fund to sit near $80 per barrel for Saudi Arabia—an emergency OPEC+ ministerial meeting is highly probable.
Furthermore, the physical lifting of sanctions on Iranian exports is not instantaneous. The framework deal establishes a timeline, but compliance verifications, banking channel restorations, and the technical resuscitation of aging Iranian upstream infrastructure will take months, if not years, to fully materialise. The market is pricing in a deluge of Iranian crude that simply cannot arrive at the export terminals tomorrow morning.
The New Energy Reality
The resolution of the immediate geopolitical crisis in the Persian Gulf has lanced the speculative boil on global energy markets. By removing the catastrophic tail-risk of a closed Strait of Hormuz, the framework agreement allows the market to finally price oil based on the mundane, mechanical realities of supply and demand, rather than the terrifying calculus of war.
Still, the structural volatility of the energy transition remains. Capital expenditure in fossil fuel extraction continues to lag historical averages, and global demand, driven by the industrialisation of the Global South, has not yet peaked. The war premium is dead, but the fundamental tightness of the global energy system will endure.
Discover more from The Economy
Subscribe to get the latest posts sent to your email.
On Sunday evening, a post to Truth Social from President Donald Trump set financial markets alight. “The deal with Iran is now complete,” he wrote. By Monday morning, the S&P 500 had surged past 7,540, the Dow Jones Industrial Average was up more than 600 points to a fresh record of 51,725, and the Nasdaq Composite had rocketed nearly 3%. Crude oil, which had traded above $117 a barrel as recently as last week, plunged more than 5%. A four-month war, and the economic anxiety it generated, was — at least provisionally — over.
The stocks surge on the US-Iran deal reflected something deeper than relief. It was a collective re-pricing of global stability across every asset class simultaneously.
A World Holding Its Breath Since February
The crisis had its roots in the collapse of nuclear negotiations in Geneva in early 2026. On February 28, the United States and Israel launched coordinated air strikes against Iranian military infrastructure, triggering a closure of the Strait of Hormuz — the narrow channel through which roughly one-third of the world’s traded oil flows — and sending crude prices toward their highest levels since 2022.
For nearly four months, markets had lived under what strategists called a geopolitical risk premium: elevated energy costs, rising inflation expectations, suppressed equity valuations, and a Federal Reserve boxed into policy paralysis. US producer prices climbed 6.5% year-over-year in May 2026, according to the Bureau of Labor Statistics, underscoring how deeply the energy shock had fed into the broader price level. The European Central Bank responded by raising rates for the first time since 2023.
Gold, that oldest barometer of institutional fear, had surged above $5,100 an ounce earlier this year. By Monday it had retreated to $4,334 — still elevated, but telling. The fear trade was unwinding.
1 — The Core Development: What the Deal Actually Says
The agreement, expected to be formally signed in Switzerland on June 19, is structured as a 60-day ceasefire memorandum rather than a permanent treaty. Iran’s Supreme National Security Council confirmed the finalised text over the weekend; Pakistan’s Prime Minister Shehbaz Sharif, who played a notable mediating role during negotiations, announced the signing ceremony in a statement that briefly sent markets on a roller-coaster ride last week when his earlier proposal to extend Trump’s deadline was being processed by Washington.
Trump confirmed the deal would reopen the Strait of Hormuz “toll-free” and that the US naval blockade of Iranian ports would be lifted immediately. The provisional framework also reportedly includes sanctions relief for Tehran and commitments toward dismantling Iran’s nuclear programme, though the precise architecture of those provisions remains unpublished.
Markets didn’t wait for the fine print.
Brent crude fell $4.22, or 4.8%, to $83.11, while West Texas Intermediate tumbled $4.41, or 5.2%, to $80.47 — a dramatic reversal from the $117 peaks reached just days before. The Nasdaq Composite soared nearly 3%, the S&P 500 jumped 1.8%, and the Dow climbed 1.3% — extending what had already been Friday’s solid session for Wall Street.
The sectoral rotation was equally instructive. Shares of United Airlines jumped 3% while Delta Air Lines gained 1.5% — both carriers hammered by elevated jet fuel costs throughout the conflict. Royal Caribbean Group rose more than 4% and Carnival Corporation gained more than 3%, the cruise lines bouncing as energy cost headwinds eased.
Across Asia, the reaction was even sharper. Japan’s Nikkei 225 soared 5.5% in morning trading, while South Korea’s Kospi jumped as much as 5.7%. Taiwan’s Taiex climbed 2.7% and Australia’s ASX 200 rose approximately 1.5%. In Europe, the pan-European Stoxx 600 reached a record for the first time since late February, completing a round-trip that few analysts had predicted would happen this quickly.
Section 2 — The Analytical Layer: Relief Is Not Recovery
Why Did Stocks Surge After the US-Iran Deal?
Markets rallied because the deal eliminated the largest single source of macro uncertainty since early 2026. Yet the precise mechanism matters: this was not growth optimism driving prices higher. It was the unwinding of a fear premium — energy, inflation, and central bank risk — that had been embedded in asset prices for months.
What the rally actually signals about rate expectations
Stocks surge after the US-Iran deal principally because lower oil prices make the Federal Reserve’s job significantly easier. A sustained drop in crude reduces headline CPI directly and dampens core inflation indirectly through transport and manufacturing costs. Strategists at Stifel Nicolaus and Pepperstone Group cautioned that the agreement is “more likely to create a short-term trading opportunity than mark the start of a longer-term rally”, but even that framing understates the structural relief at play.
Stocks surged after the US-Iran deal because the agreement to reopen the Strait of Hormuz eliminated the geopolitical risk premium embedded in global markets since February 2026. Lower oil prices reduce inflation pressure, ease central bank hawkishness, and restore investor confidence in risk assets — all simultaneously.
The Bank of Japan provides a useful case study. Analysts noted that falling oil prices could temper expectations of a hawkish stance from BOJ Deputy Governor Shinichi Uchida, meaning the deal’s impact on monetary policy extends well beyond Washington and into Tokyo, where rate decisions carry enormous implications for yen-carry trades and global liquidity.
The picture is more complicated in Europe. The ECB had already moved, and its revised inflation forecasts for 2026 and 2027 were built on an energy-shock baseline. If Brent crude holds below $85 through Q3, those forecasts may require downward revision — with corresponding implications for the rate path.
That said, the MSCI Asia Pacific Index climbing as much as 3.2% in a single session represents more than just relief trading. Richard Tang, Head Equity Research Analyst Asia at Julius Baer, noted that “Asia, as an oil-importing region, should benefit from the deal to reopen the Strait of Hormuz,” adding that India remains an overweight market in the region as pressure from oil begins to ease. For emerging markets that have spent four months absorbing a terms-of-trade shock through expensive energy imports, this is genuinely structural.
3 — Implications and Second-Order Effects
The most immediate second-order effect is on global shipping and insurance markets. Despite the cessation of hostilities, analysts with political risk consultancy Eurasia Group warned that it may take several weeks for oil tanker traffic through the Strait of Hormuz to reach even 50% of its pre-war levels, as shipping and insurance companies will want to be confident the pact will hold before resuming normal operations.
This matters enormously. The psychological reopening of the strait and the physical reopening are two different events separated by weeks of verification. Shipping companies are not going to route tankers through a waterway where Iranian missile strikes were recorded as recently as March without independent assurance that the ceasefire is durable. Insurance premiums for passage will remain elevated for weeks at minimum, keeping some upward pressure on delivered energy costs even as spot crude falls.
For US households, the timeline for relief at the pump is similarly staggered. While gas prices could ease in the coming weeks, experts said they’re unlikely to return to pre-war levels anytime soon — continuing to place financial pressure on households and businesses even as financial markets celebrate. The national average for retail gasoline was $4.14 per gallon during peak tensions, against a pre-war level well below $3.50.
For policymakers, the deal provides a narrow window of opportunity. The Federal Reserve, which meets this week on interest rates, now faces a materially different set of assumptions than those underpinning its May projections. A continued decline in crude — if sustained — shifts the calculus meaningfully away from further hikes. Markets had been pricing a rate increase as the primary scenario; that pricing is now in flux.
There is a fiscal dimension too. The energy shock had been feeding into government bond markets through inflation expectations, pushing yields higher across the G7. Gold climbed above $4,300 on Monday as lower oil prices eased concerns over the prospect of interest rate hikes that had weighed on bullion — paradoxically, the peace deal is bullish for gold too, because it reduces the probability of further central bank tightening while simultaneously removing the fear premium.
For airlines and shipping, the deal is unambiguously positive. The CEO of Menzies Aviation, the world’s largest airport services company, warned that jet fuel prices are likely to stay elevated for several more months — a useful corrective against the temptation to extrapolate today’s stock prices into earnings forecasts.
4 — The Dissenting View: Reasons to Temper the Euphoria
Not everyone on Monday morning was buying the rally with conviction.
Strategists at KCM Trade, Pepperstone Group, and Stifel Nicolaus said the agreement is more likely to create a short-term trading opportunity than mark the start of a longer-term rally. Their reasoning deserves serious engagement.
The deal is, at this stage, a memorandum of understanding, not a treaty. The 60-day ceasefire window is explicitly designed to create space for broader negotiations on Iran’s nuclear programme, sanctions architecture, and the permanent status of the Strait of Hormuz. Each of those issues is independently capable of derailing the process. Iran’s Supreme Leader has not publicly endorsed the terms. The IRGC, which closed the strait and fired on tankers in March, operates with a degree of institutional autonomy that any paper agreement must ultimately accommodate.
Market analysts noted that while the deal framework is positive, questions remain about whether a permanent resolution will hold, with some investors cautioning that the agreement is still preliminary and that final terms could shift before the formal signing.
There is also the inflationary inheritance to account for. The conflict had already transmitted into price levels that won’t reset on a diplomatic announcement. US producer prices at 6.5% year-on-year, ECB forecasts revised upward, and household energy bills that remain structurally higher than their pre-February baselines — these are supply-side scars that take quarters, not days, to heal.
Is the global rally, then, a durable rotation or a relief spike? The honest answer is that Monday’s moves contain elements of both, and distinguishing between them will require watching crude inventories, tanker traffic data, and the Fed’s communications over the next six weeks more carefully than any single headline.
A Provisional Peace, A Provisional Reprieve
Four months of war compressed into a Truth Social post and an overnight market rally is, by any measure, a strange way for a geopolitical crisis to resolve itself. Yet here we are. The global equity rally ignited by the US-Iran deal reflects something real: a world that had priced in sustained conflict is now, tentatively, pricing in something closer to normalcy.
That normalcy remains conditional. The formal signing in Switzerland on June 19 will be closely watched for any deviation from the terms markets have already priced. The tankers waiting outside the Strait of Hormuz will be watched even more closely. And the Federal Reserve, meeting this week against a suddenly altered energy backdrop, will need to decide how much confidence to place in a diplomatic development that has not yet produced a single barrel of additional oil supply.
Markets have celebrated the announcement. The harder work — of energy market recovery, of institutional trust-building, of nuclear diplomacy — begins now.
What investors bought on Monday was not a guarantee. It was a door, cracked open for the first time in months.
Discover more from The Economy
Subscribe to get the latest posts sent to your email.

US-Iran De-Escalation Hits a Snag as Hormuz Tanker Traffic Resumes, But Markets Stay Wary

Fed Chair Warsh Expected to Withhold the ‘Dot Plot’ — Here’s Why That’s a Big Deal

Michael Burry Says He’s Tempted to Short SpaceX — But He’s Passing, For Now

Weak Demand at Treasury Auctions Is Quietly Rattling Bond Investors

Markets Hold Their Breath as US-Iran Ceasefire Faces Its First Real Test

Fiserv Names New CEO as Industry Veteran Takis Georgakopoulos Takes the Helm

Japan’s Property Sector Looks Strong. So Why Are Investors Going Abroad?

17 Fusion Startups Have Now Raised Over $100M Each — and the Total Keeps Climbing

Warren Raises €10M to Fix Belgium’s Broken Workplace Pensions

Finance Bill 2026: Extraction Cannot Deliver

Big Tech and the UK’s Unrest: Algorithm, Not Conspiracy

BankIslami Launches BIPL Exchange: What It Means

ABHI MFB, NADRA Technologies to Accelerate Digital Transformation

Top 7 Banking Stocks for Investment in PSX: Pakistan’s Lenders Are Still Printing Money

China Overhauls the World’s Biggest Surveillance Network with Advanced AI

Kevin Warsh Takes the Fed’s Helm — and Walks Straight Into a Rate-Hike Storm

How AI Is Forcing McKinsey and Its Peers to Rethink Pricing

SpaceX IPO: Inside the $2 Trillion Market Debut

KPMG Australia CEO Resigns After Whistleblower Claims Exposed Investigation Failures

PwC China Partner Payouts Cut Amid Evergrande Audit Fraud

Broadcom Market Value Loss: Revenue Forecast Disappoints

Pakistan Budget FY 2026-27: Relief, Prospects, and the Tightrope Walk

The Guardrails Are Down: How Meta and Google’s AI Models Fold Under Pressure

Benefitbay Raises $18M to Build the Plumbing for America’s ICHRA Shift

Nasdaq Tumbles 4% as Chip and Memory Stocks Sink: A $1.2 Trillion Wipeout

Here’s How Much It’ll Cost You to Be Part of SpaceX’s Record-Breaking $75 Billion IPO

Japanese Mid-Sized Firms Flock to Southeast Asia for Growth

China-Russia Energy Ties: Deeper Than the Pipeline That Won’t Close
-

 Markets & Finance5 months ago
Top 15 Stocks for Investment in 2026 in PSX: Your Complete Guide to Pakistan’s Best Investment Opportunities
-

 Analysis4 months ago
Top 10 Stocks for Investment in PSX for Quick Returns in 2026
-

 Analysis4 months ago
Brazil’s Rare Earth Race: US, EU, and China Compete for Critical Minerals as Tensions Rise
-

 Banks5 months ago
Best Investments in Pakistan 2026: Top 10 Low-Price Shares and Long-Term Picks for the PSX
-

 Investment5 months ago
Top 10 Mutual Fund Managers in Pakistan for Investment in 2026: A Comprehensive Guide for Optimal Returns
-

 Analysis4 months ago
Johor’s Investment Boom: The Hidden Costs Behind Malaysia’s Most Ambitious Economic Surge
-

 Global Economy6 months ago
15 Most Lucrative Sectors for Investment in Pakistan: A 2025 Data-Driven Analysis
-

 Global Economy6 months ago
Pakistan’s Export Goldmine: 10 Game-Changing Markets Where Pakistani Businesses Are Winning Big in 2025