
Analysis
JPMorgan Cuts Anthropic AI Access in Hong Kong

JPMorgan Chase has blocked its Hong Kong employees from accessing Anthropic’s Claude AI models, the Financial Times reported on June 18, 2026, citing three people familiar with the matter. The move strips staff at the world’s largest bank by market capitalisation of a tool that had been available through an internal drop-down list of approved large language models. It’s the second such restriction imposed by a Wall Street institution in less than two months — and the contractual mechanism behind both decisions reveals something deeper than a routine vendor dispute.
The timing is deliberate. JPMorgan’s decision follows Goldman Sachs, which in late April 2026 quietly removed Claude from its internal AI platform for Hong Kong-based bankers — a move Reuters confirmed on April 29 after the Financial Times broke the story. Together, these two restrictions represent a significant narrowing of Anthropic’s footprint inside global finance’s most important Asian hub.
The broader backdrop is a US-China technology rivalry that has moved, with remarkable speed, from semiconductors to software. In February 2026, Anthropic publicly accused three Chinese AI laboratories — DeepSeek, Moonshot AI, and MiniMax — of orchestrating what it called “industrial-scale campaigns” to extract Claude’s capabilities through approximately 24,000 fraudulent accounts and more than 16 million engineered exchanges, a technique known as model distillation. OpenAI had raised similar alarms eleven days earlier. Google’s Threat Intelligence Group confirmed its Gemini model had faced comparable incursions. The line between a legitimate AI vendor relationship and an intelligence risk was no longer theoretical.
Hong Kong sits precisely on that line.
The mechanism behind both the Goldman and JPMorgan restrictions is the same, and it deserves careful attention: neither bank was ordered to act by a regulator. Both arrived at their decisions by reading their own contracts with Anthropic and concluding that the terms did not permit use in Hong Kong.
That conclusion was not difficult to reach. Anthropic’s own supported-countries page does not list Hong Kong as a market where its commercial API or Claude.ai are officially accessible. A company spokesperson told the Financial Times that Claude models had “never been officially supported” in the territory, though the company declined further comment. In other words, both Goldman and JPMorgan had, for some period, been operating outside the literal scope of their vendor agreements — and only a formal compliance review brought that to light.
For Goldman, that review came after an internal consultation with Anthropic, described by the FT as a “strict interpretation” of its licensing arrangement. JPMorgan’s decision followed the same logic: the wording of Anthropic’s usage terms prompted the bank to delist Claude models from its internal tool selection interface. JPMorgan and Anthropic did not respond to Reuters’ requests for comment.
What makes this notable is the asymmetry. Other AI models remain available on Goldman’s internal platform: OpenAI’s ChatGPT and Google’s Gemini are still accessible to Hong Kong staff. This isn’t a blanket retreat from AI tools in the city. It’s specifically Anthropic — and the reason traces directly to where Hong Kong sits in Anthropic’s geographic framework, which groups the territory alongside mainland China in its access restrictions.
In September 2025, Anthropic tightened its terms of service further, prohibiting access from companies whose majority ownership is directly or indirectly attributable to entities headquartered in unsupported regions. The stated logic was that subsidiaries in supported jurisdictions had been used as pass-through access channels. The Goldman and JPMorgan moves are the downstream consequence of that policy meeting enterprise contracts.
Why JPMorgan Blocking Anthropic in Hong Kong Matters Beyond Finance
The standard reading of this story positions it as a compliance footnote — two banks tidying up their vendor agreements. That reading is too narrow.
What does JPMorgan blocking Anthropic in Hong Kong actually mean for AI access policy?
JPMorgan’s restriction signals that frontier AI vendors are now enforcing geographic access through private contract terms, effectively creating a parallel export-control regime that operates faster and with less procedural visibility than formal government regulation. Where traditional export controls require rulemaking, public comment, and enforcement by customs authorities, vendor-imposed regional restrictions are expressed in bilateral contracts, enforced by IP-level blocks, and largely invisible to outside observers until a major institution is affected.
The picture is more complicated than simple US-China tension. Hong Kong has historically operated outside the Great Firewall that blocks Claude, ChatGPT, and other Western AI models in mainland China. That status has eroded not because of anything the Hong Kong government has done, but because of decisions made in San Francisco boardrooms. Anthropic has been explicit that it maintains defence and intelligence relationships with the US government and has actively advocated for semiconductor export controls on China. Its regional access policy is, in part, a reflection of those commitments.
The National Security Law imposed on Hong Kong in 2020 fundamentally changed the territory’s legal architecture — creating obligations to share information with mainland authorities that US technology companies regard as incompatible with their own security commitments. Goldman Sachs CIO Marco Argenti had, as recently as February 2026, described an active partnership with Anthropic to develop autonomous AI agents for trade accounting and client onboarding. The Hong Kong restriction doesn’t end that relationship. It draws a geographic boundary around it.
For the banks, the calculus is straightforward: the productivity gains from AI access at a Hong Kong desk do not outweigh the compliance, legal, and reputational risk of operating outside a vendor’s supported terms in a territory that carries elevated intelligence-exposure risk.
The JPMorgan decision will accelerate a review that legal teams at every major multinational with Anthropic enterprise agreements should already have begun. The question is no longer whether Hong Kong is a compliant deployment location — the answer is clearly no. The question is how many other institutions have been quietly using Claude in the territory without having audited their contracts.
The Hong Kong Monetary Authority has already signalled its engagement. Reuters reported in late April that the HKMA had contacted a range of major banks to understand developments around Anthropic’s newer models and to remind them to update their risk assessments. That kind of regulatory outreach, even when framed as information-gathering, is a prompt to act.
The second-order effects extend to Hong Kong’s ambitions as an AI hub. The territory has spent the better part of a decade positioning itself as a bridge between Chinese capital and Western technology. That bridge is narrowing. If the two most prominent US AI safety companies — Anthropic and, to a degree, OpenAI, which restricted Chinese API traffic in 2024 — treat Hong Kong as within their China risk perimeter, the competitive disadvantage for Hong Kong-based financial technology firms compounds quickly.
There’s also a signal effect for Anthropic’s enterprise strategy. The company has made substantial inroads in global banking: its Claude for Financial Services product launched in July 2025, expanding in October with real-time market-data connectors and pre-built agent skills for tasks such as discounted cash flow models and coverage reports. Goldman’s six-month embedded-engineer partnership was the most visible sign of that momentum. Yet the Hong Kong restrictions reveal a structural tension in Anthropic’s commercial model: the same security posture that makes the company attractive to US defence agencies makes it unavailable in one of the world’s most important financial centres.
For institutions choosing AI infrastructure in 2026, this imposes a new due-diligence requirement. Geography is now a compliance variable in AI vendor contracts, in the same way it is for data residency, cross-border transfer restrictions, and sanctions screening. Legal teams that built their enterprise AI agreements before this framework solidified are carrying risk they may not have priced.
It’s worth taking seriously the argument that these restrictions are disproportionate, or at minimum, poorly calibrated.
Hong Kong is not mainland China. Its legal system retains common-law foundations and its financial regulatory architecture — overseen by the HKMA — remains broadly aligned with international standards. Anthropic itself has acknowledged that distillation is “a widely used and legitimate training method” in the AI industry; its objection to the Chinese lab campaigns was not to the technique but to the alleged use of fraudulent accounts to circumvent access restrictions.
Critics argue, with some justification, that corporate AI access policy is doing the work of geopolitics without the accountability of formal regulation. As one analyst framed it in a widely circulated April 2026 essay: “The block, in other words, was self-imposed by the customer, on the basis of contract terms set by the vendor, not by any government regulator on either side.” There’s no public comment period, no appeals process, no parliamentary scrutiny.
There’s also a competitive-dynamics dimension that Anthropic’s critics are quick to identify. OpenAI’s ChatGPT and Google’s Gemini remain available on Goldman’s Hong Kong platform. If Anthropic’s stricter geographic policy results in it losing ground to rivals in major Asia-Pacific markets, the company’s commercial sustainability — and, by extension, its ability to fund frontier safety research — takes a hit. The irony is that the safety-focused company may be hardening its access policy in ways that cede the field to competitors less exercised about where their models end up.
Professors and ethics consultants studying the distillation controversy have raised a further point. Lia Raquel Neves, founder of the ethics consultancy EITIC, noted that since Anthropic itself recognises distillation as a legitimate practice, “the central point of controversy lies not only in the technique itself, but in the alleged fraudulent access and possible violation of contractual terms.” The legal and moral weight of Anthropic’s position rests on contract enforcement, not on a principled objection to knowledge transfer. That distinction matters when assessing whether geographic blanket restrictions are a proportionate response.
What JPMorgan’s decision confirms — coming seven weeks after Goldman’s and on the same contractual basis — is that AI access is now a geopolitical asset class. The question of which staff in which offices can use which model is no longer a procurement decision. It’s a foreign-policy adjacency.
Hong Kong built its financial primacy on the promise that it could offer something mainland China could not: legal predictability, open information flows, and access to the world’s best tools and capital. That promise is being tested from multiple directions simultaneously — by Beijing’s legal architecture, by Washington’s export-control instincts, and now by the private contract decisions of AI companies headquartered in San Francisco.
JPMorgan’s move won’t be the last. Every major institution with an Anthropic enterprise agreement and a Hong Kong desk is, today, looking at its contract language with fresh eyes. The banks that haven’t yet acted are simply the ones that haven’t finished reading.
Discover more from The Economy
Subscribe to get the latest posts sent to your email.


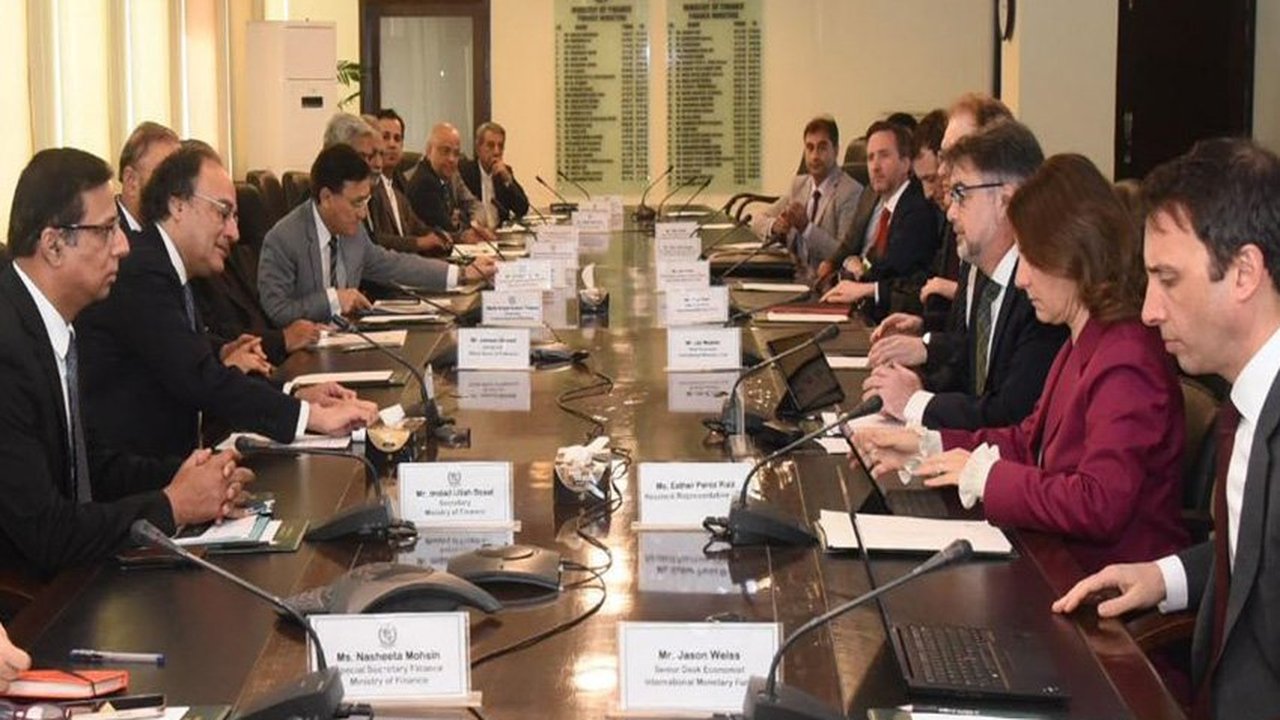
The IMF’s Executive Board completed Pakistan’s third review of its 37-month Extended Fund Facility (EFF) and second review of its Resilience and Sustainability Facility (RSF) on May 8, 2026, unlocking roughly $1.1 billion under the EFF and $220 million under the RSF, according to the IMF’s official statement. Total disbursements under both arrangements now stand at roughly $4.8 billion. Acting Chair Nigel Clarke credited Pakistan’s “strong program implementation” for supporting macroeconomic recovery and building resilience to shocks.
The Genuinely Good Numbers
By the IMF’s own account, the underlying data supports the assessment. GDP growth accelerated to an average of 3.8% year-on-year in the first half of FY26, driven by the auto, construction and garment industries, even accounting for flood disruption in July-August, according to the IMF’s staff report. Inflation, while ticking up to 7.3% year-on-year in March as commodity price pass-through hit domestic energy prices, remained within a broadly contained range, with core inflation at 7.6%. The current account was described as broadly balanced, and reserve rebuilding exceeded earlier projections — the State Bank of Pakistan projects reserves continuing to climb to roughly $18 billion by June 2026, according to analysis from the Islamabad Policy Research Institute.
The State Bank confirmed receipt of $1.3 billion from the IMF on May 12, 2026, according to CSS Prep’s policy analysis, which notes reserves had fallen to dangerously low levels in 2022-2023 before this recovery.
The External Risk the IMF Flagged Explicitly
The Fund’s own report is notably candid about downside exposure: under its April 2026 World Economic Outlook adverse scenario, the cumulative hit to Pakistan’s GDP from continued Middle East conflict could rise to around 1.5 percentage points by FY27, with inflation and the current account deficit each worsening by roughly 1.5-2.5 percentage points of GDP, according to the IMF’s staff country report. Given Pakistan’s reliance on imported energy, oil price volatility discussed in the IMF’s global outlook feeds directly into this specific country risk.
The Reform Question That Keeps Recurring
The structural policy conditions attached to this review read as familiar territory: sustaining fiscal consolidation, broadening the tax base, maintaining tight monetary policy to keep inflation within the State Bank’s target range, and advancing energy-sector reform — commitments the IMF’s own end-of-mission statement described as still “ongoing” rather than complete, per the IMF’s March 2026 mission statement.
A sharper framing comes from Pakistani policy analysts themselves: reforms that would genuinely break the IMF-program cycle — broadening the tax base to include agriculture and retail, ending energy subsidies, privatizing loss-making state-owned enterprises — impose concentrated, visible costs on politically organized interest groups, while the benefits of reversing those costs are diffuse and delayed, according to CSS Prep’s analysis. That political-economy imbalance, the analysis argues, consistently favors populist continuation of stabilization support over the structural reform that would end the need for it — a pattern this third review’s genuine macroeconomic progress doesn’t yet break.
Social Cost of the Adjustment
Pakistan’s poverty headcount rate rose to 25.3% in FY24, up sharply from 18.3% in FY22, driven by overlapping shocks from COVID, floods and inflation, according to the IMF’s staff report. The Benazir Income Support Programme (BISP) remains the primary social protection mechanism absorbing the distributional cost of IMF-mandated energy price increases and fiscal tightening — whether its scale is adequate remains, in the IMF’s own words, a live policy question rather than a settled one.
Discover more from The Economy
Subscribe to get the latest posts sent to your email.
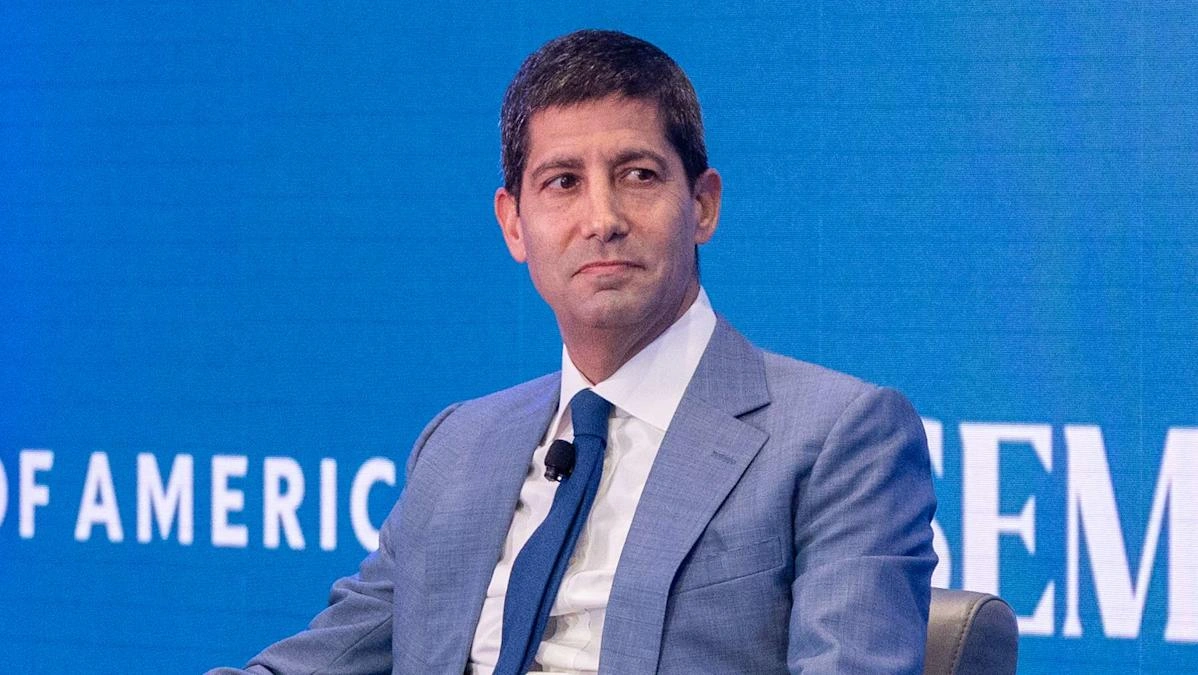
The Federal Reserve held its benchmark interest rate steady at 3.5%-3.75% on July 29, 2026, but the more consequential detail was the vote itself: 9-3, with three regional Federal Reserve Bank presidents — Cleveland’s Beth Hammack, Minneapolis’s Neel Kashkari, and Dallas’s Lorie Logan — dissenting in favor of a rate hike, according to CNBC’s coverage of the meeting. Inflation has remained above the Fed’s 2% target for more than five years, the underlying tension driving the split.
A New Chair, A Different Communication Style
The decision was the latest under Fed Chair Kevin Warsh, who took over after Jerome Powell’s term expired on May 15, 2026, according to iShares’ 2026 Fed outlook. Warsh has deliberately shortened the Fed’s post-meeting statements and pulled back on the kind of explicit forward guidance markets had grown accustomed to under his predecessors — he has reportedly dedicated one of five internal task forces specifically to rethinking how the Fed communicates, according to CNBC’s reporting. Warsh has publicly called inflation “a choice,” repeatedly emphasizing the importance of getting prices under control in recent congressional testimony.
At his post-meeting press conference, Warsh pushed back on characterizing the decision as a “pause,” instead describing it as “a rigorous review of the economic situation” and “a view of what our own homework is to try to resolve those questions in the period ahead,” according to a separate CNBC recap. Warsh has reportedly used the phrase “family fight” 13 times across five public appearances to acknowledge the committee’s internal divisions — an unusually candid framing for a sitting Fed Chair.
Why the Split Exists
Governor Christopher Waller has separately voiced concern that higher rates could become necessary without more inflation progress, even though he voted for the hold at this meeting. The full committee’s June projections penciled in one quarter-point increase by the end of 2026 — a notable shift from the rate-cutting path markets had priced in earlier in the year, according to the Fed’s own June 2026 Summary of Economic Projections, which explicitly flags that the federal funds rate outlook “is subject to considerable uncertainty” given how sensitive each participant’s view is to how inflation and employment data evolve from here.
Complicating Factors
Renewed U.S.-Iran tensions have already pushed mortgage rates near a one-year high independent of the Fed’s own decisions, since longer-term rates track Treasury yields and inflation expectations rather than the Fed funds rate directly, according to CNBC’s analysis. Separately, iShares had earlier projected that once a new Chair was confirmed, the Fed might seek one or two rate cuts to bring rates closer to a 3%-3.25% range — a path the July hold and hawkish dissents now put in serious doubt.
The next FOMC meeting is scheduled for September 15-16, 2026, and will include a fresh Summary of Economic Projections, according to Forbes’ Fed tracker — the next real test of whether Warsh’s committee can narrow its internal divide or whether the “family fight” framing becomes the defining feature of Fed policy through the rest of 2026.
Discover more from The Economy
Subscribe to get the latest posts sent to your email.
Four major UK forecasters — the OBR, the Bank of England-adjacent IFS, NIESR, and RSM UK — are converging on a similar diagnosis for 2026: an economy that’s avoiding outright recession but also not meaningfully growing, squeezed between resilient inflation and cautious business investment.
The Growth Numbers Are Converging Downward
RSM UK’s latest forecast puts 2026 GDP growth at just 1.0%, down from 1.4% in 2025, describing the pattern explicitly as “stagflation-lite” for a second consecutive year, with a modest recovery only expected in 2027 as inflation fades and rate cuts continue, according to RSM’s economic outlook. NIESR’s central forecast is slightly more optimistic at 1.4% GDP growth for 2026, describing the economy as beginning the year “closer to normal than at any other point this decade” despite heightened geopolitical stress, per NIESR’s winter 2026 outlook.
The Institute for Fiscal Studies frames the constraint more directly: consumption and business investment will likely stay muted as elevated uncertainty, still-restrictive monetary policy, and continued household saving all weigh on activity, with businesses “dissuaded from investing by squeezed margins and high financing costs,” according to IFS’s economic outlook.
Inflation Is Heading Back Up, Not Down
The most consequential shared theme across forecasters: inflation, which briefly dipped below 3% in early 2026, is expected to climb back toward 3.5% by year-end. RSM attributes this to a 13% rise in the energy price cap in July, higher motor fuel costs, and pass-through effects into food and goods prices, forecasting inflation to average 3.1% for 2026 overall, per RSM’s analysis. Notably, the report flags that the IMF has revised its UK inflation and growth forecasts more sharply than for any other developed economy, given Britain’s outsized reliance on gas for electricity pricing.
Bank of England Rate Path
Despite the inflation uptick, both NIESR and IFS still expect further Bank of England rate cuts through 2026. NIESR forecasts two further 25-basis-point cuts bringing Bank Rate to 3.25% by year-end — its estimate of the long-run neutral rate — following a cut to 3.75% in December 2025. IFS’s own forecast assumes Bank Rate reaches 3.5% in the first half of 2026. The divergence between continued rate cuts and rising inflation is the core tension defining UK monetary policy through the rest of the year.
Fiscal Headroom Is Nearly Gone
The Office for Budget Responsibility’s March 2026 outlook flags the tax-to-GDP ratio rising to a post-war high of 38% by 2030-31, with the November 2025 Budget having raised taxes by roughly £26 billion annually against OBR-assessed fiscal headroom of just £22 billion, according to NIESR’s reading of the same data. NIESR’s own forecast is notably more pessimistic than the OBR’s, projecting the current budget stays close to balance by 2029-30 with effectively no headroom at all — meaning public debt continues climbing toward 100% of GDP by decade’s end, sharply limiting the government’s room to respond to any future shock. RSM adds a domestic political risk on top: a Labour leadership contest raising the prospect of higher borrowing and renewed gilt yield pressure, with a short recession “not ruled out” if that risk materializes alongside global headwinds.
For UK-based investors, Deloitte notes the practical fallout includes a reduced cash ISA allowance for under-65s (down from £20,000 to £12,000) and a 2027 increase in tax on landlord property income — both tightening the traditional wealth-preservation toolkit just as broader growth conditions stay subdued, according to Deloitte’s TaxScape 2026 briefing.
Discover more from The Economy
Subscribe to get the latest posts sent to your email.

Pakistan Passed Its Third IMF Review

The Fed Is Fractured — And a New Chair Just Made It Louder, Not Quieter

The UK Economy in 2026 Is Neither Recession Nor Recovery :Stagflaton

Indonesia’s $121 Billion Nickel Bet Is Facing a Battery Chemistry

Why Ultra-Wealthy Families Are Splitting Between Singapore and Dubai inmarkets 2026

China Chose Political Control Over Fixing Its Deflation Trap in 2026

Oil Markets Are Oversupplied and Geopolitically Explosive at the Same Time

Russia’s Budget Deficit Blew Past Its Full-Year Target in Three Months

Malaysia’s Rare Earth Bet: Six Powers Are Negotiating for Kuantan at Once

Gulf Sovereign Capital Bypasses Pakistan Despite Record 2026 Spending Spree

Pakistan’s $10bn US Facility Request: Inside the New Gulf Capital Triangle

China Criticizes US Bill Targeting Russian Oil Buyers — Why It Matters

Nvidia’s H200 Chips Are Finally Reaching China — In Numbers Too Small to Matter Yet

Oil Prices Fall as Strait of Hormuz Reopens: 2026 Update

AI Bubble Warning 2026: Why BIS, IMF and Bank of England Fear a Market Crash

Russia Bans Diesel Exports 2026: Global Fuel Market Impact Explained

Gold Price Forecast 2026: Fed’s July 29 Decision and Record Central Bank Buying Explained

Strait of Hormuz Blockade 2026: Oil Prices Surge 9% as US-Iran Conflict Reignites

Strait of Hormuz 2026: Why Markets Still Don’t Trust It’s Open

Gulf Capital Retreat From Pakistan 2026: UAE Loan Freeze & What It Means

Down But Not Out: Inside the Slow Sinking of Russia’s War Economy

Pakistan IMF Deal 2026: Third Review Cleared, Budget 2026-27 and Inflation Outlook

Pakistan Economy 2026: GDP Grows 3.7% as IMF Completes EFF Review Amid Middle East Risk

China Politburo July 2026: Stimulus Signals Explained

Global Stock Market Selloff 2026: Stagflation Fears Return as Iran Conflict Reignites

The Yuan Now Settles 67% of Russian Oil Payments — Quiet De-Dollarization in Action

Apple vs OpenAI Lawsuit: The Economic Story Behind the Headline

Indonesia Russian Oil Imports 2026: Why Jakarta Is Diversifying Crude Supply
-

 Markets & Finance7 months ago
Top 15 Stocks for Investment in 2026 in PSX: Your Complete Guide to Pakistan’s Best Investment Opportunities
-

 Analysis5 months ago
Johor’s Investment Boom: The Hidden Costs Behind Malaysia’s Most Ambitious Economic Surge
-

 Analysis5 months ago
Top 10 Stocks for Investment in PSX for Quick Returns in 2026
-

 Analysis6 months ago
Brazil’s Rare Earth Race: US, EU, and China Compete for Critical Minerals as Tensions Rise
-

 Banks7 months ago
Best Investments in Pakistan 2026: Top 10 Low-Price Shares and Long-Term Picks for the PSX
-

 Investment7 months ago
Top 10 Mutual Fund Managers in Pakistan for Investment in 2026: A Comprehensive Guide for Optimal Returns
-

 Global Economy7 months ago
15 Most Lucrative Sectors for Investment in Pakistan: A 2025 Data-Driven Analysis
-

 Global Economy7 months ago
Pakistan’s Export Goldmine: 10 Game-Changing Markets Where Pakistani Businesses Are Winning Big in 2025