
Analysis
Dow, S&P 500, and Nasdaq Slide as Oil Surges Above $83 Amid Escalating Iran War Worries


With tanker traffic through the Strait of Hormuz effectively paralysed, crude oil has surged more than 12% in two trading days. Wall Street is caught between a resilient earnings season and the spectre of a prolonged Middle East war — and markets are visibly losing their nerve
Live Market Snapshot
| Asset / Index | Price / Level | 2-Day Move | Key Driver |
|---|---|---|---|
| Dow Jones Industrial Avg. | 48,534 | ▼ −371 pts (−0.76%) | War uncertainty, industrials rout |
| S&P 500 | 6,831 | ▼ −0.74% | Broad risk-off rotation |
| Nasdaq Composite | 24,386 | ▼ −0.90% | Tech/AI sector repricing |
| Brent Crude Oil | $83.83/bbl | ▲ +$6.09 (+7.8%) | Hormuz closure, Iran retaliation |
| WTI Crude Oil | $77.05/bbl | ▲ +$5.82 (+8.2%) | Tanker traffic halt |
| European Nat. Gas (TTF) | +60% (week) | ▲ Extreme | Qatar LNG stoppage |
| Gold | ~+2% | ▲ Risk haven | Flight to safety |
| Russell 2000 | 2,569 | ▼ −2.02% (4 wks) | 7-week low; rate sensitivity |
On the trading floors of New York and London, Tuesday unfolded as a brutal two-act drama. Act one: a savage sell-off that wiped more than 1,200 points off the Dow Jones Industrial Average at its morning nadir, as Iran’s confirmation that the Strait of Hormuz was closed for business lit a fuse under energy markets and investor anxiety alike. Act two: a partial, white-knuckle recovery, as bargain hunters swooped on battered technology names and the indices clawed back a substantial portion of their losses by the closing bell — only to resume their slide into Wednesday. The message from the market, stripped of all its noise, is simple and unnerving: nobody knows how long this war lasts.
As of Tuesday’s close, the Dow shed 371 points, or 0.76%, the S&P 500 slipped 0.9%, and the Nasdaq Composite fell 0.9% — modest-sounding figures that mask intraday swings of ferocious intensity. The S&P 500 had touched a low of −2.5% before staging a recovery that left analysts divided between those who see a resilient market and those who see a dead-cat bounce before a deeper reckoning.
The Hormuz Trigger: Why a 21-Mile Strait Is Shaking Global Markets
To understand what is happening on Wall Street, you must first understand one geographic fact: the Strait of Hormuz, a narrow waterway off Iran’s southern coast, is the most consequential energy chokepoint on earth. Roughly 20% of the world’s daily oil consumption passes through it, along with critical volumes of liquefied natural gas destined primarily for China, India, Japan, and South Korea.
When the United States and Israel launched Operation Epic Fury on February 28 — a sweeping campaign targeting over 1,200 Iranian military and nuclear sites that resulted in the reported death of Supreme Leader Ali Khamenei — Iran’s response was swift and strategically calculated. Rather than a conventional military counterattack alone, Tehran chose to weaponise the global economy. Tanker traffic through the strait dropped by approximately 70% almost immediately, with over 150 ships anchoring in open waters outside the Persian Gulf, unable or unwilling to risk passage.
The result for energy markets has been dramatic. Brent crude jumped more than 5% on Tuesday to trade at $82.15 per barrel, meaning oil prices have surged over 12% in just two trading days. European natural gas markets have been even more violent — Dutch TTF futures soared approximately 25% after Qatar, the world’s largest LNG exporter, ceased production at its main facility following Iranian drone attacks.
“We have not seen anything like this in pretty much the history of the Strait of Hormuz. It’s like blocking the aorta in a circulatory system.”
— Claudio Galimberti, Chief Economist, Rystad Energy
Dow Jones Decline Reasons: Decoding the Sell-Off
The Dow Jones decline reasons this week are not reducible to a single cause. Three interlocking forces are at work, each amplifying the other.
1. The inflation feedback loop. Oil is embedded in almost every cost structure in the modern economy — from plastics to freight to airline tickets. A sustained move above $80 per barrel will feed directly into consumer prices, complicating the Federal Reserve’s path to rate cuts. New York Fed President John Williams said on Tuesday that the Middle East conflict will directly affect the near-term inflation outlook and increase economic uncertainty — language that markets have learnt to read as rate-cut expectations receding.
2. Geopolitical duration risk. Markets can price a brief conflict. They struggle to price an open-ended one. President Trump himself refused to rule out putting boots on the ground, stating “we projected four to five weeks” but that the U.S. has the capability to go “far longer.” Investors pricing in a multi-month conflict must now discount a very different macro environment than they held in their models at the start of March.
3. Trade alliance fractures. The war is already straining alliances. Trump threatened to cut off trade with Spain after Madrid denied the U.S. permission to use its bases for strikes on Iran — an escalation of rhetoric that spooked European equity markets and raised the spectre of allied fracture just as global supply chains are already under pressure.
Sector Scorecard: Winners, Losers, and the Energy Premium
Not all portfolios are suffering equally. The S&P 500’s pain is unevenly distributed — a point investors would do well to internalise.
▲ Sector Winners
Defense & Aerospace Lockheed Martin +40% YTD. Northrop Grumman up 5% on the week. AeroVironment surged over 10% in a single session. The iShares Aerospace & Defense ETF (ITA) broke to fresh record highs.
Energy / Oil Majors Exxon Mobil +4.1%, Chevron +3.9% in pre-market. Shell, BP, and TotalEnergies all rose 1.8–3.6%. Higher crude prices directly inflate upstream profit margins.
▼ Sector Losers
Technology / Semiconductors Memory stocks decimated: Micron −8%, Western Digital −8%, Sandisk −9%. Applied Materials, Lam Research, and ASML all fell over 6%. Nvidia swung wildly before partially recovering.
Consumer Discretionary / Travel Carnival tumbled 6% (−7.6% prior session). Royal Caribbean shed 3.6%. Airlines face a double threat: higher jet fuel costs and softening demand as geopolitical anxiety builds.
Historical Parallels: What Past Wars Tell Us About Market Recovery
The Gulf War Blueprint (1990–91)
The most instructive analogue is August 1990, when Iraq invaded Kuwait and oil prices doubled in six weeks. The S&P 500 fell roughly 20% peak-to-trough before recovering sharply once the coalition military campaign proved swift and decisive. The lesson: equity markets react not to war per se, but to the perceived duration and economic disruption. A short, decisive campaign and rapid reopening of the Strait of Hormuz could see a comparable recovery rally in 2026.
The 2022 Ukraine Energy Shock
A more sobering parallel is Russia’s invasion of Ukraine in February 2022. European natural gas surged more than 200% before gradually normalising over 18 months. The key differentiator today is that European gas storage is already depleted heading into spring, making the continent acutely vulnerable to a prolonged LNG supply disruption — which would cascade directly into inflation and consumer spending.
📊 Analyst Forecast Snapshot
Barclays analysts warned clients that Brent could hit $100/bbl if the security situation spirals, while UBS flagged the possibility of Brent above $120/bbl in a worst-case material disruption scenario. Evercore ISI’s Julian Emanuel, however, raised his S&P 500 EPS forecast to $304 (from $296), arguing that “upside [is] delayed, not derailed” — setting key support at 6,520 on the S&P 500. OPEC+ has signalled an additional 206,000 barrels per day of output to help offset disruptions.
S&P 500 Slide and Oil Impact: The Inflation Transmission Channel
The relationship between oil prices and equity valuations is not linear — but it is real and well-documented. At current levels of approximately $83 for Brent, the impact is manageable but felt. At $100, it begins to meaningfully compress corporate profit margins and consumer discretionary spending. At $120 or above, the Fed faces a genuine stagflationary dilemma: raise rates to fight oil-driven inflation, risking recession, or hold and let inflation expectations drift higher.
The U.S. is, ironically, one of the less exposed major economies to this particular oil shock. America’s shale production insulates domestic energy supply to a degree, and higher crude prices actually boost the significant domestic energy sector. The most vulnerable nations are China, India, Japan, and South Korea — the primary recipients of Gulf crude flowing through the Strait of Hormuz — and the consequences for their economies and currencies will reverberate globally through trade and capital flows.
Meanwhile, Egypt’s pound breached 50 to the dollar and South Africa, which had been expected to cut rates this month, is now being forecast to hike — a quiet signal that the geopolitical shockwave has already moved well beyond the Middle East.
Nasdaq Drop and War Worries: The AI Sector’s Unexpected Vulnerability
Technology stocks present an interesting analytical puzzle. On one hand, cash-rich mega-caps like Nvidia and Microsoft have balance sheets that can absorb a prolonged period of macro volatility. On the other hand, the Nasdaq’s current composition — heavily skewed toward semiconductor names with complex global supply chains running through Asia — creates specific exposure to a Hormuz disruption.
Memory stocks have been especially hard hit. Seagate declined more than 7%, Micron and Western Digital fell over 8%, and Sandisk — the S&P 500’s best performer in 2026 with a year-to-date doubling — dropped over 9%. Semiconductor equipment firms including Applied Materials and ASML fell 6% or more. These moves reflect fears that Asian supply chain disruptions and higher energy costs will squeeze the margins that have been driving the AI infrastructure buildout.
Conclusion: Investor Strategy for a Market Priced for Uncertainty
The fundamental question confronting investors this week is not whether to panic — markets have so far declined to do so, which is itself notable — but how to position for a range of outcomes with radically different implications.
Three strategic considerations are worth holding in mind.
First, energy and defense remain the clearest expression of the current geopolitical environment. If the conflict drags into weeks rather than days, these sectors will continue to outperform. The iShares Aerospace & Defense ETF (ITA) and major oil majors are already functioning as natural hedges within diversified portfolios.
Second, the S&P 500’s 6,520–6,830 band is the technical and psychological battlefield. Evercore ISI’s support target of 6,520 reflects real earnings power under the current macro backdrop — a floor that has not yet been tested, but that investors should watch carefully. A sustained break below it would represent a qualitative shift in market sentiment from “pricing in short-term disruption” to “pricing in structural damage.”
Third, and perhaps most importantly, watch the Strait of Hormuz, not the headlines. The single most valuable leading indicator for markets right now is not a Fed announcement, an earnings release, or a Trump press conference. It is the daily count of tankers transiting the Strait of Hormuz. Vessel tracking firm Kpler noted that the strait’s effective closure is being achieved not by a physical naval blockade, but by the withdrawal of commercial operators and insurers — making a rapid normalisation possible if de-escalation signals emerge. The moment tanker traffic resumes at even 50% of normal levels, the war-risk premium on oil and the corresponding pressure on equities may unwind with surprising speed.
For now, the market’s verdict is clear: this is a conflict being taken seriously, being priced with discipline rather than panic, and being watched with an intensity that has not been seen since the early days of the Ukraine war. In a world where geopolitics has become the primary macro variable, that vigilance is not paranoia. It is prudence.
Discover more from The Economy
Subscribe to get the latest posts sent to your email.



The pitch was intoxicatingly simple. Buy a boutique fitness studio, tap into a proven corporate playbook, and ride the post-pandemic wellness boom to financial independence. For the franchisees of Pure Barre and CycleBar, that promise has officially ruptured. Xponential Fitness, the aggressive conglomerate behind these ubiquitous neon-lit studios, was just ordered to pay $3.97 million for misleading the very people who bankrolled its rapid expansion. This is not merely a localized dispute between disgruntled business owners and a corporate parent. It is a systemic indictment of a business model that treats human ambition as expendable capital.
Boutique fitness is no longer just about endorphins and community; it is an industrialized asset class. Over the last decade, private equity firms and corporate consolidators transformed the neighborhood yoga or cycling studio into a hyper-financialised franchising machine. Yet the glossy facade of the global wellness economy, valued at roughly $5.6 trillion by industry analysts, hides a deeply asymmetrical power dynamic. At the center sits Xponential Fitness, a company that scaled ruthlessly by selling a “business in a box” concept to mid-career professionals, retirees, and corporate defectors.
The structural flaw in this ecosystem is one of misaligned incentives. The franchisor makes the bulk of its money on initial franchise fees, mandatory equipment purchases, and royalty percentages drawn from top-line revenue, whether the individual studio turns a profit or bleeds cash. This creates a dangerous temptation to sell the dream at volume, irrespective of the unit-level reality. As borrowing costs have climbed globally, the debt burdens shouldered by these small operators have become mathematically unsustainable, exposing the cracks in the corporate narrative.
The Core Development: Anatomy of a Judgment
The recent $3.97 million judgment is a watershed moment in the expanding Xponential Fitness franchise lawsuit saga. The core allegation arbitrated in this case is as old as commerce itself: selling a financial fiction. Legal arbiters found that the parent company systematically misled franchisees regarding the financial viability, build-out costs, and operating metrics required to open and sustain a boutique studio.
For the prospective buyer, the primary shield against corporate deception is supposed to be the Franchise Disclosure Document (FDD). In the case of CycleBar and Pure Barre, plaintiffs successfully argued that the initial investment figures presented in these legal disclosures were artificially suppressed. A prospective owner might be told a build-out costs $350,000, only to discover that mandatory corporate vendors, supply-chain markups, and required marketing spends push the actual capital expenditure well past $500,000 before the doors even open.
This financial penalty validates a narrative that has been building since June 2023, when a devastating report by short-seller Fuzzy Panda Research accused Xponential of hiding hundreds of failing studios and running a business model that inevitably destroyed franchisee capital. Shortly thereafter, the company’s founder and chief executive, Anthony Geisler, abruptly resigned amid mounting internal investigations. Reuters has reported extensively on the Federal Trade Commission’s mounting scrutiny of deceptive practices within the franchise sector, signaling that this $3.97 million ruling is likely the beginning of a much wider regulatory reckoning.
To understand the mechanics of the deception, one must look at the mandated supply chains. Franchisees are rarely allowed to source their own exercise bikes, ballet barres, or flooring. They must buy proprietary equipment directly from the franchisor or its designated affiliates. If a franchisor quietly inflates the cost of a stationary bike or a specialized sound system, it captures immediate margin while the franchisee takes on a heavier Small Business Administration (SBA) loan. When revenues fail to meet the lofty projections touted during the sales pitch, the local operator is left holding a crushing debt load while the corporate parent reports another quarter of franchise fee growth to Wall Street.
The Analytical Layer: The Illusion of Sweat Equity
Why do intelligent, well-capitalised professionals fall into this trap? The answer lies in the psychological architecture of the franchise pitch. Boutique fitness specifically preys on the modern desire for purpose-driven entrepreneurship. Buyers are not just purchasing a cash-flow vehicle; they are buying an identity. They want to be the mayor of their local wellness community. Corporate sales teams weaponize this emotion, presenting the franchise as a turnkey operation where success is guaranteed so long as the franchisee follows the manual.
Why is Xponential Fitness being sued? Franchisees allege the company engaged in deceptive sales tactics by dramatically understating the costs required to open a studio and overstating potential revenues. The lawsuit claims corporate leadership manipulated financial performance representations, leaving hundreds of local owners burdened with insurmountable debt and failing boutique fitness locations.
The primary legal battlefield in these disputes is Item 19 of the Franchise Disclosure Document. This section allows, but does not technically require, a franchisor to make Financial Performance Representations (FPRs). If a Pure Barre parent company penalty is going to fundamentally change the industry, it will be by forcing regulators to close the loopholes in Item 19. Historically, franchisors have manipulated these figures through omission. They might report the average gross revenue of studios open for more than two years, conveniently excluding the dozens of locations that went bankrupt in month 18. They present a survivor’s bias as a baseline expectation.
The unit economics of a boutique fitness studio are notoriously fragile. A CycleBar misleading franchise owners about capacity utilization is a fatal blow. These businesses have high fixed costs—commercial rent in premium retail plazas, expensive proprietary equipment leases, ASCAP music licensing fees, and corporate royalty payments. The variable costs, primarily instructor wages and local marketing, are also rising. To break even, a studio needs a highly specific number of recurring monthly memberships. If corporate projections overestimate local market demand by even 15 percent, the studio will mathematically never turn a profit.
The Financial Times has repeatedly highlighted how private equity’s reliance on franchise models often strips unit-level profitability to inflate corporate valuations. When a brand is owned by an institutional investor looking for an exit within five to seven years, the incentive is to rapidly expand the footprint. More signed franchise agreements equal higher projected revenue, which justifies a higher multiple during an IPO or sale. The actual, long-term survival of a Pure Barre studio in a suburban strip mall is entirely secondary to the immediate liquidity event of the corporate parent.
Implications & Second-Order Effects: The Coming Wave
The downstream consequences of this $3.97 million judgment extend far beyond the balance sheet of Xponential Fitness. This ruling provides a vital piece of case law for hundreds of other distressed franchisees currently bound by mandatory arbitration clauses. It pierces the corporate veil of deniability.
The most immediate secondary effect will be felt in the commercial real estate sector. Boutique fitness franchises have been a crucial tenant class for commercial landlords recovering from the retail apocalypse. If the financial models underpinning these studios are fundamentally broken, landlords are sitting on millions of square feet of precarious leases. When a franchisee defaults, the corporate parent rarely steps in to assume the lease. Instead, the local operator declares personal bankruptcy, the landlord is left with an empty, highly specialized space that is expensive to retrofit, and the commercial real estate market takes another silent hit.
Furthermore, this saga is poised to trigger severe tightening in small business lending. A vast majority of boutique fitness franchise risks are underwritten by SBA loans, which require the borrower to sign a personal guarantee. This means that when the business fails, the bank can seize the franchisee’s home, their retirement accounts, and their children’s college funds. The World Bank warns that high interest rates will continue to expose highly leveraged, low-margin business models. A franchise that looked viable with a 4 percent loan in 2019 is a financial death trap at 9 percent in today’s macroeconomic climate. Lenders, suddenly aware that franchisor revenue projections may be fictionalized, will inevitably demand higher collateral and impose stricter underwriting standards on the entire franchise sector.
What follows, however, is the regulatory response. The Federal Trade Commission, under Chair Lina Khan, has already signaled an aggressive pivot toward investigating the power imbalances inherent in franchise agreements. For decades, the FTC Franchise Rule has been treated as a disclosure requirement rather than a consumer protection enforcement mechanism. The agency essentially operated on the premise that as long as the franchisor put the risks in the FDD, the buyer was responsible. This ruling gives regulators the political capital to shift from passive disclosure oversight to active fraud enforcement. If the FTC begins demanding audited, unit-level profitability metrics before a franchisor can legally sell a new territory, the entire velocity of the $800 billion franchise industry will decelerate.
Competing Perspectives: The Architecture of Risk
Yet, to lay the entirety of the blame at the feet of corporate executives is to ignore the fundamental premise of capitalism. A dissenting perspective—one fiercely defended by corporate franchisors and trade groups—is the principle of caveat emptor. Let the buyer beware.
The International Franchise Association and corporate defense attorneys argue that a franchise agreement is a commercial contract between sophisticated adults, not a consumer protection issue. Prospective franchisees are explicitly instructed, in bold lettering on the first page of the FDD, to hire independent legal counsel and financial advisors before signing. The documents state clearly that business ownership carries an inherent risk of total capital loss and that previous corporate success does not guarantee future individual results.
From the franchisor’s vantage point, the failure of a specific CycleBar or Club Pilates location is rarely a result of corporate malice. Instead, they point to poor local execution. They argue that failed franchisees simply did not follow the mandated marketing playbook, hired subpar instructors, or failed to aggressively manage their local sales funnels. In this view, disgruntled franchisees are simply failed entrepreneurs seeking a scapegoat for their own operational incompetence.
The Economist frequently notes that regulatory overreach in the franchise sector risks stifling a model that has historically provided a reliable ladder to the middle class for millions of entrepreneurs. If regulators make it legally perilous for a franchisor to estimate potential earnings, the flow of capital into small business creation could dry up. The defense insists that while bad actors exist, punishing an entire corporate structure for the failure of localized units destroys the very mechanism that allows brands to scale efficiently across global markets.
That said, the “sophisticated buyer” defense begins to look dangerously thin when an arbitration panel uncovers evidence of systemic, intentional obfuscation. When a corporation knows that its mandated supply chain costs are destroying unit economics, yet continues to sell new territories using outdated or manipulated financial models, the line between aggressive salesmanship and actionable fraud evaporates.
The Bill Comes Due
The $3.97 million judgment against Xponential Fitness is not a fatal blow to a publicly traded conglomerate of its size. It is, instead, a dangerous precedent. It forces a glaring light onto the dark matter of the modern franchise economy: the undeniable reality that corporate growth is frequently subsidized by the localized ruin of individual operators.
The tension here is irreducible. A corporate entity has an obligation to its shareholders to maximize revenue, while a franchisee needs unit-level profitability to survive. For years, the industry pretended these two goals were perfectly aligned. This legal ruling officially shatters that pretense. The era of selling financial illusions under the guise of wellness is over.
Discover more from The Economy
Subscribe to get the latest posts sent to your email.
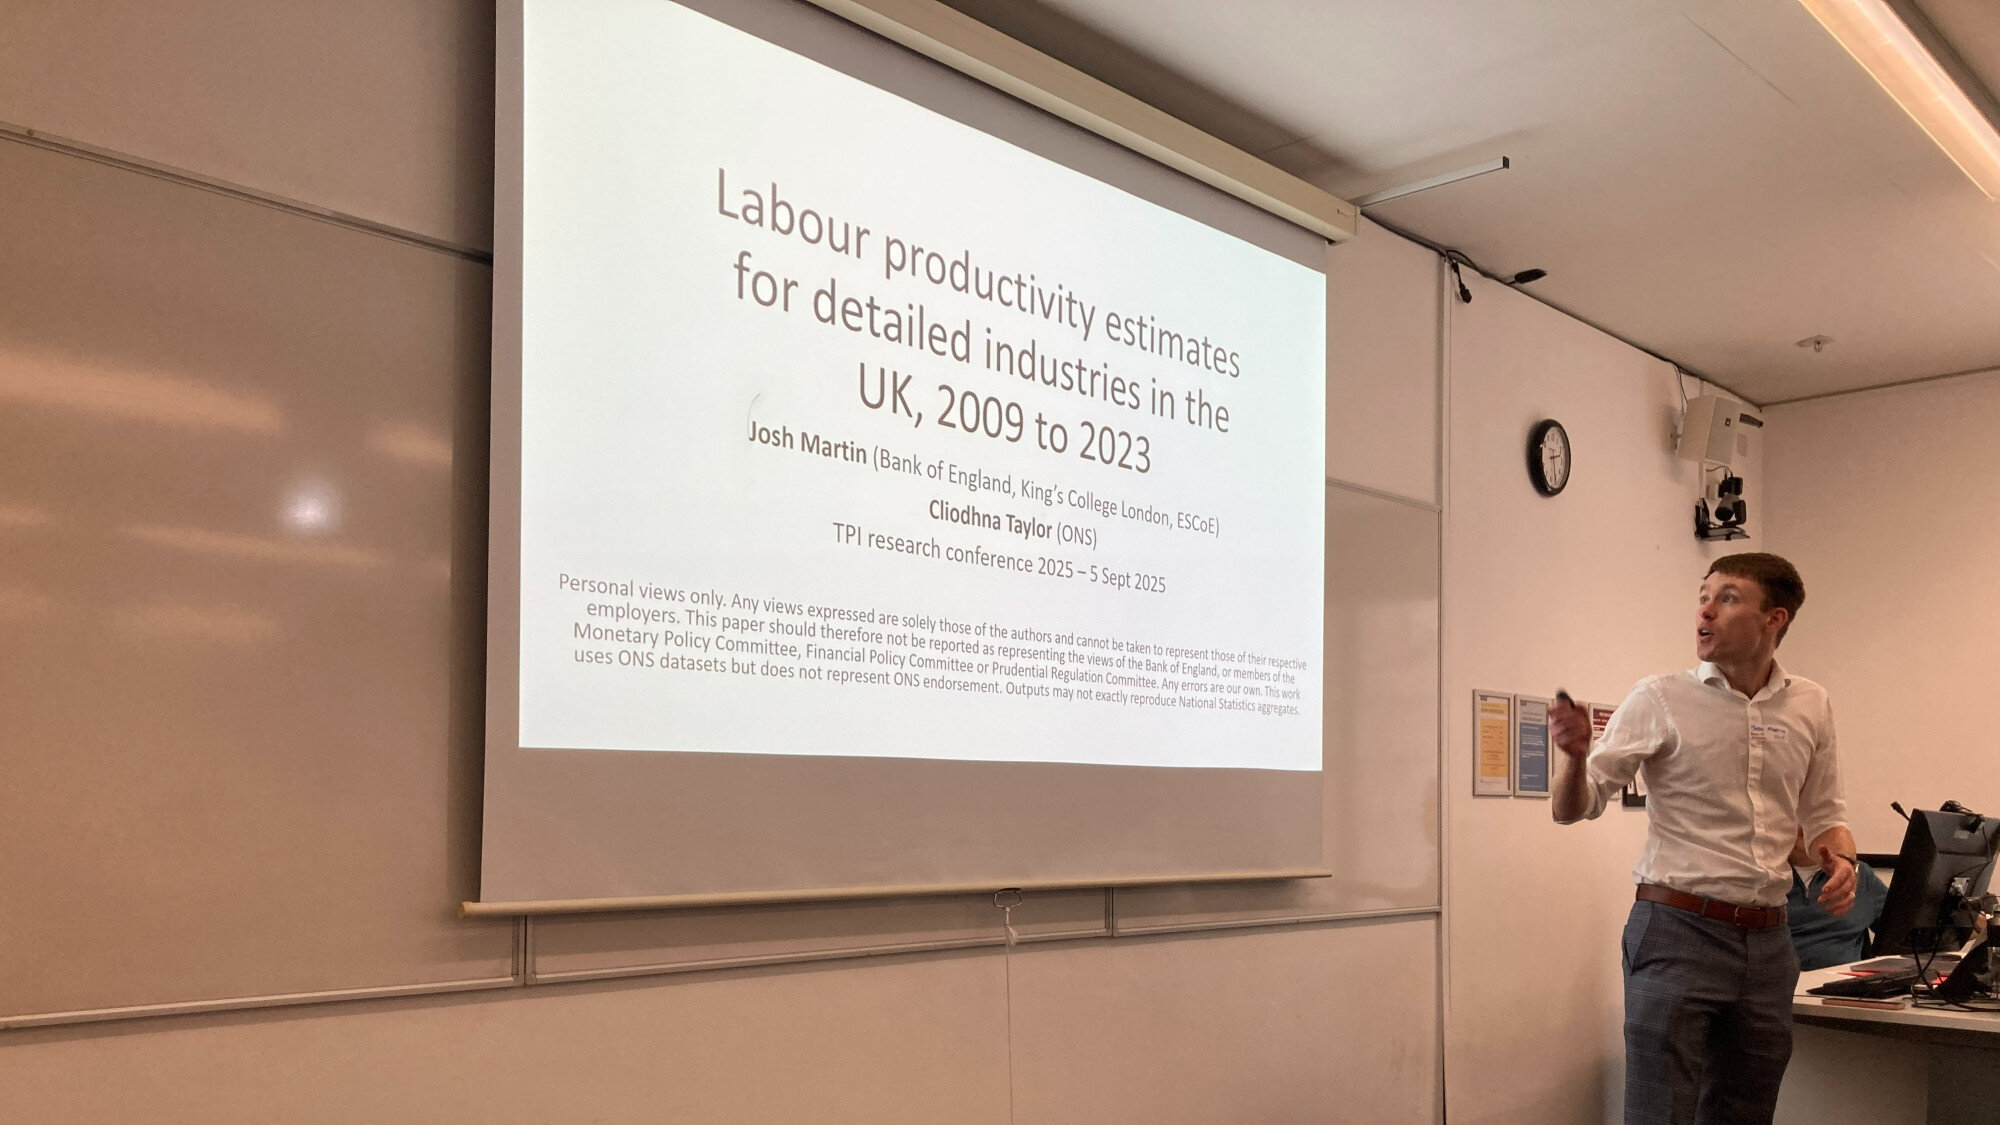
For fifteen years, the defining feature of the British economy has been its sluggishness. Since the financial crash of 2008, the sheer inability to extract more economic value from every hour worked has baffled successive Chancellors, thwarted real wage growth, and starved the Treasury of critical tax receipts. It became the dismal science’s favourite domestic mystery. Yet, a quiet shift is beginning to register on the macroeconomic dashboard. After years of false dawns, UK labour productivity is finally displaying faint but distinct signs of life. The question is whether this is a genuine structural shift or simply a temporary statistical illusion masking deeper economic decay.
To understand the magnitude of this potential turning point, one must look at the depths of the stagnation. Before 2008, British output per hour grew at a reliable rate of roughly two percent each year. Then, it simply stopped. If the pre-crisis trend had continued, the average British worker would be producing nearly a third more today than they currently do. Instead, the country fell drastically behind its international peers. French and American workers routinely produce in four days what takes a British worker five.
This gap has had brutal consequences for living standards. However, the Office for National Statistics reported a surprising uptick in output per hour worked over the most recent consecutive quarters. It is the first time since the brief, chaotic volatility of the pandemic era that we have seen sustained positive momentum. Still, the baseline is incredibly low. The British economy is finally creeping forward, but it is starting a lap behind its closest competitors.
The Core Development
The recent data regarding UK labour productivity cannot be dismissed as a mere rounding error. In the final quarters leading into this year, output per hour worked rose by 0.8 percent, a figure that sounds marginal but represents a seismic shift in the context of recent British economic history. This growth is largely being driven by the services sector. Specifically, professional, scientific, and technical activities have begun to integrate automation and capital upgrades at a much faster rate than the stubbornly sluggish manufacturing base.
Bank of England Governor Andrew Bailey noted recently that corporate behaviour is finally shifting. Faced with an incredibly tight labour market and the highest borrowing costs in a generation, British firms are being forced to invest in efficiency rather than simply hiring cheap labour to solve capacity problems. For years, the abundance of low-wage European labour allowed businesses to expand without investing in software, robotics, or machinery. Brexit, whatever its broader macroeconomic frictions, effectively ended that specific growth model.
Firms are now replacing absent workers with better technology. We are seeing a belated wave of capital deepening. The Bank of England’s most recent monetary policy estimates suggest that business investment, long the Achilles heel of the UK economy, has recovered to its pre-pandemic trajectory. When workers have better tools, they produce more value. It is a fundamental law of economics that the UK seemed to have forgotten.
Moreover, the reallocation of capital away from failing companies—kept alive by a decade of zero-percent interest rates—towards more dynamic firms is finally yielding results. Insolvencies have risen sharply since 2023. That causes short-term economic pain. Yet, the capital and labour freed from those failing enterprises are flowing into higher-margin, highly productive sectors. It is the exact kind of Schumpeterian creative destruction that the British economy has desperately needed to clear the dead wood and spark genuine growth.
Decoding the UK productivity puzzle
To gauge whether this momentum will last, we have to ask why it disappeared in the first place.
What is the UK productivity puzzle? The UK productivity puzzle refers to the prolonged stagnation of output per hour worked following the 2008 financial crisis. While historical British productivity grew by roughly two percent annually, the post-2008 era saw this growth flatline, severely trailing G7 peers and suppressing domestic real wage expansion.
The puzzle was never just one problem; it was a confluence of structural failures. Cambridge economist Diane Coyle has long argued that measurement errors in the digital economy obscure true output, but even adjusting for intangible assets, the British shortfall is glaring. The UK suffers from chronic underinvestment, terrible regional inequality, and planning laws that make building laboratories, railways, or data centres aggressively difficult.
That said, the current rebound suggests some of these historical drags are easing. The transition to hybrid work, initially feared to be a drag on efficiency, has allowed professional services to slash overhead costs while maintaining output. Furthermore, the sheer shock of recent energy price spikes forced industrial firms to become radically more energy-efficient. Necessity remains the mother of capital expenditure.
A deeper look at the latest structural analysis from the Resolution Foundation reveals a highly unequal recovery. The gains are heavily concentrated in London and the South East. The “long tail” of underperforming British companies—the thousands of small and medium-sized enterprises that lag far behind their German or French counterparts in adopting basic management software—remains largely unchanged. The UK essentially operates with a vanguard of globally competitive firms dragging a vast, inefficient hinterland behind them. If the government cannot find a mechanism to force technology adoption down into the mid-market, this productivity rebound will hit a hard ceiling.
Implications and Second-Order Effects
If this productivity rebound solidifies, the downstream effects on the British economy will be profound. For the Treasury, it is the ultimate silver bullet. Productivity growth is the only sustainable way to increase tax revenues without raising tax rates. Even a 0.5 percent annual improvement in the trend rate of productivity growth would wipe tens of billions off the national debt over a decade. It provides the exact fiscal headroom that recent Chancellors have desperately lacked when trying to fund an ageing National Health Service.
For the average citizen, it translates directly to real wage growth. In a low-productivity environment, any increase in wages is inherently inflationary. Firms simply pass the cost of higher salaries onto consumers. But when workers produce more per hour, companies can afford to pay them more without raising prices. It breaks the dreaded wage-price spiral that has defined British monetary policy over the last three years.
Financial markets are already beginning to price in this structural improvement. Sterling has shown recent resilience against the dollar, and foreign direct investment is tentatively returning to British infrastructure. A recent analysis by the Organisation for Economic Co-operation and Development (OECD) highlighted that the UK is uniquely positioned to benefit from the deployment of artificial intelligence in the services sector. Given its heavy reliance on finance, legal, and consulting industries, Britain has a structural advantage if it can deploy AI tools rapidly.
However, policymakers must not mistake a cyclical bump for a permanent victory. Achieving a high-wage, high-productivity economy requires relentless policy discipline. The government will need to commit to long-term infrastructure projects, reform the archaic Town and Country Planning Act of 1990, and dramatically improve technical education. Without these foundational changes, the current £15 billion uptick in output will simply be a brief detour on a long road of managed decline.
The Illusion of Progress
Not everyone is convinced that the British economic engine has genuinely restarted. Skeptics argue that the recent data is heavily distorted by the aftermath of the pandemic and the subsequent inflation shock.
The dissenting view is rooted in the mechanics of labour hoarding. During the tight labour markets of 2022 and 2023, firms held onto staff even as demand cooled. They were terrified they would not be able to re-hire them when the economy recovered. This artificially depressed output per hour. What we are seeing now, critics argue, is simply the unwinding of that phenomenon. Firms are quietly shedding excess staff, meaning the same amount of work is being done by fewer people. That mathematically boosts productivity on a spreadsheet. Yet, it is a one-off accounting adjustment, not a structural leap in technological capability.
The Financial Times’ macroeconomic team recently highlighted the persistently low levels of public investment. You cannot build a high-productivity private sector on top of crumbling public infrastructure. With the NHS struggling to clear waiting lists, a significant portion of the working-age population remains economically inactive due to long-term sickness. Nearly 2.8 million Britons are currently out of the workforce for health reasons.
“We are mistaking a dead cat bounce for a sustained economic lift-off,” notes Torsten Bell, an economic policy expert. “Until we solve the chronic lack of domestic capital investment and the health-related shrinkage of our labour force, any productivity figures in the green are just statistical noise.”
The Verdict
The debate over British economic output is ultimately a debate about the country’s future place in the world. The UK is standing at a precarious inflection point. The recent data provides a tantalising glimpse of what a higher-functioning British economy could look like: one where capital is deployed efficiently, wages rise in real terms, and living standards actually improve.
Yet, one quarter of positive data does not erase fifteen years of stagnation. The structural rot—chronic underinvestment, a fragmented skills pipeline, and massive regional disparities—has not been magically cured by a few months of positive service sector returns. What we have been granted is a window of opportunity. The tentative rebound in output per hour proves that the British economy is not inherently doomed to low growth. It can adapt, and it can innovate. But turning this statistical blip into a generational economic renaissance will require a level of political courage and corporate ambition that has been entirely absent for the last decade. A nation cannot shrink its way to prosperity.
Discover more from The Economy
Subscribe to get the latest posts sent to your email.

On the morning of 3 June 2026, a parliamentary committee room heard an admission that would have been unthinkable five years ago. Tulip Siddiq, Economic Secretary to the Treasury, faced MPs’ questions about why London — a city that once branded itself the fintech capital of the world — has only a handful of fully regulated stablecoin issuers, while the European Union has licensed 18 across multiple member states since its Markets in Crypto-Assets (MiCA) regime went live. “We’ve been too cautious,” she said. The quiet in the room afterwards wasn’t disagreement. It was recognition that the UK’s prized financial services sector has let a critical piece of the digital money infrastructure slip.
The global stablecoin market was worth $178 billion at the end of May 2026, according to data from CoinGecko, and Circle’s USDC alone processes more than $5 trillion in on-chain transfers each year. The Bank for International Settlements has described stablecoins as “the rails of programmable money” — the plumbing that will carry everything from tokenized deposits to instantaneous cross-border trade settlement. Britain’s own fintech ecosystem gave the world Monzo, Revolut, and Wise. Yet when Revolut wanted to issue its own fiat-backed token this spring, it chose a MiCA licence from the Central Bank of Ireland, not one from the UK. The picture is more complicated than simple sluggishness, but the outcome is the same: the country that wrote the rulebook on global finance now finds itself reading from someone else’s.
The Core Development: Why the UK’s Stablecoin Regime Stalled
The UK’s legislative foundation for stablecoin regulation arrived with the Financial Services and Markets Act 2023, which gave the Treasury sweeping powers to bring fiat-backed stablecoins into the regulatory perimeter. What followed, however, was a sequence of consultation papers, discussion documents, and a sandbox — the Digital Securities Sandbox — that, while innovative, has not yet translated into a live authorisation pathway for issuers. As of 10 June 2026, the Financial Conduct Authority’s cryptoasset register lists just 42 firms with full anti-money-laundering registration, and only three of those are actively testing stablecoin issuance inside the sandbox, none with the ability to launch at scale.
Contrast that with the EU. Since MiCA’s stablecoin provisions took full effect in January 2025, Circle, the world’s second-largest stablecoin operator, secured a licence, and Tether, with a market capitalisation of $97 billion, has signalled it will follow. The European Banking Authority has published detailed technical standards on capital requirements, liquidity buffers, and recovery plans. This regulatory clarity is drawing a flock of new entrants, while the UK’s “near-final” regime — the Treasury’s phrase in its June 2026 consultation response — remains exactly that: near-final.
A Bank of England discussion paper released on 5 June 2026 underscores the stakes. It estimates that if stablecoins used for UK payments grow to just 5% of the sterling broad money supply — roughly £150 billion — the failure of a single systemic stablecoin could impose £12 billion in resolution costs. The Bank is understandably risk-averse. But the same paper notes that “a well-designed regulatory framework can mitigate these risks while enabling innovation,” a sentence that feels like a quiet rebuke to those who have used financial stability as a justification for indefinite delay.
What a Catch-Up Strategy Demands
Catching up is not about copying MiCA wholesale. It’s about designing a regime that is both rigorous and commercially attractive — one that recognises stablecoins as a distinct class of payments infrastructure, not merely a crypto curiosity. Three things are essential.
First, the UK must move from a sandbox to a full authorisation pathway within 12 months. The current two-phase approach — the sandbox giving way to a statutory instrument that will bring regulated stablecoins into the Payment Systems Regulator’s oversight — is sensible on paper, but the timeline is too slow. The European Banking Authority approved its first full MiCA licence 14 months after the regime went live. The UK’s first full authorisation, by the Bank of England’s own estimate, will not arrive before late 2027. Every quarter that passes without a domestically issued, pound-referenced stablecoin, more liquidity migrates to dollar- or euro-denominated instruments issued from Dublin, Paris, or Zug.
Second, the tax treatment of stablecoin transactions needs to be clarified. HMRC’s 2024 guidance on decentralised finance left significant ambiguity about whether exchanging stablecoins for sterling triggers a capital gains event. A survey of 130 UK fintech firms by Innovate Finance in April 2026 found that 67% cited “unresolved tax treatment” as a reason they would not launch a sterling stablecoin this year. The Treasury’s consultation response acknowledged this, but stopped short of a concrete commitment to treat stablecoin redemptions as exempt.
Third, the Bank of England and the FCA should signal, before the autumn, the capital and liquidity requirements they will apply to systemic stablecoin issuers. A working paper by the IMF published on 8 June 2026 warns that inconsistent capital regimes across jurisdictions create regulatory arbitrage — where issuers choose the softest regime. The paper directly cites the UK as a jurisdiction “at risk of late-mover disadvantage” if it does not calibrate requirements precisely. The Bank’s paper already leans in this direction, proposing a leverage ratio floor of 5% and a high-quality liquid asset requirement of 100% of face value. Publishing those numbers in a binding rulebook, rather than a discussion document, would give the market something to price in.
Why is the UK falling behind on crypto regulation?
The UK’s crypto framework, including stablecoins, has been delayed by a combination of post-Brexit regulatory bandwidth constraints, extreme caution after the FTX and Terra collapses, and a political environment that prioritised other financial reforms. The FCA, tasked with simultaneously building a new consumer duty regime and overhauling listing rules, simply had limited resources to devote to cryptoassets. The result is a regulatory vacuum that is being filled by competitors.
Implications: London’s Claim as a Global Financial Hub
The second-order effects of delay are already visible. The London Stock Exchange Group’s plan to build a blockchain-based trading venue for tokenized securities, announced in 2024 with considerable fanfare, depends on the availability of regulated, sterling-settled stablecoins for delivery-versus-payment. Without them, that project becomes an elegant piece of technology waiting for a foundational layer that doesn’t exist. A person familiar with the initiative, who asked not to be named, said the LSEG team now intends to use euro stablecoins issued under MiCA for initial trials, a quiet but significant shift.
The talent dimension is equally sharp. The global competition for developers who understand zero-knowledge proofs, smart contracts, and compliance engineering is fierce. Dublin, Lisbon, and Zurich have all rolled out tax incentives to attract crypto talent. London remains a magnet, but a Financial Times report published in May 2026 tracked 250 fintech engineering jobs that moved from London to EU cities in the first quarter alone, many citing “regulatory certainty” as a factor. When Circle opened its European headquarters in Paris last year, CEO Jeremy Allaire told the FT: “We go where the clarity is.”
Still, there are legitimate counterarguments to the narrative that the UK has simply been slow.
A Deliberate Caution That Has Its Merits
Professor Rosa Lastra, the Sir John Lubbock Chair in Banking Law at Queen Mary University of London, argued in a Bank of England guest paper that the UK’s incrementalism is not indecision but a principled recognition that stablecoins, once systemic, effectively become public money substitutes. “A state cannot outsource its seigniorage to an algorithm without rigorous constitutional safeguards,” she wrote. The UK’s phased approach — demanding that systemic stablecoins hold reserves wholly at the Bank of England, for instance — may indeed create a safer domestic framework than MiCA, which allows for a broader range of reserve assets including government bonds and reverse repo agreements.
The counter-counterpoint, and one the industry makes loudly, is that safety without a functioning market is academic. The question is not whether a flawlessly safe regime can be designed in a decade; it’s whether a sufficiently safe regime can be delivered now, while the UK still has a chance to anchor a significant share of sterling-referenced stablecoin activity. If the answer is no, the market will simply use dollar and euro stablecoins for all the use cases the Treasury’s own consultation says it wants to enable — from programmable payments for energy grids to instant settlement of corporate treasuries. That outcome would leave the UK with all the financial stability risks and none of the commercial upside.
What follows, however, is an uncomfortable truth: the EU’s MiCA, for all its bureaucratic heft, is functioning. It has issued licences, attracted the two largest dollar stablecoins, and triggered a wave of euro-referenced stablecoins that didn’t exist two years ago. The UK’s regime, by contrast, is still an elaborate set of carefully worded intentions.
Closing
In the end, the stablecoin catch-up is not a technology problem. The UK has the engineering talent, the legal expertise, and the financial infrastructure that most jurisdictions can only envy. It is a problem of political will — of deciding that the benefits of being a home jurisdiction for the digital money layer outweigh the perceived risks of moving from consultation to implementation. The Treasury’s June 2026 response suggests that decision is close. The question is whether it will arrive before the window of competitive advantage has quietly shut.
In the race for the rails of 21st-century finance, hesitation is a luxury the UK can no longer afford.
Discover more from The Economy
Subscribe to get the latest posts sent to your email.
-

 Markets & Finance5 months ago
Top 15 Stocks for Investment in 2026 in PSX: Your Complete Guide to Pakistan’s Best Investment Opportunities
-

 Analysis4 months ago
Top 10 Stocks for Investment in PSX for Quick Returns in 2026
-

 Analysis4 months ago
Brazil’s Rare Earth Race: US, EU, and China Compete for Critical Minerals as Tensions Rise
-

 Banks5 months ago
Best Investments in Pakistan 2026: Top 10 Low-Price Shares and Long-Term Picks for the PSX
-

 Investment5 months ago
Top 10 Mutual Fund Managers in Pakistan for Investment in 2026: A Comprehensive Guide for Optimal Returns
-

 Analysis4 months ago
Johor’s Investment Boom: The Hidden Costs Behind Malaysia’s Most Ambitious Economic Surge
-

 Global Economy6 months ago
15 Most Lucrative Sectors for Investment in Pakistan: A 2025 Data-Driven Analysis
-

 Global Economy6 months ago
Pakistan’s Export Goldmine: 10 Game-Changing Markets Where Pakistani Businesses Are Winning Big in 2025