
Opinion
China’s Ice Silk Road 2026: Arctic Strategy and Geopolitical Shift
What is China’s Ice Silk Road?
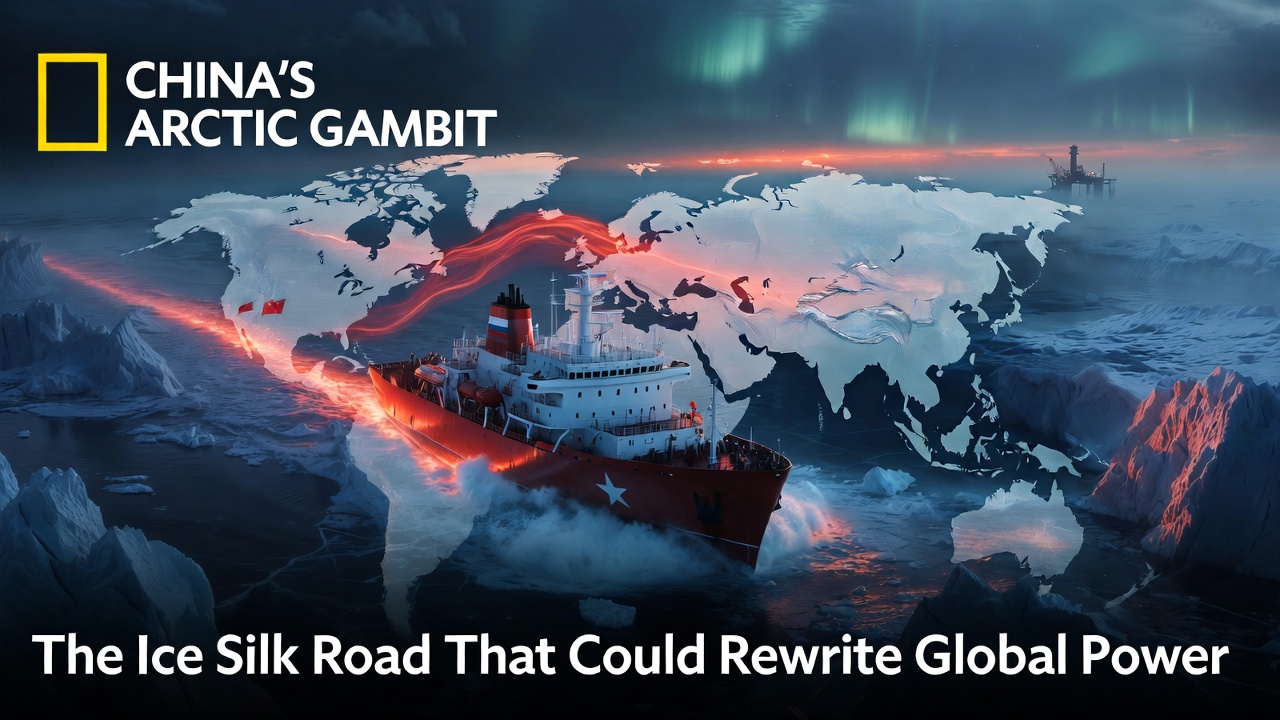
China’s “Ice Silk Road”—also known as the Polar Silk Road—is an ambitious extension of its Belt and Road Initiative into the Arctic, formally unveiled in Beijing’s 2018 Arctic Policy White Paper. It envisions a new maritime corridor linking China to Europe via the Northern Sea Route (NSR), capitalizing on melting ice to shorten shipping times and secure energy resources. Far from mere rhetoric, it reflects China’s self-proclaimed status as a “Near-Arctic State” and its drive to become a “Polar Great Power.”
Here are the key geopolitical implications emerging in 2026:
- Strategic bypass: The NSR offers an alternative to the vulnerable Malacca Strait, through which 80% of China’s energy imports flow.
- Deepening Russia ties: Over 90% of China’s Arctic investments target Russian projects, but this partnership strengthens Moscow’s leverage.
- Emerging tensions: Accelerated ice melt raises prospects for resource disputes and militarization, transforming the Arctic from a frozen barrier into a potential frontline.
- Western pushback: Setbacks in Greenland and elsewhere highlight security concerns from the U.S. and allies.
- Opportunities for balancers: Nations like South Korea could exploit subtle divergences between China, Russia, and North Korea to enhance regional stability.
Yet beneath the economic rhetoric lies a more profound shift. China’s Arctic push exploits climate change and opportunistic alliances to challenge Western maritime dominance, creating ripple effects for global security—from U.S. homeland defense to alliances in Asia.
Roots of Ambition: From Xi’s Vision to National Security Doctrine
The Ice Silk Road traces back to 2014, when President Xi Jinping, aboard the icebreaker Xuelong in Tasmania, declared China’s intent to evolve from a “Polar Big Power”—focused on quantitative expansion—to a qualitative “Polar Great Power.” This marked a pivot toward technological independence, governance influence, and maximized benefits.
By 2018, China’s first Arctic White Paper formalized the strategy, asserting rights under UNCLOS for navigation, research, and resource development while proposing to “jointly build” the Ice Silk Road with partners, primarily Russia. The 2021-2025 Five-Year Plan elevated polar regions as “strategic new frontiers,” tying them to maritime power goals.
Recent doctrine escalates this further. A 2025 national security white paper equates maritime interests with territorial sovereignty, implying potential justification for power projection in distant seas—including the Arctic. This evolution signals that Beijing views the far north not just as an economic opportunity, but as integral to core security.
Tangible Progress: Shipping Boom and Energy Stakes
China’s advances are most visible in the NSR’s rapid commercialization. Despite challenges, traffic has surged: in 2025, Chinese operators completed a record 14 container voyages, pushing transit cargo to new highs around 3.2 million tons across roughly 103 voyages.Reuters report on Chinese Arctic freight
Overall NSR activity reflects steep growth, with container volumes rising noticeably as Beijing accumulates expertise through state-owned COSCO and domestic shipbuilding.

Energy dominates investments. China has poured capital into Russian LNG projects like Yamal and Arctic LNG 2, undeterred by sanctions—receiving 22 shipments from sanctioned facilities in 2025 alone.Reuters on sanctioned Russian LNG to China Stakes in Gydan Peninsula developments and progress on onshore pipelines underscore this focus.
Scientific footholds, such as the China-Iceland Arctic Science Observatory, bolster presence, though Western analysts flag dual-use potential for surveillance.
Setbacks Amid Pushback: The Limits of Influence
Success has been uneven. Attempts to develop rare earths in Greenland faltered due to local elections and U.S.-Danish interventions, while airport bids and a proposed Finland-Norway railway collapsed amid security fears. These episodes reveal a geopolitical environment where economic overtures collide with alliance checks.CSIS analysis on Greenland and Arctic security
As ice recedes, non-Arctic actors like China face scrutiny, with coastal states prioritizing sovereign control.
Core Implications: Bypassing Chokepoints and Shifting Balances
The NSR’s strategic value shines in its potential to circumvent the Malacca dilemma—a “single point of failure” for China’s imports. Largely within Russia’s EEZ, it shields traffic from U.S. naval reach, provided Sino-Russian ties hold.Economist on Russia-China Arctic plans
This dependency cuts both ways: Russia gains leverage over route access. Emerging continental shelf claims, like those over the Lomonosov Ridge, foreshadow disputes, while melting enables permanent basing and submarine operations—altering force projection dynamics.Economist interactive on Arctic military threats
For the U.S., the Arctic shifts from natural barrier to vulnerable flank, demanding costly investments in icebreakers and defenses.Economist on U.S. icebreaker gap
Exploratory Risks: New Frontlines and Regional Dynamics
Three hypotheses illuminate 2026 risks.
First, climate change erodes U.S. strategic depth, elevating the Arctic to homeland priority as Russia and China probe nearer Alaska.NYT on Arctic threats NATO’s Arctic majority (excluding Russia) risks fault lines, yet Moscow’s wariness of Chinese encroachment—evident in restricted data sharing—limits full alignment.Carnegie on Sino-Russian Arctic limits
Second, China’s desired Tumen River outlet to the East Sea remains blocked by Russia and North Korea, preserving their ports and leverage. Joint infrastructure reinforces this check.
Third, U.S. “bifurcated” positioning—treating North Korea as a bolt against Chinese expansion—requires peninsular stability, pushing allies toward greater burden-sharing.
2026 Outlook: Stalled Pipelines and Heightened Vigilance
Early 2026 brings mixed signals. Power of Siberia 2 talks persist, with China holding pricing leverage amid alternatives; completion could take years.Carnegie on Russia-China gas deals NSR container traffic booms, but sanctions and ice variability temper euphoria.
Tensions simmer: Norway tightens Svalbard controls against Russian (and Chinese) influence, while Greenland’s resources draw renewed scrutiny.NYT on Svalbard Arctic control
For the West, urgency lies in coordinated deterrence—bolstering icebreaking, alliances, and governance—without provoking escalation. Allies like South Korea could preemptively stabilize by restoring ties with Russia and engaging North Korea, alleviating asymmetries that fuel bloc formation.Brookings on China Arctic ambitions
A Calculated Gambit in a Warming World
China’s Ice Silk Road is no fleeting venture; it’s a sophisticated play harnessing environmental upheaval and pragmatic partnerships to redraw global contours. In 2026, as routes open and stakes rise, the Arctic tests whether cooperation or competition prevails. The West cannot afford complacency—strategic adaptation, not isolation, offers the best counter. This melting frontier demands attention, lest it freeze old alliances into irrelevance.
References
Brookings Institution. (n.d.). China’s Arctic activities and ambitions. https://www.brookings.edu/events/chinas-arctic-activities-and-ambitions/
Carnegie Endowment for International Peace. (2025, February 18). The Arctic is testing the limits of the Sino-Russian partnership. https://carnegieendowment.org/russia-eurasia/politika/2025/02/russia-china-arctic-views?lang=en
Carnegie Endowment for International Peace. (2025, September 22). Why can’t Russia and China agree on the Power of Siberia 2 gas pipeline? https://carnegieendowment.org/russia-eurasia/politika/2025/09/russia-china-gas-deals?lang=en
Center for Strategic and International Studies. (2025). Greenland, rare earths, and Arctic security. https://www.csis.org/analysis/greenland-rare-earths-and-arctic-security
Jun, J. (2025, December 31). China’s ‘Ice Silk Road’ strategy and geopolitical implications. The East Asia Institute.
Reuters. (2025, October 14). Chinese freighter halves EU delivery time on maiden Arctic voyage to UK. https://www.reuters.com/sustainability/climate-energy/chinese-freighter-halves-eu-delivery-time-maiden-arctic-voyage-uk-2025-10-14/
Reuters. (2026, January 2). China receives 22 shipments of LNG from sanctioned Russian projects in 2025. https://www.reuters.com/business/energy/china-receives-22-shipments-lng-sanctioned-russian-projects-2025-2026-01-02/
The Economist. (2025, January 23). The Arctic: Climate change’s great economic opportunity. https://www.economist.com/finance-and-economics/2025/01/23/the-arctic-climate-changes-great-economic-opportunity
The Economist. (2025, October 2). How bad is America’s icebreaker gap with Russia? https://www.economist.com/europe/2025/10/02/how-bad-is-americas-icebreaker-gap-with-russia
The Economist. (2025, November 12). The Arctic will become more connected to the global economy. https://www.economist.com/the-world-ahead/2025/11/12/the-arctic-will-become-more-connected-to-the-global-economy
Discover more from The Economy
Subscribe to get the latest posts sent to your email.


Analysis
Børge Brende WEF Resignation Epstein: How One Scandal Broke an Institution Already on Its Knees
The departure of the World Economic Forum’s CEO over Jeffrey Epstein ties is more than a personal scandal — it is an institutional reckoning with elite impunity at Davos.
There is a particular kind of silence that descends on institutions when their carefully constructed image of moral authority finally collapses. On February 26, 2026, that silence fell over the headquarters of the World Economic Forum in Cologny, Switzerland — a sleek stone-and-glass building overlooking Lake Geneva that has come to symbolize the lofty ambitions, and equally lofty contradictions, of the global elite. Børge Brende, president and CEO of the WEF, announced he was stepping down after the organization launched an independent investigation into his relationship with the late sex offender Jeffrey Epstein. CNN He had been in the role for eight and a half years. He leaves it diminished, and so, many argue, does the institution he led.
The timing is brutal. Just five weeks earlier, Brende had stood on the Davos stage interviewing US President Donald Trump following his address to global leaders. CNN The Forum had declared its 2026 annual meeting a triumph. And then the files arrived.
The Resignation: What the Epstein Files Revealed
Documents in the Epstein files showed Brende arranging to meet the financier at his home in New York for dinner in 2018 and 2019. The second of those meetings was planned just weeks before Epstein’s arrest on federal sex trafficking charges. Bloomberg He died in jail in August 2019, his network of wealthy and influential contacts frozen in amber by circumstance — until the US Department of Justice began releasing millions of pages of documents in late 2025 under the Epstein Files Transparency Act.
The WEF launched an independent review earlier this month when it emerged that Brende had attended three business dinners with Epstein in 2018 and 2019, as well as communicated with him via emails and text messages. At least one of the dinners took place at Epstein’s New York home, according to the emails. CNN What made the correspondence particularly damaging was its warmth. The Financial Times reported that Brende wrote to Epstein: “thx for a very interesting dinner … You’re a brilliant host,” and in another message said, “Missing you Sir.” Breitbart
In an earlier statement after the WEF launched its probe, Brende said he had been “completely unaware of Epstein’s past and criminal activities” and would not have communicated or attended dinners with him had he known. “I recognize that I could have conducted a more thorough investigation into Epstein’s history, and I regret not doing so,” he said. CNN That admission — careful, measured, calibrated to minimize — could not withstand the accumulating weight of scrutiny.
The contradiction at the heart of Brende’s defence deserves examination. By 2018, Epstein’s 2008 conviction for procuring a minor for prostitution was a matter of public record. The former Norwegian foreign minister — a man whose entire professional life was built on due diligence, diplomatic intelligence, and geopolitical risk assessment — claims he did not investigate Epstein’s background. He had, in fact, denied ever having met Epstein as recently as November 2025, before the document release forced him to acknowledge the contacts. Wikipedia This reversal, combined with the tonal intimacy of the emails, generated precisely the kind of “distraction” that would ultimately cost him his position.
In a joint statement, WEF co-chairs André Hoffmann and Larry Fink said the independent review had concluded, with findings that “there were no additional concerns beyond what had been previously disclosed.” Al Jazeera Brende’s resignation statement, notably, made no mention of Epstein, with Brende saying only that “now is the right moment for the Forum to continue its important work without distractions.” Axios Alois Zwinggi will take over as interim president and chief executive with immediate effect, with the WEF Board of Trustees supervising the leadership transition and beginning the process of identifying a permanent successor. wionews
WEF CEO Quits Jeffrey Epstein Ties: A Growing Casualty List
Brende’s departure is the latest in what has become a rolling institutional crisis in the corridors of global power. The list of executives whose careers have been derailed by the Epstein files includes Hyatt Hotels executive chairman Tom Pritzker, top Goldman Sachs lawyer Kathy Ruemmler, and Sultan Ahmed bin Sulayem, CEO of DP World. CNN Brad Karp, chair of top corporate law firm Paul, Weiss, resigned after his emails with Epstein were revealed. Casey Wasserman, the Hollywood talent agent who chairs the LA28 Olympic committee, said he would sell his agency after his Epstein ties were disclosed. Axios
What distinguishes this wave from earlier Epstein fallout — such as the 2021 departures of Apollo Global Management CEO Leon Black and Barclays CEO Jes Staley — is its velocity and geographical breadth. The DOJ’s release of over three million documents has created a kind of accountability avalanche that no elite management communications team was prepared for. The files do not merely name individuals; they document the texture of relationships, the tone of correspondence, the specificity of social arrangements. In that texture, reputations dissolve.
Norway’s Epstein Shadow: Jagland, Brende and a Pattern of Proximity
For Norway, a country that has long positioned itself as a global moral beacon — home to the Nobel Peace Prize, a leader in development aid, a proponent of multilateral governance — the Epstein files have been a particular kind of reckoning.
Thorbjørn Jagland, former Norwegian prime minister and former secretary-general of the Council of Europe, has been charged with “aggravated corruption” following a police probe into his Epstein ties. Terje Rød-Larsen and his wife Mona Juul, both diplomats, have also been charged. Al Jazeera These are not peripheral figures in Norwegian public life. They are among the country’s most senior statesmen, individuals who spent careers representing humanitarian values on the international stage.
The pattern invites uncomfortable analysis. Norway’s small, tightly networked political elite — educated at the same institutions, rotating through the same multilateral organizations, attending the same Davos dinners — may have been structurally predisposed to encounter Epstein’s curated world of access and influence brokerage. Epstein did not merely collect the powerful; he collected people who collected the powerful. Norwegian diplomats and multilateral organization heads were precisely the kind of connective tissue he sought. That Brende and Jagland should both appear in the files, in different capacities, is less a coincidence than a reflection of how Epstein understood and exploited the architecture of global influence.
The WEF’s Institutional Reckoning: From Schwab to Brende
Klaus Schwab’s abrupt departure from the World Economic Forum, the influential organization he founded and led for more than half a century, had already complicated carefully laid plans to persuade Christine Lagarde to assume the helm in a seamless transition. Bloomberg Schwab resigned from the post of chairman at the end of April 2025 in the wake of an external investigation into allegations of possible misconduct, which he denies. Swissinfo In the aftermath, Larry Fink and André Hoffmann were appointed interim co-chairs of the Board of Trustees. Wikipedia
The Brende crisis arrives, therefore, not as an isolated shock but as the second major leadership implosion inside twelve months at an organization that has, for over five decades, styled itself as a forum for responsible global leadership. Davos has always attracted criticism — for its carbon-intensive private jets, its exclusive membership fees, its air of patrician consensus-building insulated from democratic accountability. But until recently, that criticism was largely tolerated as the price of convening power. Two consecutive leadership scandals have changed the calculus. The WEF was also reportedly under Swiss investigation in February 2026 over whether it had broken the law by paying Brende around 19 million NOK in salary — 3 million more than the previous year — with questions arising over whether such remuneration to managers of a tax-exempt non-profit foundation could constitute illicit enrichment. Wikipedia
These are no longer questions about optics. They are questions about governance.
Epstein Scandal Davos 2026: Economic and Reputational Fallout
For international economists and governance researchers, the question is not simply whether Børge Brende had inappropriate ties to a convicted sex offender. The deeper question is structural: what does it mean for an organization whose core value proposition is convening power when that power becomes associated, even tangentially, with the Epstein network?
The WEF’s revenue model depends on roughly 1,000 member companies — typically multinationals with annual turnovers exceeding $5 billion — paying substantial membership fees for access to the annual Davos gathering and year-round platform benefits. Participation is not merely transactional; it is reputational. CEOs attend Davos partly because other CEOs attend Davos. That reflexive logic of prestige is durable, but not infinitely so. Two consecutive scandals involving the organization’s most senior figures, combined with the broader Epstein fallout now touching multiple Davos-adjacent networks, introduce a reputational friction that some corporate governance officers and compliance teams will find professionally untenable to ignore.
There are also structural questions about the WEF’s convening model in the current geopolitical climate. The January 2026 Davos meeting was notable partly because Donald Trump’s presence and tariff-focused address served, in the words of one analyst, as a direct challenge to the globalist consensus the WEF has long championed. The departure of Schwab, who created that consensus over 55 years, followed by the departure of his designated operational heir under Epstein-related pressure, leaves the Forum without a defining intellectual anchor at precisely the moment when the political philosophy it represents is under its most sustained global challenge since the 1990s.
Alois Zwinggi Interim WEF CEO: What Comes Next?
Alois Zwinggi, a managing director of the WEF, has been appointed interim president and chief executive while the board manages the leadership transition. Christine Lagarde, ECB President, has widely been seen as a potential future chair following the departure of WEF founder Klaus Schwab. euronews However, within the Swiss organization, Lagarde has begun to be viewed as “Klaus’s candidate,” a label that has started working against her, with some around the organization becoming wary of any perception of an overly close connection to the previous leadership. BankingNews
The search for permanent leadership, therefore, remains genuinely open — and genuinely fraught. The new WEF president will need to achieve several incompatible things simultaneously: demonstrate a clean break from the Schwab and Brende eras while preserving the institutional relationships those eras cultivated; rebuild confidence among corporate members growing wary of reputational entanglement; and provide an intellectual vision capable of justifying Davos’s continued relevance in an era of economic nationalism, democratic populism, and deep public suspicion of multilateral elite institutions.
That is not an impossible brief. But it is a daunting one. And the organization’s recent track record in identifying, vetting, and retaining leadership has not been encouraging.
A Forum at the Crossroads
The story of Børge Brende’s resignation over Epstein ties is ultimately a story about institutional trust in the age of radical transparency. The Epstein files did not create the relationships they exposed; they merely illuminated them. In a previous era, three business dinners with a disgraced financier, however ill-judged, might have remained a private embarrassment managed through careful distance and quiet acknowledgment. In 2026, with three million documents digitally searchable and a global media ecosystem attuned to the cadence of elite accountability, there is no such discretion available.
The World Economic Forum will survive this. Institutions with the WEF’s structural advantages — established relationships, financial reserves, a half-century of convening infrastructure — do not simply dissolve because their leaders err. But the organization that emerges from this period of twin crises will need to do more than change its faces. It will need to change its self-conception: from a summit of the world’s most powerful people managing global challenges on behalf of everyone else, to something more modest, more accountable, and more genuinely connected to the populations whose futures it claims to shape.
That transformation, if it comes at all, will be far harder than replacing a president and CEO.
Discover more from The Economy
Subscribe to get the latest posts sent to your email.
Analysis
Yen to Decide if Japan’s ‘Iron Lady’ is Steely or Rusty: Takaichi’s Path to Economic Revival and Global Influence in 2026
Sanae Takaichi economic policy 2026 is now the most consequential story in Asian geopolitics. Japan’s first female prime minister has a landslide mandate, a supermajority in parliament, and a to-do list that would humble most heads of state. But the real verdict on her premiership will not be delivered by pollsters or pundits — it will be rendered, quietly and ruthlessly, by the foreign-exchange market. At roughly ¥156 to the dollar as of late February 2026, the yen is part barometer, part referendum. If Takaichi can coax it stronger, she will have earned her iron. If it wilts further, the rust will show.
A Landslide Built on Frustration — and Expectation
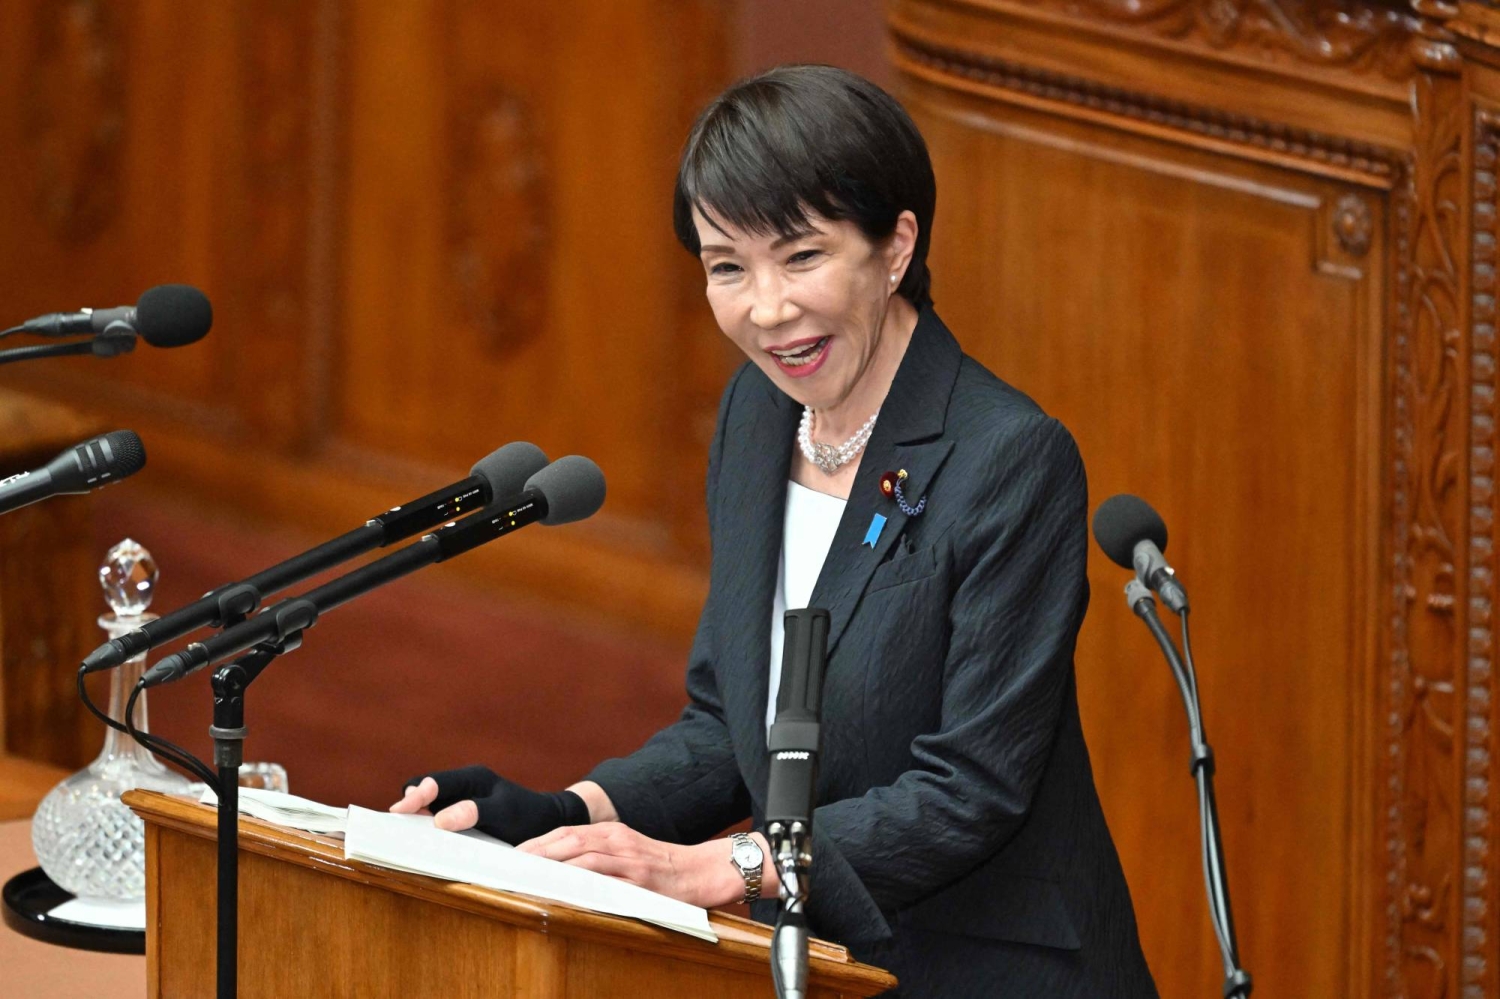
On February 8, 2026, Sanae Takaichi did what no woman had done in Japan’s 76 years of post-war parliamentary democracy: she won a commanding general election and walked into the Kantei as prime minister. The Liberal Democratic Party’s victory was not merely symbolic. With a two-thirds supermajority in the Lower House, the LDP now controls the legislative machinery of the world’s fourth-largest economy with a completeness that Takaichi’s predecessors — a procession of short-lived leaders who averaged barely fourteen months in office across the last decade — could only dream of.
The election result represented a decisive break from Japan’s revolving-door politics. Since Shinzo Abe’s resignation in 2020, Japan has cycled through five prime ministers in five years, each one eroding investor confidence and diplomatic continuity. Takaichi’s victory, analysts at the Brookings Institution noted, was powered by voter exhaustion with instability as much as by enthusiasm for her agenda — a distinction that matters enormously for how durable her mandate will prove.
Her agenda is ambitious by any measure. She has pledged to tame inflation, boost household incomes that have stagnated in real terms for the better part of three decades, and — most fraught of all — strengthen a yen that has become a source of national anxiety.
Takaichi’s Economic Mandate: Taming Inflation and the Yen
Japan’s consumer price index, stripped of fresh food, is running at approximately 2.5% — a number that sounds modest by the standards of recent Western experience but represents a generational shock in a country that lived with deflation for much of the 1990s and 2000s. For ordinary Japanese households, the bite is real: energy costs, imported food prices, and service-sector wages have all risen in ways that nominal pay increases have not fully offset.
Takaichi has framed her economic agenda around three interlocking priorities. First, price stability — not by returning to deflation, but by anchoring inflation in a zone that feels like prosperity rather than punishment. Second, income growth, with a particular emphasis on small and medium-sized enterprises, which employ roughly 70% of Japan’s private-sector workforce. Third, and most geopolitically charged: a stronger yen.
The yen’s current weakness — hovering near ¥156 per dollar as of late February 2026 — is the compound product of years of ultra-loose monetary policy, dovish appointments to the Bank of Japan’s policy board, and persistent hesitation about rate hikes in an economy still scarred by deflationary memory. The irony is acute: Takaichi herself has historically been associated with the “Abenomics” school of aggressive monetary easing. Her pivot toward yen strength represents either a genuine ideological evolution or a calculated response to political headwinds — and the markets are watching closely to determine which.
| Indicator | Current Value (Feb 2026) | Target / Direction |
|---|---|---|
| USD/JPY Exchange Rate | ~¥156 | Strengthen toward ¥140–145 |
| Core CPI (ex. fresh food) | ~2.5% YoY | Stabilize near 2.0% |
| BOJ Policy Rate | 0.5% | Cautious, gradual tightening |
| LDP Lower House Seats | ~310 (two-thirds+) | Supermajority retained |
| Avg. PM Tenure (2020–2025) | ~14 months | Extend to Abe-length horizon |
Bloomberg’s USD/JPY analysis has flagged that yen depreciation in the range of ¥150–160 creates a self-reinforcing problem: it inflates import costs, which feeds the very CPI pressure Takaichi wants to suppress, which in turn demands BOJ action that her own dovish board appointments have complicated. Breaking this loop will require either a coherent signals strategy with the BOJ or a willingness to replace key officials — a politically costly move she has so far resisted.
Reuters currency strategists have modeled scenarios in which a credible fiscal consolidation signal from Tokyo, combined with even a modest BOJ rate path, could bring USD/JPY back toward ¥145 by year-end. That would represent a 7% yen appreciation — meaningful for households but not catastrophic for Japan’s export machine, which has partly adapted to weaker-yen conditions over the past three years.
Japan Yen Strength Under Takaichi: The Policy Toolkit
The challenge of yen management is that it sits at the intersection of monetary, fiscal, and diplomatic policy in ways that resist simple levers. Takaichi’s government has several tools available — and each carries trade-offs.
On the monetary side, the new prime minister must navigate her own history. The Economist’s profile of her conservative agenda notes that she spent much of the last decade advocating for the continuation of Abenomics-style quantitative easing. Reversing course now — or even appearing to — risks accusations of opportunism. Yet the arithmetic of yen weakness is unforgiving. A sustained rate differential between the US Federal Reserve (still holding rates in a 4.25–4.50% corridor) and the BOJ makes carry-trade pressure on the yen almost structural.
On the fiscal side, Takaichi has proposed a stimulus package that blends short-term income support with longer-term investment in semiconductors, green energy, and artificial intelligence — sectors where Japan’s industrial base has competitive depth but chronic underinvestment. Forbes’s analysis of her economic stimulus blueprint suggests the package could inject ¥30–40 trillion over three years, a scale that would rival Abe’s initial Abenomics bazooka. Done right, this could attract foreign capital and support the yen. Done sloppily — with bond issuance outpacing growth returns — it could accelerate the currency’s decline.
The wildcard is the BOJ itself. Takaichi’s recent appointments to the policy board were read by markets as dovish signals, contributing to the yen’s softening in late January 2026. Walking that back without triggering a bond-market sell-off is the central technical challenge of her economic team.
Takaichi vs. Abe Legacy: Foreign Policy Boost from Electoral Strength
In foreign affairs, electoral supermajorities translate into diplomatic credibility in ways that are easy to underestimate. When Shinzo Abe governed from 2012 to 2020 — the longest tenure of any postwar Japanese prime minister — his stability became a strategic asset. Foreign leaders knew he would still be in office in two years. Treaties got signed. Defense upgrades got funded. The Quad — the informal security grouping of the US, Japan, India, and Australia — found its practical architecture during his tenure.
Takaichi has been explicit about emulating that model. She has framed her electoral mandate as a foundation for long-horizon diplomacy: deepening the US alliance, anchoring relationships across Southeast Asia through expanded Official Development Assistance, and advancing Japan’s strategic partnership with India — a relationship with particular resonance given both countries’ desire to hedge against Chinese economic and military assertiveness.
The contrast with the revolving-door years is stark. Between 2020 and 2025, Japan’s foreign counterparts had to recalibrate relationships with five different prime ministers. Diplomatic continuity is not merely an aesthetic preference; it affects the willingness of partners to make binding commitments, share intelligence, and coordinate on multilateral frameworks from trade to climate.
BBC’s coverage of the February 8 election emphasized that her win was received warmly in Washington and Delhi, with early indications of accelerated bilateral defence and technology talks. Whether that goodwill translates into durable institutional architecture — the test of Abe’s legacy — remains to be seen.
Challenges Ahead: Discipline in a Supermajority
Supermajorities are not pure gifts. They carry their own pathologies. A governing coalition with two-thirds of the lower house faces the perennial temptation to overreach — to pursue constitutional revision, defence spending expansion, and structural reform simultaneously, spreading political capital thin and provoking the backlash that has historically dogged the LDP’s more ambitious moments.
Japan economy outlook 2026 among independent economists is cautiously optimistic but conditioned on three risks. First, demographic drag: Japan’s working-age population continues to shrink, limiting the growth ceiling regardless of policy quality. Second, energy vulnerability: with roughly 90% of energy still imported, yen weakness translates directly into household energy costs — a politically explosive channel for any PM who has promised to boost living standards. Third, China exposure: Japan’s supply chains remain deeply integrated with Chinese manufacturing, even as its security posture pivots away from Beijing.
Takaichi’s government will also face the scrutiny that comes with strength. In opposition-thin parliaments, accountability tends to migrate from the floor of the Diet to the media, civil society, and — crucially — financial markets. The Wall Street Journal’s recent analysis of Japan’s fiscal position warned that the new administration’s stimulus ambitions could widen the deficit at precisely the moment when global bond markets are reassessing sovereign credit risk across developed economies.
Yen Impact on Japan Inflation 2026: The Feedback Loop
The relationship between yen impact on Japan inflation 2026 is not merely academic — it is the lived experience of every Japanese consumer who has watched grocery bills climb faster than wages. A yen at ¥156 to the dollar means that every imported barrel of oil, every tonne of wheat, every semiconductor fab component costs roughly 30% more in local-currency terms than it did five years ago.
For Takaichi, this creates a political clock. Her approval ratings — strong now, buoyed by the election — will erode if households feel no relief by mid-2026. The government has proposed targeted subsidies on energy and food staples as a bridge measure, but economists across the spectrum have noted that subsidies without currency stabilisation are a fiscal leak: money flows out through the subsidy channel even as import costs continue rising through the exchange-rate channel.
The BOJ’s next quarterly review, expected in April 2026, will be watched as an early test of whether Takaichi’s government can credibly signal a tighter monetary path without spooking bond markets or triggering a sharp yen overshoot in the other direction. Getting this sequencing right is less art than watchmaking — precision timing, in conditions of significant uncertainty.
Japan’s First Female Prime Minister Foreign Affairs: The Historical Weight
It would be reductive to view Takaichi’s historic significance purely through the lens of the economic numbers. Japan’s first female prime minister carries symbolic weight in a nation where the World Economic Forum’s gender gap index ranks political representation among the lowest in the G7. Her tenure — however it ends — will alter the reference class for what Japanese political leadership can look like.
That said, Takaichi herself has consistently resisted being defined by gender. Her policy instincts are hawkish on defence, conservative on social questions, and market-oriented on economics — a combination that places her in Abe’s ideological tradition rather than a progressive feminist one. The historical irony is not lost on observers: Japan’s glass ceiling in politics was broken not by a centrist reformer but by a hardline nationalist with a record of visiting the Yasukuni Shrine.
This complexity will matter in foreign policy. Relations with South Korea and China — perennially complicated by historical memory — will require careful navigation from a prime minister whose nationalist credentials are well-documented. CSIS analysts have suggested that her strong electoral position could, counterintuitively, give her the political capital to make pragmatic overtures to Seoul and Beijing that weaker predecessors could not risk.
Japan Economy Outlook 2026: Steely or Rusty?
The metaphor embedded in Takaichi’s “Iron Lady” epithet — a comparison she has neither sought nor explicitly repudiated — implies a binary: strength or corrosion. Reality, of course, is more granular.
The case for steeliness is real. She has a supermajority. She has a stable mandate in a system notorious for instability. She has a credible international profile and an ideological tradition with a proven track record of market confidence. And she has, at least rhetorically, identified the right problems: inflation that erodes household welfare, a currency that amplifies every external shock, and an income structure that has left ordinary Japanese workers behind for too long.
The case for rust is equally real. The yen’s weakness is partly her own government’s doing — a product of BOJ appointments that sent dovish signals. Her stimulus agenda carries fiscal risks in a country already carrying a debt-to-GDP ratio above 260%. Her historical association with Abenomics makes credible monetary tightening a harder sell, politically and intellectually.
The yen, ultimately, will arbitrate between these two interpretations. A currency that strengthens by year-end will vindicate her economic framework and give her the diplomatic runway to emulate Abe’s longevity. A currency that drifts toward ¥165 or beyond will tell a different story — one of a leader whose political strength outran her policy coherence.
As Japan navigates 2026, watch the yen as the ultimate barometer. It will move before the polls do, signal before the speeches do, and judge with the cold precision that only markets can muster. Takaichi has the mandate. The question is whether she has the sequencing — and whether Japan’s long-suffering households will give her the time to find out. Bookmark the USD/JPY ticker; it will tell you more about her premiership than any press conference.
Discover more from The Economy
Subscribe to get the latest posts sent to your email.
Analysis
IMF Rebukes China’s Economic Model Amid Its Own Credibility Crisis in a Fractured Global Economy

The world’s financial watchdog has sharp words for Beijing — but can an institution haunted by its own ideological failures be taken seriously?
There is something almost theatrical about the International Monetary Fund lecturing China on economic mismanagement. In February 2026, the IMF published its 2025 Article IV Consultation on China, delivering what amounted to a stern parental rebuke: Beijing’s addiction to exports and industrial subsidies is distorting global markets, hollowing out domestic demand, and exporting deflationary pressure to trading partners who never signed up for it. The prescription was predictably orthodox — cut subsidies, boost consumption, let the yuan appreciate.
That advice might carry more weight if the IMF hadn’t spent the better part of three decades handing out similarly confident prescriptions that blew up spectacularly — from the austerity-driven misery of the 1997–98 Asian financial crisis to its catastrophically optimistic pre-2008 growth models. The IMF’s credibility crisis is not a footnote; it is the essential context for understanding why Beijing is unlikely to listen, and why much of the Global South has quietly stopped caring what Washington’s favorite multilateral institution thinks.
Yet here is the uncomfortable truth that neither side wants to admit: the IMF’s diagnosis of China’s imbalances is largely correct, even if its institutional authority to deliver it is badly compromised. In a Trump-era global economy defined by tariff walls, reshoring fever, and collapsing multilateral trust, the stakes of getting China’s model wrong have never been higher — for Beijing, and for everyone else.
China’s Economic Imbalances in 2026: The Numbers Tell a Brutal Story
GDP Growth Slows as the Export Engine Sputters
The IMF projects China’s GDP growth at 4.5% in 2026 — down from 5.0% in 2024 — with trade uncertainty and escalating U.S. tariffs acting as the primary drags. That figure, while enviable by European standards, masks a more troubling structural reality. China’s growth remains overwhelmingly investment- and export-led, with household consumption accounting for roughly 38% of GDP compared to 68% in the United States and 54% in the eurozone. Beijing has known this for years. Fixing it has proved politically and economically agonizing.
| Indicator | China (2026 Est.) | Global Average | U.S. |
|---|---|---|---|
| GDP Growth | 4.5% | 3.1% | 2.3% |
| Household Consumption (% GDP) | ~38% | ~58% | ~68% |
| Industrial Subsidies (% GDP) | ~4% | ~1.2% | ~1.8% |
| Trade Surplus (USD) | Record $1.0T+ | — | Deficit |
| CPI Inflation | -0.1% (deflation) | 3.2% | 2.8% |
China’s trade surplus hit a record in 2025, exceeding $1 trillion for the first time — a figure that Bloomberg describes as “causing damage to others,” a diplomatic way of saying that Beijing is effectively exporting its demand deficiency to the rest of the world.
The Deflation Trap and the Property Bust
Persistent deflation — consumer prices have been flat to negative for much of the past two years — is the canary in China’s economic coal mine. It signals that domestic demand is chronically insufficient to absorb the output of a $19 trillion economy operating at high industrial utilization. The property sector, which once contributed around 25–30% of GDP activity directly and indirectly, remains in a protracted bust. Evergrande’s collapse was the headline; the structural overhang of unsold housing inventory and developer debt is the slow-motion crisis that followed.
The IMF’s Article IV report urges Beijing to prioritize consumption-led rebalancing and rein in industrial policy. Specifically, it calls for reducing industrial subsidies from approximately 4% of GDP to 2% — a halving that would represent one of the largest policy pivots in modern economic history. The 15th Five-Year Plan (2026–2030) does gesture toward consumption promotion, but the mechanisms remain supply-side in character: subsidies for consumer goods, rather than the structural income redistribution or social safety net expansion that would organically lift household spending.
The Yuan Question
The Economist’s analysis of the IMF’s findings highlights a conclusion that Beijing will find particularly galling: the yuan is undervalued by approximately 16% on a real effective exchange rate basis. An undervalued currency functions as a permanent subsidy to exporters — one that doesn’t appear on any government balance sheet but is felt acutely by manufacturers in Vietnam, Mexico, Germany, and Ohio. For the Trump administration, which has built a political identity around trade grievances, this figure is rhetorical gold.
The IMF’s Prescriptions: Technically Sound, Politically Inert
What the IMF Is Actually Saying
The Fund’s recommendations are, in technical terms, coherent: reduce fiscal support for state-owned enterprises and export industries, accelerate social spending to reduce the precautionary savings motive, allow more exchange rate flexibility, and restructure the property sector decisively. The LA Times summarizes the IMF’s core concern bluntly — China’s economic model is hurting the global economy, not just China’s long-term prospects.
These are not wrong observations. The problem is that every one of these reforms involves redistribution of economic and political power within China — from state enterprises to private firms, from coastal manufacturers to inland consumers, from the Communist Party’s industrial policy apparatus to market mechanisms. The IMF can write reports; it cannot rewrite Chinese political economy.
Why China Won’t Simply Comply
Beijing’s resistance to IMF prescriptions is not mere stubbornness. Chinese policymakers remember clearly what happened to countries that took Washington Consensus advice during the 1990s — the capital account liberalizations that preceded financial crises, the austerity packages that deepened recessions, the privatizations that enriched oligarchs. The IMF’s track record in East Asia is not an abstraction in Chinese policy circles; it is a cautionary tale taught in economics departments from Beijing to Shanghai.
There is also a nationalist dimension that the IMF’s technocratic language tends to elide. Xi Jinping’s government has staked considerable political capital on the idea that China’s development model represents an alternative to Western-prescribed orthodoxy. Adopting IMF recommendations wholesale would be read domestically — and internationally — as ideological capitulation.
Global Spillovers: When China Sneezes, Everyone Gets a Cold (and a Surplus)
China’s export model risks are no longer a theoretical concern for trading partners — they are arriving as factory closures in Germany, price pressures on Southeast Asian manufacturers, and renewed trade litigation at a World Trade Organization that itself barely functions anymore. The IMF China economy 2026 analysis identifies three primary channels of global transmission:
1. Deflationary pressure exports. Chinese manufacturers, operating with overcapacity subsidized by state support, price aggressively in global markets. This compresses margins for competitors and pushes traded goods prices lower worldwide — welcome for consumers, destructive for competing industries.
2. Demand vacuum. An economy of China’s size that systematically under-consumes imports relative to its income level creates a structural deficit in global demand. Every dollar China saves rather than spends is a dollar not circulating through the global economy.
3. Financial contagion risk. The unresolved property sector crisis and local government debt overhang represent tail risks that, if they crystallize, would transmit rapidly through commodity markets, emerging market capital flows, and supply chains.
The irony of the current moment is that the Trump administration’s tariff regime — designed to punish China for precisely these imbalances — is itself a form of global demand destruction, reducing trade volumes that would otherwise partially compensate for China’s domestic demand shortfall. Two forms of economic nationalism are colliding, and the multilateral institutions that might once have mediated the conflict have neither the credibility nor the authority to do so effectively.
The IMF’s Credibility Crisis: History as the Elephant in the Room
A Track Record That Haunts
No honest assessment of IMF China criticism can ignore the institution’s own ideological history. The 1997–98 Asian financial crisis demonstrated with brutal clarity what happens when the IMF’s capital account liberalization agenda meets economies that lack the institutional infrastructure to manage hot money flows. Thailand, Indonesia, South Korea — countries that had followed broadly orthodox policies — were subjected to punishing conditionality packages that deepened recessions and imposed social costs on populations who had not caused the crisis.
The Fund’s pre-2008 surveillance missed the systemic risks building in advanced economy financial systems — the very economies whose regulatory models the IMF had spent decades urging developing countries to emulate. The IMF’s own Independent Evaluation Office has published assessments acknowledging these failures, which is admirably self-aware and almost entirely without consequence for the institution’s behavior.
Obsolescence in the Trump Era
The IMF’s credibility crisis in the current moment is compounded by structural irrelevance. The Trump administration has made clear that it views multilateral institutions primarily as instruments of American foreign policy when useful and obstacles when inconvenient. The geopolitical fracturing of the global economy — into loose dollar-bloc, yuan-adjacent, and non-aligned zones — means that IMF prescriptions land differently depending on where you sit. For countries facing U.S. secondary sanctions for trading with China, IMF advice about “rebalancing global demand” reads as detached from geopolitical reality.
China’s subsidies reduction IMF demands also face a structural hypocrisy problem: the United States’ Inflation Reduction Act, the CHIPS Act, and a range of Buy American provisions constitute industrial policy on a scale that, if implemented by a developing country, would trigger IMF condemnation. When Washington lectures Beijing on industrial subsidies while simultaneously subsidizing its own semiconductor and electric vehicle industries, the argument loses moral force even if it retains technical validity.
Analysis: Right Diagnosis, Wrong Doctor
The uncomfortable synthesis here is this: the IMF’s analysis of China’s economic model risks is substantively correct. An economy that relies on investment and exports while suppressing consumption is inherently prone to overcapacity, deflationary spirals, and trade conflict. Without meaningful reform — income redistribution, social safety net expansion, property sector resolution — China faces a long Japanese-style stagnation scenario, but with a lower income base and a more complex geopolitical environment.
But the IMF delivering this message carries the credibility of a reformed alcoholic dispensing sobriety advice: the underlying argument may be sound, the messenger’s authority is compromised. Beijing’s resistance is partly self-serving nationalism and partly legitimate institutional skepticism earned through bitter historical experience.
The deeper problem is that in a fractured global economy, there is no neutral referee. The institutions designed to manage global economic interdependence — the IMF, WTO, World Bank — were built on assumptions of broadly shared commitment to open markets and rules-based order that the Trump era has conclusively demonstrated were always more fragile than advertised.
Conclusion: A Fractured World With No Referee
The IMF’s February 2026 rebuke of China is significant not because it will change Chinese policy — it almost certainly won’t — but because it illuminates the central paradox of global economic governance in this moment. The world needs coordination on China’s imbalances; the institution designed to provide that coordination lacks the authority to compel it; and the geopolitical environment makes voluntary compliance politically impossible.
China’s export-led growth model is unsustainable. The IMF is correct about that. But IMF credibility crisis conditions mean the messenger may accelerate the very defensiveness that prevents reform. And the Trump administration’s tariff response, whatever its political rationale, is as likely to entrench China’s overcapacity problem as resolve it — manufacturers with nowhere to export domestically will find third-country routes, or compete even more aggressively on price.
The fractured global economy needs new frameworks for managing the China imbalance question: bilateral negotiations with more credibility than IMF pressure, G20 coordination that includes Beijing as a genuine partner rather than a defendant, and — most fundamentally — a willingness among all major economies to examine their own growth model distortions before prescribing remedies to others.
The question worth sitting with: In a world where every major economy practices some form of industrial policy and none trusts multilateral institutions, who exactly has the standing to tell China what to do — and more importantly, what leverage do they have to make it matter?
Discover more from The Economy
Subscribe to get the latest posts sent to your email.
-

 Markets & Finance2 months ago
Top 15 Stocks for Investment in 2026 in PSX: Your Complete Guide to Pakistan’s Best Investment Opportunities
-

 Analysis3 weeks ago
Brazil’s Rare Earth Race: US, EU, and China Compete for Critical Minerals as Tensions Rise
-

 Investment2 months ago
Top 10 Mutual Fund Managers in Pakistan for Investment in 2026: A Comprehensive Guide for Optimal Returns
-

 Banks1 month ago
Best Investments in Pakistan 2026: Top 10 Low-Price Shares and Long-Term Picks for the PSX
-

 Asia2 months ago
China’s 50% Domestic Equipment Rule: The Semiconductor Mandate Reshaping Global Tech
-

 Global Economy2 months ago
What the U.S. Attack on Venezuela Could Mean for Oil and Canadian Crude Exports: The Economic Impact
-

 Global Economy2 months ago
Pakistan’s Export Goldmine: 10 Game-Changing Markets Where Pakistani Businesses Are Winning Big in 2025
-

 Global Economy2 months ago
15 Most Lucrative Sectors for Investment in Pakistan: A 2025 Data-Driven Analysis