
China Economy
China Economy 2026: Semiconductor Surge, Weak Consumption, and the Rebalancing Trap

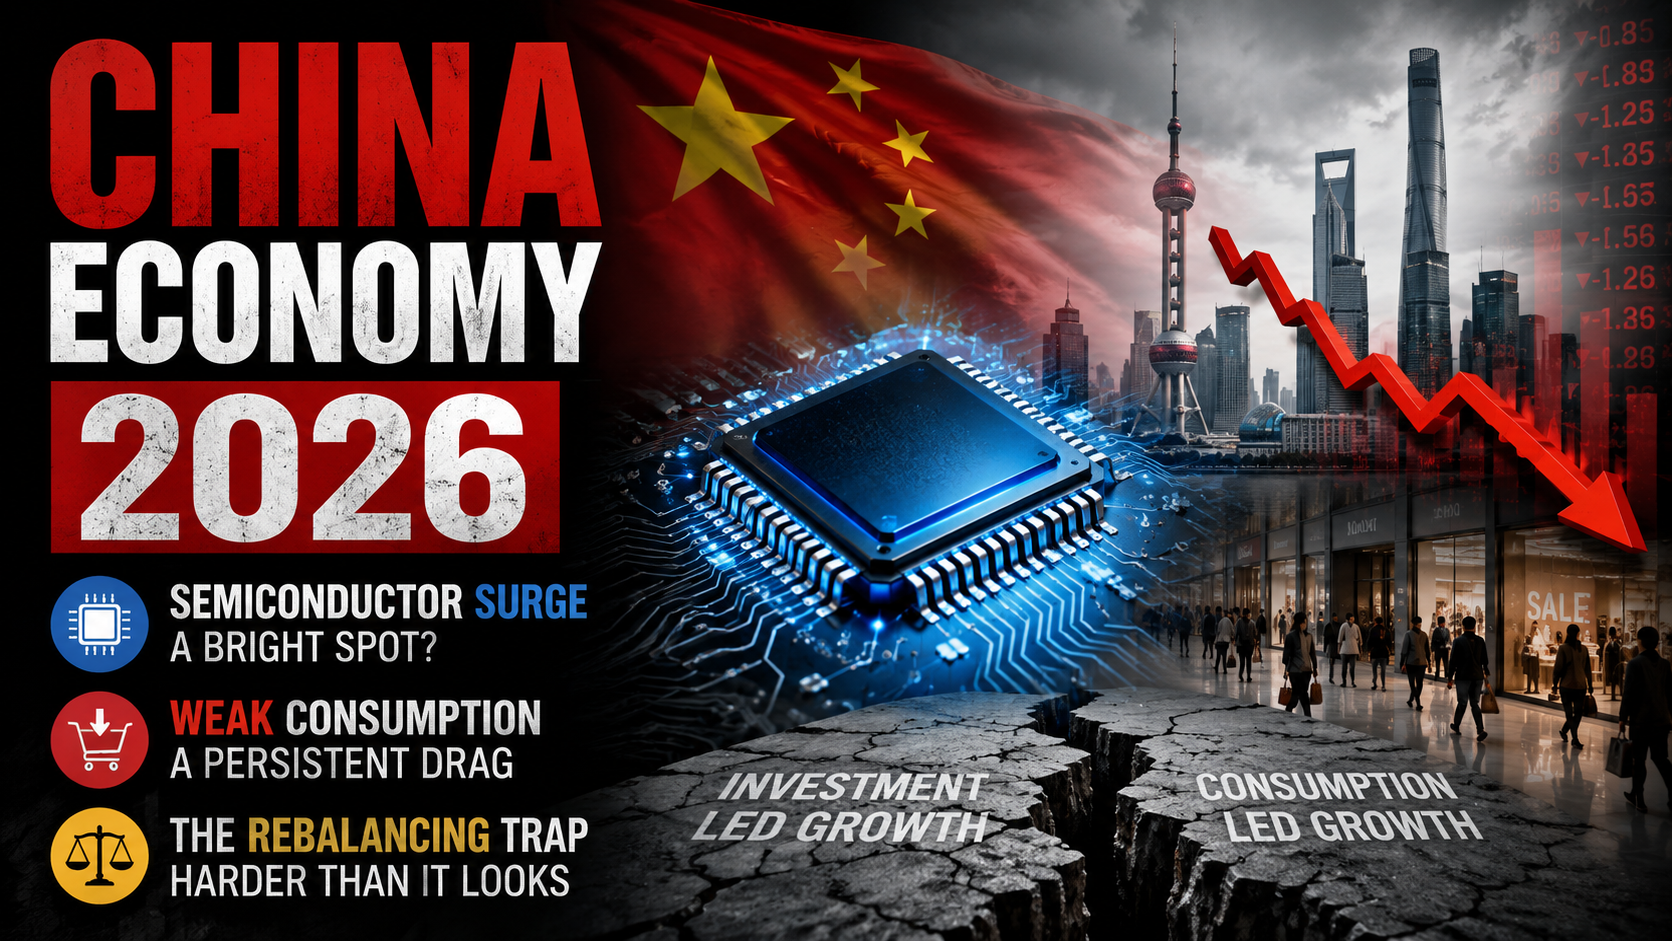
China’s semiconductor exports surged 87% in May 2026 even as retail sales stagnated and property investment fell 16%. Inside the structural divergence threatening Beijing’s growth model.A single statistic from China’s May 2026 industrial output report captures the country’s economic condition better than any official growth headline: semiconductor production surged 87% year-on-year, even as retail sales remained muted and property investment fell at its steepest rate since the pandemic. The gap between China’s industrial machine and its domestic consumption economy has never been wider. And unlike earlier cycles, there is no obvious policy lever that closes it quickly.
China officially reported 5.0% GDP growth in Q1 2026, but the US-China Economic and Security Review Commission and independent economists identified three reasons for scepticism: ongoing downward revisions to prior-year numbers, a statistical rebound effect, and the absence of genuine domestic demand recovery. The government’s own fiscal deficit target of 4% of GDP — the highest since 1991 and set in the 15th Five-Year Plan passed at the March “Two Sessions” — implies that official growth is being propped by state investment rather than organic household consumption.
The Export Machine: Strength Built on Structural Weakness
China’s trade surplus in 2025 crossed $1.2 trillion — a record — and the export surge has continued in 2026. In May, exports denominated in US dollars rose 19.6% year-on-year, the second-largest increase since early 2022. Semiconductor exports rose 110%. Mobile phone exports rose 44%. Auto parts and computing hardware rose 66%.
The IMF estimated in early 2026 that the renminbi was undervalued by 16%, and pressed Beijing to allow revaluation to reduce the trade imbalance. China demurred, pledging only that the currency would remain “generally stable.” Meanwhile, China’s passenger car exports rose 60.6% year-on-year in Q1 — many of them cheaper models subsidised into foreign markets after Beijing’s “anti-involution” policy created domestic oversupply. Developing markets bore the brunt: the US-China Economic and Security Review Commission documented a 14% surge in “China Shock 2.0” export pressure on emerging economies.
But the export machine’s strength is inseparable from the domestic market’s weakness. When local demand softens, manufacturers redirect capacity toward international markets. The result is not a virtuous cycle of industrial upgrading; it is a pressure valve that delays, but does not resolve, the underlying consumption deficit.
The Consumption Deficit: Property, Wealth, and Japanification
Roughly two-thirds of Chinese household wealth is held in the form of property. The ongoing correction in that market is therefore not merely a sectoral issue — it is a household balance sheet crisis that suppresses the propensity to consume across the entire economy. Fixed-asset investment fell 4.1% in the first five months of 2026 year-on-year — the steepest decline since May 2020. Property investment dropped 16.2%. Government stimulation efforts — trade-in subsidies for EVs and appliances, value-added tax rebates — have produced modest and temporary retail bounces without addressing the underlying confidence deficit.
Mao Zhenhua, a professor at the University of Hong Kong, put it plainly: “Apart from high-tech and export sectors, the Chinese economy is very cold.” The producer price index has fallen for 41 consecutive months since October 2022 — a textbook sign of deflationary overcapacity. Some economists describe this as “Japanification”: prolonged deflation, declining investment returns, and a debt overhang — except that China’s greater dependence on real estate, local government financing vehicles, and exports makes the structural comparison more severe than Japan’s experience from the 1990s.
The Semiconductor Bet: Strategic Necessity and Competitive Exposure
Beijing’s response to the consumption deficit is to accelerate investment in industries deemed strategically vital: semiconductors, AI, electric vehicles, batteries, and green energy. The 15th Five-Year Plan explicitly frames this as building “New Quality Production Forces” — a move away from cheap manufactured goods toward technological self-sufficiency.
Progress is real but uneven. SMIC and Hua Hong are advancing at mature-node chip production, used in vehicles and industrial equipment. Equipment vendors Naura and AMEC are gaining global market share in manufacturing tools. Tungsten — a chipmaking input China controls at 79% of global mine production — has seen export controls imposed, pushing tungsten prices up 557% in just over a year.
Yet China imported a record $135 billion in semiconductors in a single quarter, driven by surging AI investment. Dependency on advanced foreign chips — particularly Nvidia’s H200 GPUs — remains acute. The path to true semiconductor self-sufficiency runs through advanced lithography technology that China has not yet replicated, and through memory chip manufacturing where domestic producer CXMT is still racing to achieve viable high-bandwidth memory yields.
The Rebalancing Trap
The structural paradox Beijing faces is that the industries it is investing in to generate new growth — semiconductors, AI, renewable energy — are highly capital-intensive and relatively employment-light. They generate industrial output and export revenue. They do not, by themselves, create the mass consumer purchasing power needed to rebalance toward domestic demand. As the Asia Society Policy Institute has documented, China’s capital-intensive industrial push could widen income inequality even as it advances national technological capacity, leaving the rural and lower-income population increasingly detached from the growth being generated.
Until Chinese households recover confidence in property as a store of value, until youth unemployment — officially 17% but widely estimated closer to 40% by independent economists — materially declines, and until local government debt overhangs are resolved, the consumer-led rebalancing that global markets have been anticipating for a decade will remain deferred.
The world’s second-largest economy, in 2026, is a machine that produces extraordinary technology and exports it to a world not fully ready to absorb the volume — while the domestic audience watches from the sidelines.
Discover more from The Economy
Subscribe to get the latest posts sent to your email.



China’s maritime manufacturing ecosystem has reached a historic apex. According to official industry metrics compiled by the Ministry of Industry and Information Technology (MIIT), Chinese shipbuilders secured 81.8% of all global new shipbuilding orders measured by deadweight tonnage (DWT) during the January–September period.
This milestone reflects an unprecedented consolidation of global commercial sea power. Concurrently, China’s yards completed 58.05 million DWT in ship construction—a 50.7% year-on-year surge—capturing 63.6% of global vessel deliveries. The nation’s cumulative order backlog expanded to 399.13 million DWT (+64.8% YoY), representing 72.4% of all global backlogged tonnage.
                     GLOBAL SHIPBUILDING MARKET SHARE
                   ┌───────────────────────────────────┐
  New Ship Orders  │ [China: 81.8%]           [Rest: 18.2%] │
                   ├───────────────────────────────────┤
  Completed Tonnage│ [China: 63.6%]         [Rest: 36.4%]   │
                   ├───────────────────────────────────┤
  Order Backlog    │ [China: 72.4%]       [Rest: 27.6%]     │
                   └───────────────────────────────────┘
1. Structural Catalysts Behind China’s Market Monopoly
China’s dominance is built on structural advantages that competitors in East Asia and the West struggle to replicate.
┌─────────────────────────────────────────────────────────────────────────┐
│                      CHINA'S SHIPBUILDING FLYWHEEL                      │
│                                                                         │
│  [ Upstream Raw Materials ]  ──►  [ Integrated Shipyard Infrastructure ] │
│  (Domestic Steel & Components)   (State-backed Mega-docks & Digitalization) │
│               ▲                                        │                │
│               │                                        ▼                │
│  [ Scale & Backlog Expansion ] ◄──  [ Global Fleet Order Dominance ]    │
│    (399M DWT Reserve Capacity)    (Container, LNG & Dual-Fuel Vessels) │
└─────────────────────────────────────────────────────────────────────────┘
Integrated Domestic Supply Chains & Raw Material Synergies
Unlike European or American yards that rely on fragmented international supply chains, Chinese shipbuilders benefit from a fully domestic industrial ecosystem. China’s domestic steel industry produces marine-grade steel plate at scale, minimizing lead times and protecting yards from global freight rate swings.
Mega-Yard Scale and Modular Fabrication
State-backed groups like China State Shipbuilding Corporation (CSSC) operate mega-shipyards equipped with gantry cranes capable of lifting thousands of tons. Advanced modular block construction techniques allow yards in Jiangsu, Shanghai, and Shandong to build multiple ultra-large vessels simultaneously.
2. Moving Up the Value Chain: Beyond Bulk Carriers
Historically, Chinese yards dominated low-margin dry bulk carriers and basic oil tankers. Today, the industry has shifted toward high-technology, eco-friendly ships.
| Vessel Category | Primary Yards / Locations | Strategic Market Focus | Key Structural Drivers |
| LNG & Dual-Fuel Carriers | Jiangnan Shipyard, Hudong-Zhonghua | Clean energy transit, green corridors | High-tech membrane containment tanks |
| Ultra-Large Container Ships (ULCS) | Yangzijiang Shipbuilding, Waigaoqiao | Global liner network efficiency | Scale efficiencies, dual-fuel propulsion engines |
| Pure Car and Truck Carriers (PCTC) | Merchants Heavy Industry, Jinling | Automotive export expansion | Surge in Chinese electric vehicle (EV) exports |
Analysis published by maritime market intelligence groups at BIMCO demonstrates that green dual-fuel vessel contracting now accounts for a record percentage of global orderbooks. Chinese yards have secured key contracts in LNG, methanol, and ammonia-ready ship classes, breaking the historic Korean monopoly on complex gas carriers.
3. Global Geopolitical Implications and Trade Friction
China’s rapid consolidation of commercial shipbuilding capacity has created geopolitical friction across the Western hemisphere.
  ┌─────────────────────────────────────────────────────────────────┐
  │                    GLOBAL TRADE & POLICY TENSIONS               │
  ├─────────────────────────────────┬───────────────────────────────┤
  │ US Trade & Regulatory Policy    │ European Maritime Response    │
  ├─────────────────────────────────┼───────────────────────────────┤
  │ • Section 301 Maritime Enquiries│ • Net-Zero Industry Act Targets│
  │ • Proposed Chinese Port Fees    │ • Subsidized Green Retrofits  │
  │ • Naval Fleet Capacity Audits   │ • Supply-Chain Security Mandates│
  └─────────────────────────────────┴───────────────────────────────┘
U.S. Regulatory Countermeasures and Section 301 Actions
The U.S. Trade Representative (USTR) and maritime regulatory bodies have scrutinized Chinese state support in the shipbuilding sector. Proposed measures—including port fees on Chinese-built vessels calling at American ports—aim to offset perceived cost advantages. However, industry analysts note these fees could raise consumer import costs given the lack of domestic US commercial alternatives.
Divergence in Allied Shipbuilding Capabilities
While China maintains a commercial backlog of nearly 400 million DWT, Western shipyards handle less than 2% of international commercial tonnage. Regional players in Japan and South Korea continue to specialize in niche high-value designs, but face capacity constraints, aging labor forces, and higher structural overhead compared to Chinese shipbuilders.
Strategic Outlook (2026–2030)
China’s dominance in commercial shipbuilding provides a foundation for long-term maritime industrial capacity. Backlog deliveries extending into 2028 and 2029 ensure high yard utilization rates even if global order velocity cools. As international decarbonization standards tighten under IMO mandates, China’s capacity to construct next-generation green vessels position it to maintain control of the world’s commercial fleet production.
Discover more from The Economy
Subscribe to get the latest posts sent to your email.
Executive Summary
- Trade Truce Extension: Washington and Beijing extended the Busan economic truce by two months to January 10, 2027, establishing a bilateral Board of Trade mechanism with a $30 billion cap on tariff reductions for non-sensitive goods.
- Taiwan Policy Stance: President Xi Jinping pressed the U.S. administration to shift from “not supporting” to explicitly “opposing” Taiwan independence, while a U.S. $14 billion arms package to Taipei remains on hold.
- AI & Governance Divergence: Trump advocated for minimal federal AI regulation relying on existing legal channels, whereas Xi emphasized international norm-setting and human-controlled AI governance.
- Conflict Prevention: Both leaders highlighted shared WWII historical ties, but underlying systemic friction over technology controls and critical supply chains remains unhedged.
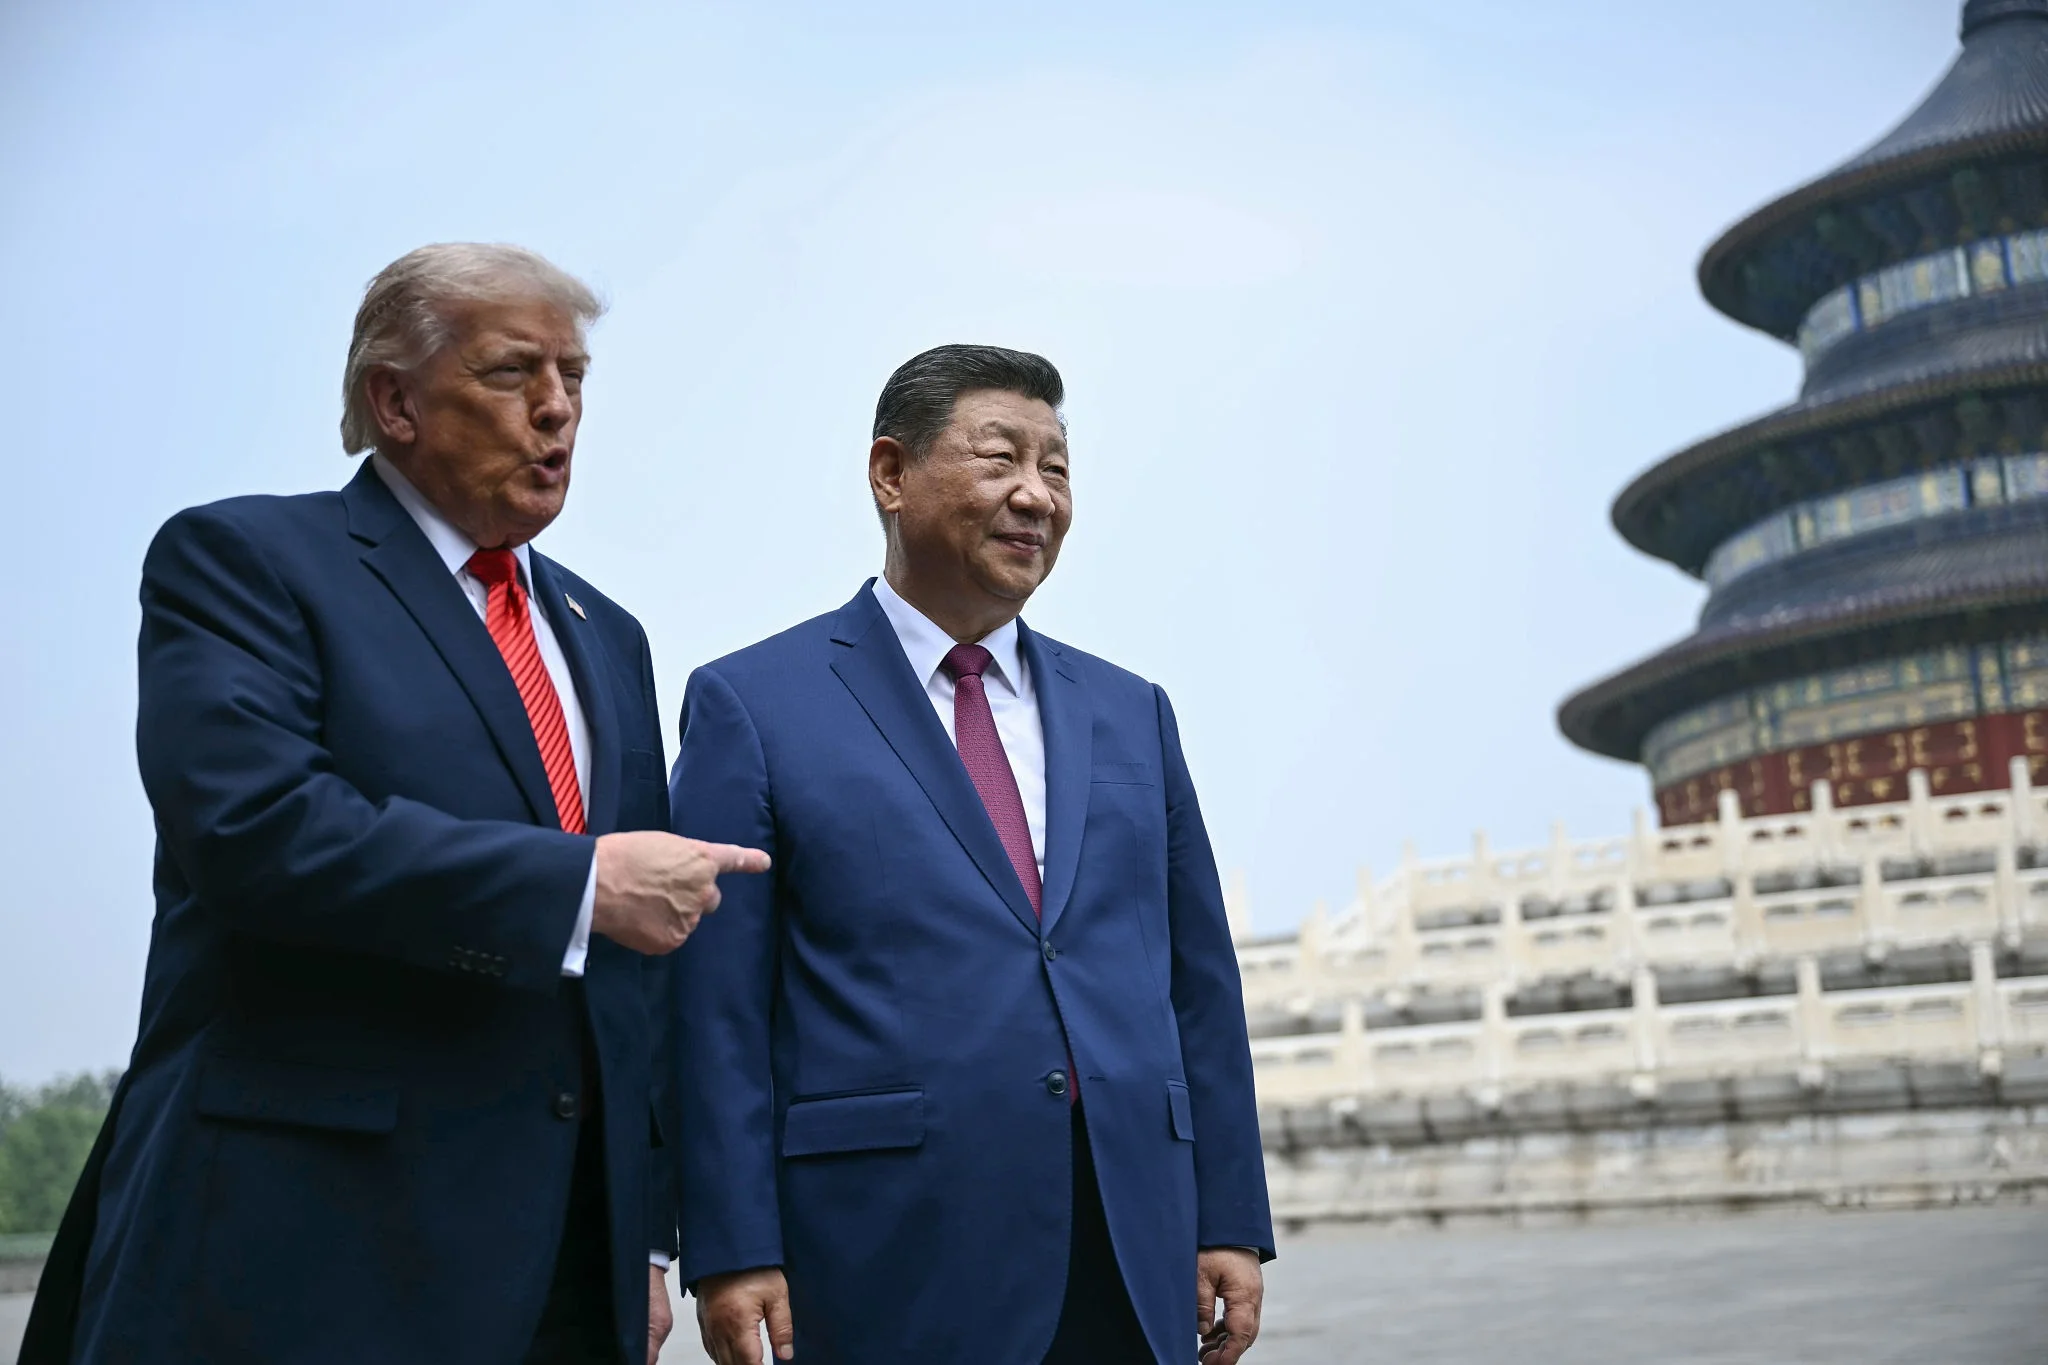
Presidents Xi Jinping and Donald Trump met in Washington, D.C., marking President Xi’s first official state visit to the United States in over a decade. The 43-hour diplomatic engagement combined high-profile ceremonial gestures with intense negotiations over economic policy, regional security, and emerging technologies.
1. Trade Deliverables & Managed Economic Detente
The core economic outcome of the summit was a mutual decision to extend the trade truce originating from the Busan agreements by an additional two months, pushing the negotiation window to January 10, 2027. According to analysis published by The Business Times, this temporal buffer buys critical space for both economies to formalize structured frameworks before political shifts take hold following the U.S. midterm elections.
Key Economic Components:
- Board of Trade Framework: Establishing a structured mechanism to oversee managed bilateral commerce.
- Tariff Cap Reductions: A planned mutual tariff reduction capped at US$30 billion per side, targeting non-sensitive consumer and industrial goods.
- Agricultural Commitments: China continues to meet its baseline commitments for purchasing 25 million metric tons of U.S. soybeans.
However, friction points persist below the surface. U.S. trade officials noted that Beijing remains behind on its broader pledge to purchase $17 billion in other U.S. agricultural exports. Furthermore, delivery quotas for critical rare-earth elements—essential for high-tech manufacturing—have fallen short of target allocations. As detailed by the Chicago Council on Global Affairs, reliance on personalistic leader-to-leader negotiations creates short-term pauses but leaves structural trade imbalances and supply chain dependencies unaddressed.
2. The Taiwan Question & Strategic Security
Diplomatic maneuvering over Taiwan represented the most sensitive geopolitical dynamic of the summit. President Xi reiterated Beijing’s core stance, urging Washington to handle the Taiwan issue with “extreme prudence” and asking the U.S. to actively oppose Taiwan independence rather than maintaining its traditional diplomatic posture of simply “not supporting” it.
Strategic assessments from the Institute for the Study of War indicate that Beijing views the current economic detente as a key window to influence U.S. security commitments in the Indo-Pacific. A planned U.S. $14 billion arms transfer package to Taiwan remains paused, delivering a tactical diplomatic win for Beijing ahead of upcoming multilateral regional gatherings.
3. Divergent Visions on AI Governance & High-Tech Competition
The summit exposed contrasting philosophies regarding the regulation of Artificial Intelligence and advanced computing capabilities. While both leaders acknowledged AI’s transformative influence on global power balances, their proposed paths forward reflect fundamental governance differences.
| Dimension | United States Stance | China Stance |
| Regulatory Model | Market-driven with minimal federal intervention; oversight through existing DOJ frameworks. | State-directed guardrails emphasizing central oversight and alignment with national strategy. |
| Global Governance | Defense of competitive edge and strict export controls on advanced hardware. | Multilateral norm-setting under international organizations (“AI for Good”). |
| Core Objective | Commercial freedom, innovation velocity, and technological superiority. | Human control, risk mitigation, and preventing technological decoupling. |
Reporting from The Federal highlighted that while Xi urged joint international responsibility to ensure AI remains under human control, the U.S. side favored preserving flexibility for domestic technological developers without introducing international regulatory mechanisms.
4. “Thucydides Trap” Avoidance & Strategic Guardrails
Throughout the summit, President Xi repeatedly warned against falling into the “Thucydides Trap”—the historical tendency toward conflict when a rising power challenges an established power. Calling for “constructive strategic stability,” Xi emphasized that global competition should resemble a “race of catching up with one another, not a wrestle in which one wins and the other loses.”
Institutional Takeaways:
- Regular Military Communications: Reaffirming bilateral crisis-prevention channels to prevent miscalculations in air and maritime corridors.
- Historical Commemoration: Leveraging shared World War II history during visits to national monuments to emphasize foundational ties.
- Corporate Engagement: Hosting state dinners with executive leadership to reinforce commercial interdependencies as a stabilizing buffer.
Strategic Outlook
While the 43-hour Washington summit succeeded in projecting stability and securing short-term economic extensions, fundamental strategic competition remains unresolved. The coming months will test whether temporary trade truces and managed tariff caps can withstand broader geopolitical rivalries in technology supply chains, semiconductor export policies, and Pacific security dynamics.
Discover more from The Economy
Subscribe to get the latest posts sent to your email.
China Economy
China’s Local Debt Race Against Time: Why Economists Demand Central Action Before the Deflation Window Closes
Key Policy Takeaways
- The Fiscal Dilemma: China’s local government hidden debt (off-balance-sheet LGFV liabilities) is estimated by the International Monetary Fund (IMF) to exceed 60 trillion yuan (~US$8.4 trillion).
- The Vanishing Window: Ultra-low benchmark interest rates and weak price indices offer Beijing an ideal window to swap high-cost, short-duration local liabilities for long-duration central sovereign bonds.
- The Risk of Delay: Waiting until inflation rebounds or global monetary policy tightens will significantly increase debt-servicing burdens and squeeze commercial bank margins.
- Structural Reform Needed: Refinancing alone is insufficient; Beijing must overhaul central-local tax distribution to prevent new hidden debts from accumulating.
1. The Perishable Window: Why Low Inflation Is a Double-Edged Sword
Prominent Chinese economic advisors are urging Beijing to capitalize on the country’s prevailing low-interest and soft-price environment to execute a comprehensive debt restructuring. According to research from the World Bank, China’s subdued consumer and producer price trends have created a rare, temporary period where sovereign issuance can be expanded with minimal immediate risk of runaway inflation or surging debt-servicing yields.
When price levels and market borrowing rates are low, the cost of issuing special central government bonds (Treasuries) is at historical troughs. By leveraging this environment, Beijing can absorb or refinance high-yield municipal obligations at fractions of their original servicing cost.
However, macroeconomists warn that this window is shrinking:
[Low Inflation & Low Yields] ──► [Lower Sovereign Issuance Costs] ──► [Ideal Debt Swap Window]
          │                                                                  │
          ▼ (If Delayed)                                                     ▼ (If Executed Now)
[Erosion of Local Revenues] ──► [Rising Default & Credit Risks]   ──► [Restored Fiscal Flexibility]
If Beijing delays central balance-sheet expansion, prolonged deflation risks further eroding local government tax revenues and land sales proceeds. Analysis from S&P Global Market Intelligence indicates that land sales revenues—historically accounting for up to 30% of municipal fiscal funds—have dropped significantly from their peak levels, leaving local authorities without the primary engine used to service off-balance-sheet vehicles.
2. The LGFV Mechanics: How Hidden Debt Stalls Regional Growth
The root of China’s fiscal challenge lies in Local Government Financing Vehicles (LGFVs)—special entities created by provinces and cities to finance public infrastructure without officially breaching central deficit caps.
The Anatomy of China’s Municipal Balance Sheet
- Official Municipal Debt: Directly tracked bonds subject to strict quota limits set by the National People’s Congress.
- Implicit / Hidden LGFV Debt: High-cost, off-balance-sheet bank loans, corporate bonds, and shadow banking products carrying implicit guarantees but yielding insufficient commercial returns.
As highlighted in a macroeconomic study by the Peterson Institute for International Economics (PIIE), when local debt-servicing costs outpace local economic growth, municipal governments are forced into fiscal austerity. This results in delayed civil service pay, cuts to public transit subsidies, and reduced local procurement—directly depressing domestic demand and compounding broader deflationary pressures.
3. The “Involution” Loop: Price Wars and Subsidized Capacity
A critical dynamic overlooked in conventional coverage is how local debt fuels industrial “involution” (内卷)—cutthroat, race-to-the-bottom price competition.
Faced with declining traditional tax revenues and mounting debt obligations, regional authorities frequently use local subsidies, cheap land allocation, and state-directed credit to prop up favored local manufacturing sectors (such as solar components, EV parts, and industrial chemicals).
┌────────────────────────────────────────────────────────────────────────┐
│                        THE INVOLUTION CYCLE                            │
├────────────────────────────────────────────────────────────────────────┤
│ 1. Local Debt Pressure  ──► Municipalities seek fast industrial GDP    │
│ 2. Target Subsidies     ──► Directed capital into local manufacturing  │
│ 3. Industrial Overcap   ──► Manufacturers overproduce to maintain scale  │
│ 4. Price Wars (CPI/PPI) ──► Deflationary pressure squeezes margins     │
│ 5. Lower Tax Revenues   ──► Debt burden expands relative to revenue    │
└────────────────────────────────────────────────────────────────────────┘
According to sector reporting from Rhodium Group, this localized credit allocation keeps unproductive firms afloat, floods domestic markets with overcapacity, and drives price deflation across industrial outputs. To break this loop, economists argue that Beijing must restrict local industrial subsidies while substituting them with direct central transfers to households.
4. Policy Roadmap: How Beijing Can Safely De-Risk Local Liabilities
To outperform past partial debt swaps, top financial experts recommend a coordinated four-point execution plan:
| Strategic Pillar | Action Item | Target Economic Outcome |
| 1. Central Balance Sheet Expansion | Issue Ultra-Long Special Sovereign Bonds to swap LGFV debt into central debt. | Reduces aggregate interest payments by hundreds of billions of yuan annually. |
| 2. Commercial Bank Shielding | Structure interest rate cuts alongside targeted PBoC liquidity injections. | Protects bank Net Interest Margins (NIMs) from lower bond yields. |
| 3. Tax Revenue Sharing Reform | Rebalance the 1994 tax-sharing system to allocate a higher tax share to local authorities. | Permanently aligns municipal spending obligations with recurring revenue. |
| 4. Consumption-Focused Stimulus | Shift state expenditures from physical infrastructure to social security, healthcare, and income support. | Unlocks household savings and drives organic demand-led reflation. |
Reports from the Organisation for Economic Co-operation and Development (OECD) emphasize that structural fiscal reform—specifically updating the distribution of revenues between Beijing and provincial capitals—is necessary to prevent local governments from simply building new hidden debt after the current swap is completed.
5. Global Implications for Investors and Markets
For international markets, China’s decision to act decisively on local debt carries substantial weight:
- Commodity & Global Demand: Restructuring local debt allows municipalities to resume core public works and social spending, stabilizing demand for global industrial metals and capital equipment, as monitored by the Asian Development Bank.
- Currency and Yield Dynamics: As noted by analysis in the Financial Times and market coverage in Bloomberg News, a central government debt swap reduces tail-risk in China’s financial sector, offering long-term stability for the Renminbi (RMB) even as benchmark rates remain low.
- Banking Sector Relief: Replacing non-performing or low-yielding LGFV loans with sovereign-backed paper lowers credit risk weights for state banks, preserving regulatory capital buffers across the broader financial system.
Discover more from The Economy
Subscribe to get the latest posts sent to your email.

Can Global Tourism Survive Geopolitical Shocks?

Global Maritime Hegemony: How China Secured Over 81% of All New Shipbuilding Orders

The Coming Battle Over AI, Jobs and Wages

Why Developing Economies Face a Sharper Inflation Problem

The New Geography of Trade: Are Supply Chains Coming Home?

Is AI Saving Global Growth or Creating the Next Bubble?

Global Banking Trends 2026: Digital Banks, AI and Compliance

Gold vs US Dollar vs Bitcoin in 2026: Inflation Hedge Compared

How Global Interest Rates Affect Savings, Loans and Investments

How to Invest During High Inflation: A Global Guide

Best Global Stocks to Watch in 2026: Four Sectors to Research

Pakistan’s 2027 Growth Strategy: Exports, AI, Energy and Jobs

Pakistan Economy FY2027: IMF Reform, Debt and Recovery Outlook

Global Interest Rates 2027: Risks for Pakistan’s Rupee and Debt

Crude Oil & Petroleum Market Analysis: OPEC+ Decisions and Price Forecasts

World’s Largest Economies: Ranking the Top Global Powers

Silver Price Today: Why the Xi-Trump AI Standoff Is Fueling a Safe-Haven Rally

Algorithmic Dogfights: Why the U.S. and China Must Establish Rules of Engagement for Autonomous Air Power

Top US Convenience Store Chains: Store Counts, EV Charging, and Sales Trends

SpaceX IPO 2026: History’s Biggest Stock Debut?

Who Is Shivon Zilis? The Neuralink Executive at the Center of the Musk–OpenAI Trial

Corporate America Faces a New Debt Test as US Borrowing Costs Surge

Global Economic Outlook 2026: 7 Forces Reshaping Markets, Trade and Business

Business Insurance: What Coverage You Actually Need and What It Costs in 2026

Social Security Extra $90 Deposit: Who Qualifies for the October 2026 Medicare Rebate?

US 10-Year Yield Hits 5.24%: What the Historic Bond Market Sell off Means for Mortgages and Investors

Gold Falls 3.7% as Yields Surge: Is Gold Still a Safe Haven in 2026?

Stock Market Today: Dow, S&P 500, and Nasdaq Retreat as Treasury Yields
-

 Markets & Finance10 months ago
Top 15 Stocks for Investment in 2026 in PSX: Your Complete Guide to Pakistan’s Best Investment Opportunities
-

 Analysis8 months ago
Johor’s Investment Boom: The Hidden Costs Behind Malaysia’s Most Ambitious Economic Surge
-

 Analysis8 months ago
Top 10 Stocks for Investment in PSX for Quick Returns in 2026
-

 Banks9 months ago
Best Investments in Pakistan 2026: Top 10 Low-Price Shares and Long-Term Picks for the PSX
-

 Analysis9 months ago
Brazil’s Rare Earth Race: US, EU, and China Compete for Critical Minerals as Tensions Rise
-

 Investment9 months ago
Top 10 Mutual Fund Managers in Pakistan for Investment in 2026: A Comprehensive Guide for Optimal Returns
-

 Global Economy10 months ago
15 Most Lucrative Sectors for Investment in Pakistan: A 2025 Data-Driven Analysis
-

 Global Economy10 months ago
Pakistan’s Export Goldmine: 10 Game-Changing Markets Where Pakistani Businesses Are Winning Big in 2025