
Oil Markets
Dropping Oil & Surging Gold: Navigating Safe-Haven Investments in Q3


Gold traded above $4,500 an ounce in mid-to-late August 2026, marking a third consecutive weekly gain, while oil continued to soften on oversupply signals — a divergence that, on the surface, looks contradictory, according to Trading Economics. It isn’t. The two moves are mechanically linked, and understanding that link is the difference between reactive trading and a genuine safe-haven strategy for Q3 and Q4 2026.
The Transmission Mechanism: Why Oil and Gold Are Moving in Opposite Directions
The connection runs through three steps, as explained by GoldSilver’s August 2026 market analysis:
- Cheaper oil reduces energy-driven inflation. When crude prices fall, headline inflation pressure eases.
- Lower inflation reduces the urgency for Federal Reserve rate hikes. Markets reprice the probability of tightening downward.
- Falling rate-hike expectations ease real yields, and gold — which pays no yield — becomes comparatively more attractive against Treasuries.
This is precisely what played out after a de-escalation in US-Iran tensions in early August 2026: Brent crude fell more than 5% to roughly $83 a barrel and West Texas Intermediate dropped over 6% to around $79, while gold moved higher in response, per GoldSilver’s reporting. OPEC+’s approval of a September production increase of 188,000 barrels per day added further downward pressure on crude.
Gold’s Round-Trip Year: The Chart Most Coverage Misses
Most single-day commodity coverage misses the full-year arc. Gold’s 2026 story is a round-trip, not a straight line, according to drawpie.com’s August 2026 price analysis:
| Date | Event | Approx. Gold Price |
|---|---|---|
| Jan 29, 2026 | Record close | $5,318/oz |
| Jan 28, 2026 (intraday) | All-time intraday record | ~$5,589/oz |
| Late Jan 2026 | Single-session correction | -11.4% (largest single-day drop of the year) |
| Jul 16, 2026 | Cycle low after 5-month grind | $3,986/oz |
| Aug 5, 2026 | Sharp single-day rally | +3.7% |
| Mid-Aug 2026 | Third consecutive weekly gain | Above $4,500/oz |
Despite the record-high headlines in January and the correction headlines that followed, gold spent most of 2026 essentially flat to slightly below where it started the year before this August rally, per drawpie.com — a fact that gets lost in both the bullish and bearish framing competitors reach for.
Who’s Actually Buying: The Central Bank Signal
Retail and ETF flows have been volatile — US-listed gold ETFs saw roughly $5.3 billion in monthly redemptions during the summer correction, according to Yahoo Finance’s gold prediction coverage — but the more telling signal for institutional allocators is central bank demand. Central banks purchased a record 289 tonnes of gold in Q2 2026 alone, a 74% year-on-year jump, according to the World Gold Council’s Gold Demand Trends report cited by GoldSilver. A World Gold Council survey found 45% of central banks plan to add further to reserves, per Yahoo Finance — a structural demand floor that retail sentiment swings don’t erase.
Key Drivers to Watch Through Q4 2026
- Federal Reserve rate decisions: Markets have oscillated between pricing a hold and a hike at recent FOMC meetings; each print reprices real yields and gold in tandem.
- US-Iran and broader Middle East developments: Any escalation reverses the oil-down/gold-up dynamic described above.
- OPEC+ supply decisions: Additional production increases extend the oversupply narrative pressuring crude.
- US Treasury debt-management moves: A Treasury announcement to expand long-term debt buybacks reportedly drove a same-day gold jump of more than 4%, per Trading Economics, by pulling yields and the dollar lower.
A Safe-Haven Allocation Framework for Q3–Q4 2026
Wealth managers structuring client portfolios around this divergence should think in tiers rather than a single “buy gold” call:
- Core hedge (all risk profiles): A strategic 5–10% allocation to physical gold or gold-backed ETFs as a permanent inflation and currency hedge, independent of short-term price swings.
- Tactical overlay (active/balanced portfolios): Incremental additions timed around Fed meeting cycles and geopolitical flashpoints, using the transmission mechanism above as the entry signal rather than headline price alone.
- Energy underweight (Q3 2026 specific): Given the OPEC+ supply increase and de-escalation dynamics, tactical underweight positioning in pure upstream energy exposure, offset by overweight in refiners or energy-adjacent infrastructure less sensitive to crude-price direction.
- Silver as a levered gold proxy: Silver has moved even more sharply than gold in both directions in 2026 and remains in a structural, multi-year supply deficit, per GoldSilver — appropriate for investors with higher volatility tolerance seeking amplified safe-haven exposure.
The Bottom Line
The oil-gold divergence of Q3 2026 is not two unrelated commodity stories — it is one macro trade expressed through two assets connected by inflation expectations and Fed policy. Investors who treat gold and oil as separate headlines will consistently misread the signal; those who track the three-step transmission mechanism will be positioned ahead of the next Fed-driven repricing.
Discover more from The Economy
Subscribe to get the latest posts sent to your email.


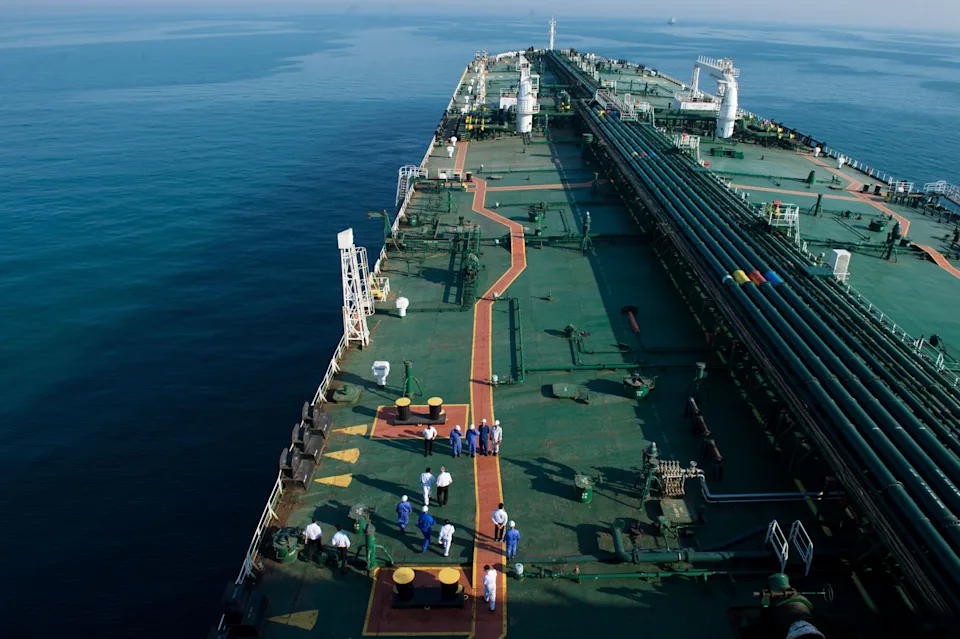
Russian crude loadings at Novorossiysk hit zero as Ukrainian drone strikes intensify. Here’s what the export collapse means for Urals pricing and global supply.
Russia’s seaborne oil export machine is sputtering under sustained Ukrainian pressure. Per Bloomberg, shipments have fallen for a fifth week, with no crude loading at all from the key Novorossiysk terminal in the seven days to August 16 — a decline larger than any comparable stretch since the war began.
Key Takeaways
- Russian oil shipments have fallen for five straight weeks, with no crude loaded at the key Novorossiysk terminal in the seven days to August 16.
- Ukraine struck Novorossiysk’s naval base and infrastructure on August 11-12, damaging four warships and hitting the tunnel leading to the Sheskharis terminal.
- The Sheskharis terminal — Russia’s main Black Sea export point, handling around 700,000 barrels a day — has suspended loadings repeatedly since.
- Russian oil refining fell in July to its lowest level since May 2002, roughly a third below seasonal norms.
- Russia earned €193 billion from energy sales over the past year, of which €14.5 billion came from the EU.
The proximate cause was a major overnight strike. Per the Kyiv Independent, Ukraine’s large-scale drone attack on Novorossiysk overnight on August 12 damaged the Sheskharis terminal — Russia’s main Black Sea crude facility, handling around 700,000 barrels a day — and follow-on drone threats on August 14 forced a full suspension of loadings, with a scheduled tanker departing without cargo. President Zelensky said the strikes hit two frigates, a landing ship, a corvette and other naval vessels, along with grain terminals and infrastructure supporting Russia’s war financing, per EA WorldView’s reporting.
The human and commercial toll has been significant on both fronts. The Moscow Times reported at least three people were killed in the attack, including a child, and that two major grain terminals were knocked offline — Russia is the world’s largest wheat exporter, and its grain lobby has separately warned that continued strikes could disrupt exports and push up global food prices.
The disruption follows a period of unusually high export volumes as Russia pushed to keep revenue flowing despite the attacks. Per Baird Maritime, Novorossiysk loadings reached nearly 1 million barrels a day in July, up from about 800,000 in June — but security risk in the Black Sea has made vessels increasingly hard to secure, with one trader involved in Russian oil sales telling Reuters they “have to change vessels daily as most shipowners refuse to visit Russia’s Black Sea ports.”
The strain extends beyond export terminals into refining capacity itself. Per The Moscow Times’ Bloomberg-sourced reporting, Russian refineries processed an estimated 3.6 million barrels of crude a day in July — the lowest since May 2002, and roughly a third below the 5.3-5.6 million barrel seasonal norm for 2020-2025. Rystad Energy’s head of geopolitical analysis noted Russia retains some capacity to redirect crude to Baltic terminals, but limited pipeline, storage and tanker capacity constrain how much it can compensate.
The financial stakes are considerable. The same Moscow Times reporting notes Russia earned €193 billion from energy sales over the past year, of which €14.5 billion came from the European Union — underscoring how much revenue is riding on export infrastructure that is now under sustained attack.
Why It Matters
A sustained reduction in Russian export volumes tightens global crude supply at the same time the Strait of Hormuz disruption (Article 5) is constraining Middle East flows — a dual supply shock with outsized implications for energy-importing economies across this operation’s nine markets.
Data and Evidence
- Novorossiysk crude loadings: 0 for the week to August 16, following a fifth consecutive weekly decline
- Sheskharis terminal capacity: ~700,000 barrels/day
- July Novorossiysk loadings before the disruption: ~1 million barrels/day
- Russian refining, July 2026: 3.6 million barrels/day, lowest since May 2002
- Russia’s energy revenue, trailing year: €193 billion (€14.5 billion from the EU)
Global Impact
Combined with Hormuz disruptions, reduced Russian seaborne exports add to a global crude-supply tightening that ripples into every energy-importing market this operation covers, and into shipping-insurance costs for tankers willing to operate in either conflict zone.
What Happens Next
Watch whether Russia can redirect meaningful volumes to Baltic terminals, and whether Ukraine sustains its Black Sea strike tempo despite reported US pressure (Vice President Vance reportedly asked Zelensky to pause strikes in late July) to avoid further destabilizing oil markets.
Frequently Asked Questions
Why did Russian oil exports drop to zero at Novorossiysk?
Repeated Ukrainian drone strikes damaged the Sheskharis terminal and forced repeated suspensions of loading operations.
How much of Russia’s oil exports does Novorossiysk handle?
Around 700,000 barrels a day at capacity, roughly 2% of global oil supply.
Is Russian refining also affected?
Yes — refining hit a 24-year low in July, about a third below seasonal norms.
Can Russia reroute exports elsewhere?
Partially, via Baltic terminals, but pipeline, storage and tanker capacity limit how much can be redirected.
How much revenue does Russia get from energy exports?
Roughly €193 billion over the trailing year, including €14.5 billion from EU buyers.
Discover more from The Economy
Subscribe to get the latest posts sent to your email.
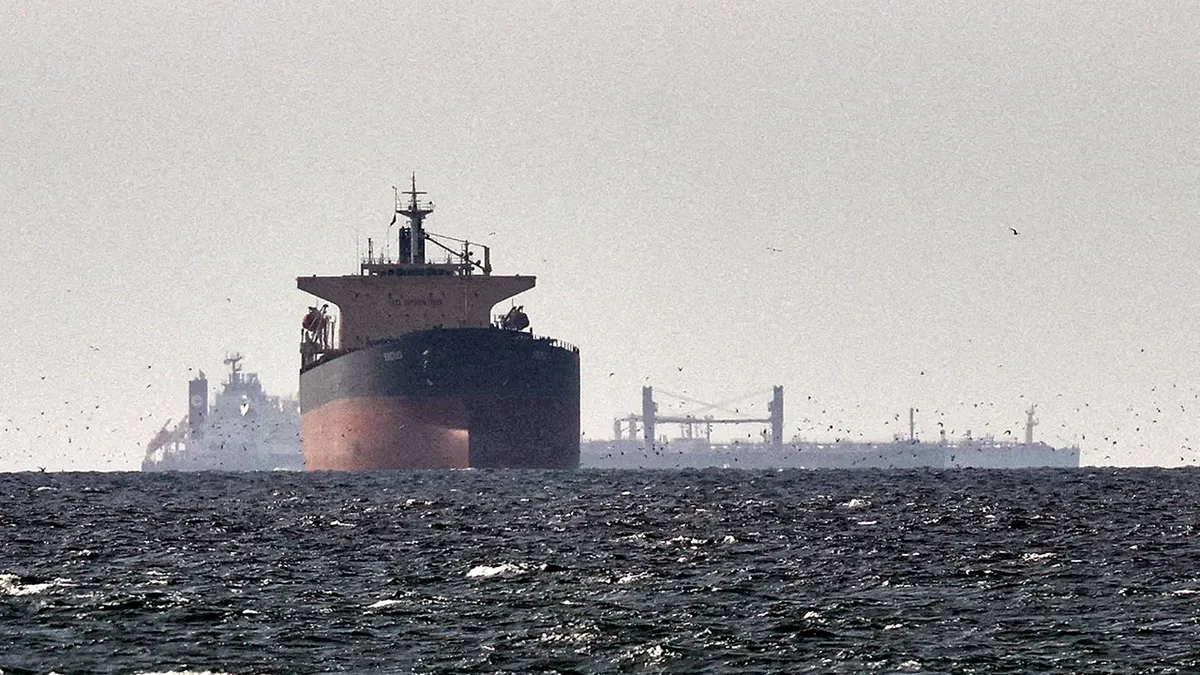
Brent crude is near $90 a barrel as tanker transits through the Strait of Hormuz collapse and the US-Iran interim deal expires. Here’s what it means for global energy costs.
Oil prices are climbing again as one of the world’s most important energy chokepoints grinds nearly to a halt. Per IranWire, Brent crude climbed to $89.40 a barrel in Monday, August 17 trading, driven by fading hopes for renewed US-Iran talks and a sharp drop in Strait of Hormuz tanker traffic. Shipping analytics firm Kpler data cited in the same report shows only five cargo vessels transited the strait on one Saturday, with zero on Sunday — down from 31 the previous weekend.
Key Takeaways
- Brent crude climbed to $89.40 a barrel on August 17 as tanker transits through the Strait of Hormuz collapsed to near zero.
- Only five cargo vessels crossed the strait on one recent Saturday, and zero on Sunday, versus 31 the previous weekend.
- The interim US-Iran memorandum of understanding, which set a 60-day negotiating window, has expired without a permanent agreement.
- The EIA does not expect Middle East oil production to return to near pre-conflict levels until early 2027.
- Gulf producers, including Saudi Arabia, are increasingly rerouting crude through alternative loading points to bypass the strait.
The immediate trigger is the expiration of the interim framework that had briefly stabilized the situation. Per TradingEconomics, crude rose above $85 a barrel as President Trump said Washington was not currently holding or planning talks with Tehran, while confirming a naval blockade remains in place — even as he claimed the strait was open and mines cleared. The same report notes a vessel was attacked while leaving the strait, suffering engine-room damage and a crew casualty, and that the memorandum of understanding signed in June — meant to give both sides 60 days to negotiate a longer-term deal — officially expired without a follow-on agreement.
The scale of the disruption is historic. Per Al Jazeera, shipping through the strait — a conduit for about one-fifth of global oil supply before the war — has effectively collapsed since the conflict began in late February, prompting the largest energy disruption in recorded history; between eight and 15 vessels crossed on August 4-6, versus roughly 130 transits before the conflict, according to ship-tracker MarineTraffic.
Iranian Foreign Minister Abbas Araghchi has tied any reopening to conditions Washington hasn’t met, including sanctions relief and war reparations, per the same Al Jazeera report. A separate CNBC report details a restrictive draft plan Iranian state media published for strait traffic — banning US and Israeli vessels outright and penalizing others at 20% of cargo value — even as Iran and Oman continued separately negotiating a managed-transit arrangement.
The price path has been genuinely volatile rather than a one-way spike. Per a CNBC analysis, Brent fell more than 7% in one week following signals of an imminent deal that then failed to materialize, before rebounding as attacks resumed. CNBC’s most recent update notes both major contracts gained more than 5% in the most recent week following attacks on ADNOC-operated tankers in the strait and a Saudi Aramco refinery, with a Phillip Nova analyst noting prices “have now rebounded almost completely from the lows seen in early August” as hopes for a lasting resolution fade.
Gulf producers are adapting rather than absorbing the disruption passively. The same Al Jazeera reporting notes Saudi Arabia has begun offering crude sourced from outside the chokepoint, following a pattern the UAE established earlier, while the EIA’s latest outlook — cited by Yahoo Finance — does not expect Middle East oil production to return to near pre-conflict levels until early 2027, forecasting Brent to average $79 a barrel for 2026, up sharply from a pre-conflict $58 forecast.
Why It Matters
Every day the strait remains constrained adds cost to energy-importing economies across the nine markets this operation covers, most directly Pakistan, Singapore and the UK, all of which import the bulk of their energy. It also directly explains part of the Bank of England’s rate-hold calculus detailed in Article 3.
Data and Evidence
- Brent crude: $89.40/barrel (Aug 17); recent trading above $85-90 range
- Strait transits: as low as 0 vessels on some days, versus ~130/day pre-conflict
- Pre-war share of global oil flows through Hormuz: approximately one-fifth
- EIA 2026 Brent forecast: $79/barrel average, up from a pre-conflict $58 estimate
Global Impact
Beyond direct energy-import costs, prolonged Hormuz disruption raises shipping insurance premiums globally and adds to inflation risk for every economy in this nine-market portfolio — a throughline connecting this story to the UK rate story, Pakistan’s inflation outlook, and global aviation fuel costs (Article 12).
What Happens Next
Watch for whether Iran and Oman finalize a managed-transit arrangement, and whether Washington re-engages given Trump’s stated reluctance to extend the interim deal. The EIA’s early-2027 normalization timeline is the baseline scenario barring a breakthrough.
Frequently Asked Questions
Why did oil prices rise again in August?
Tanker transits through the Strait of Hormuz collapsed toward zero as the US-Iran interim deal expired without a follow-on agreement.
Is the Strait of Hormuz fully closed?
Not officially, but transit volumes have fallen to a small fraction of pre-conflict levels on many days.
When might the situation normalize?
The EIA doesn’t expect near-pre-conflict production levels until early 2027.
Are alternative routes available?
Saudi Arabia and the UAE have begun rerouting some crude through non-strait loading points. How much oil normally flows through Hormuz?
About one-fifth of global oil supply before the conflict began.
Discover more from The Economy
Subscribe to get the latest posts sent to your email.
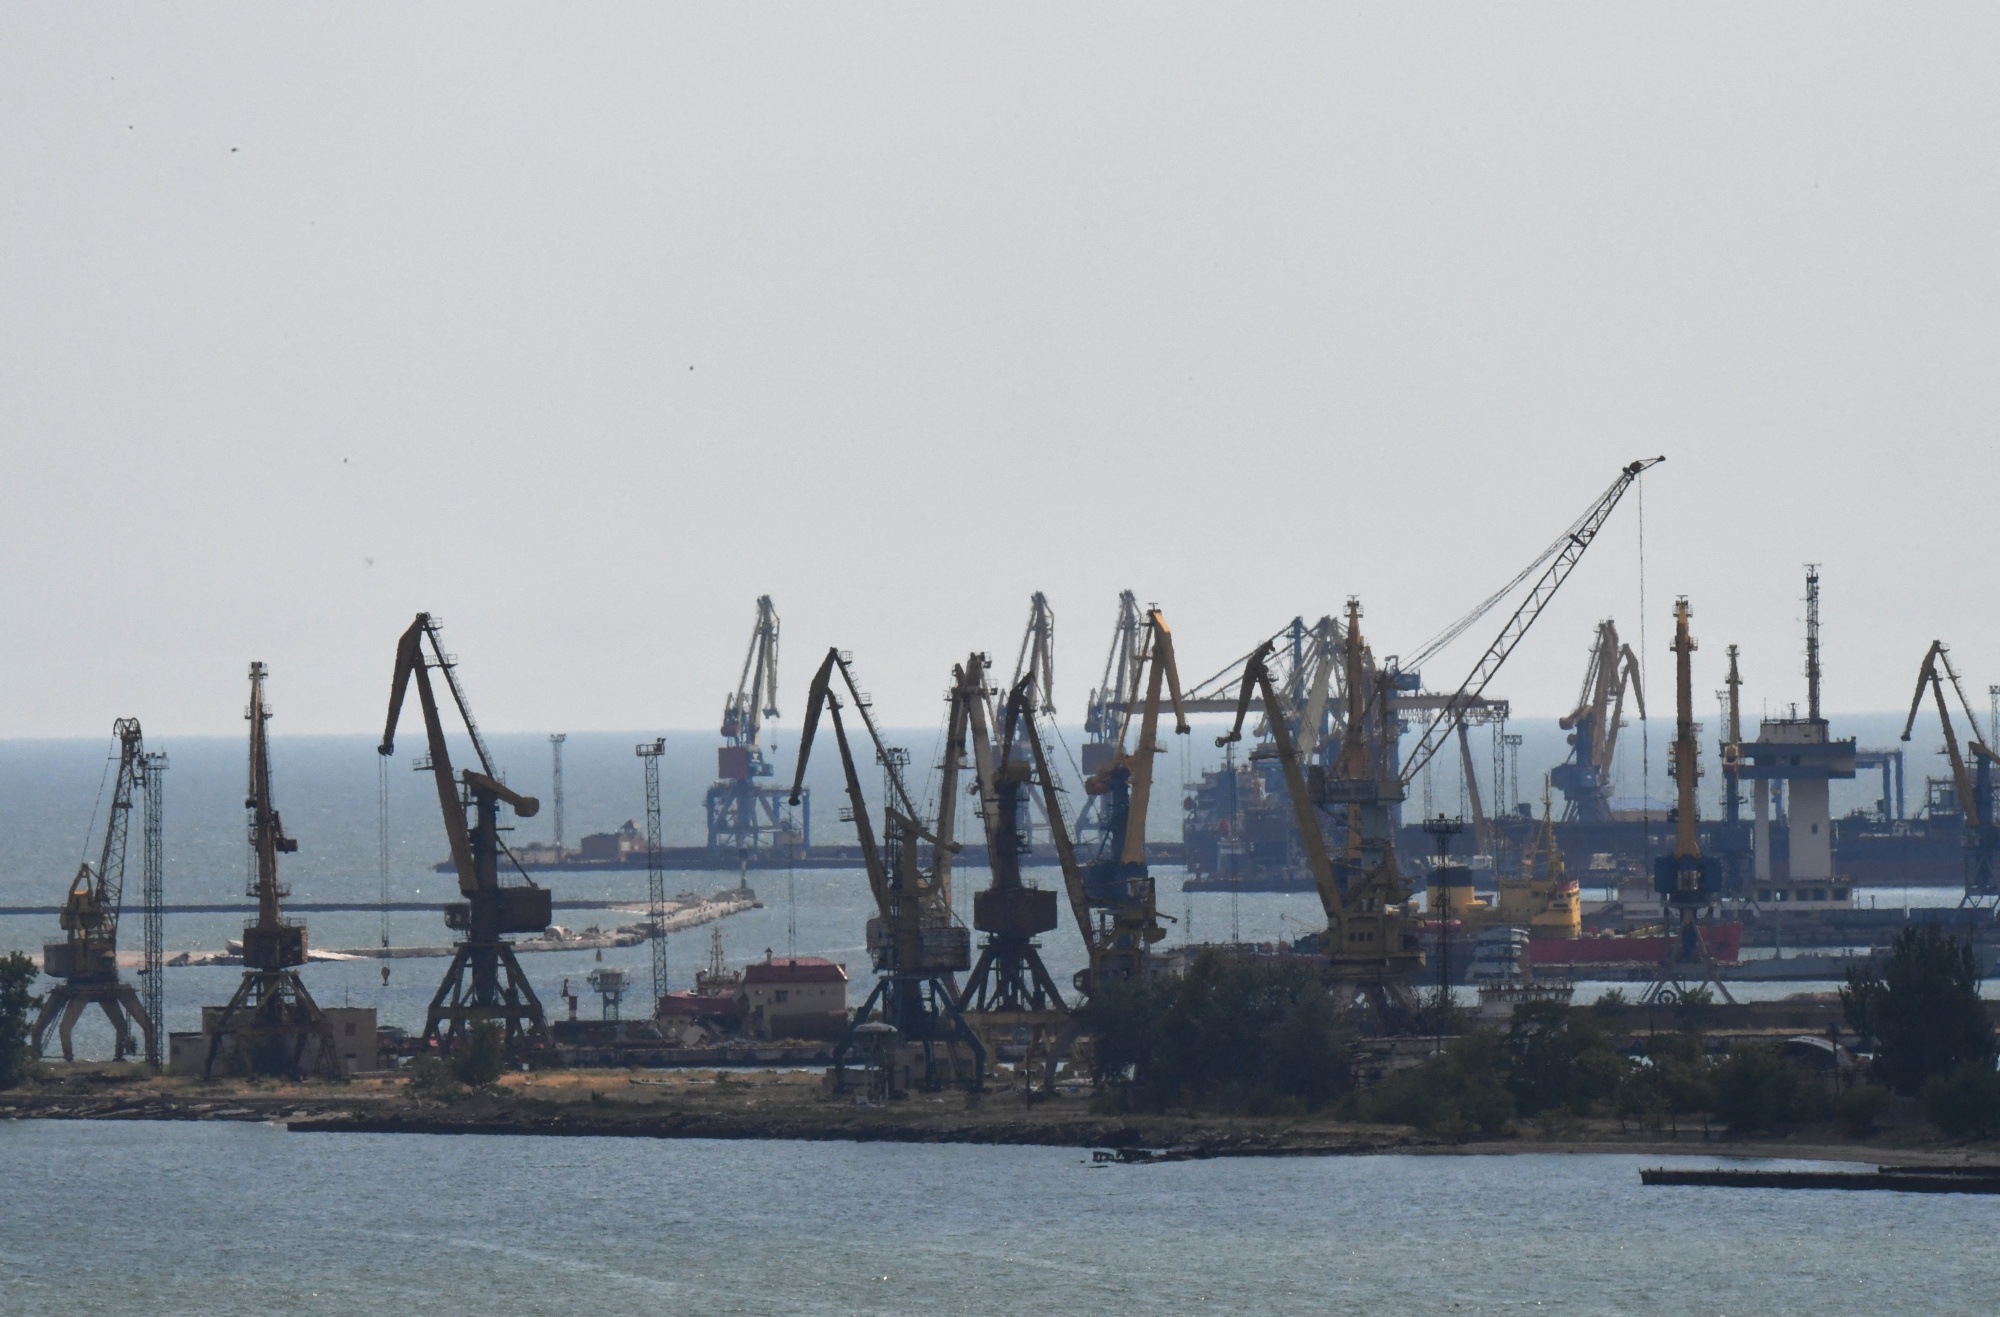
Russia’s oil export machine is showing fresh strain, as Ukrainian strikes on critical loading infrastructure and a tightening sanctions net combine to push key export volumes to record lows — even as elevated global oil prices from the separate Iran conflict have offered Moscow a partial, and increasingly fragile, offset.
Loadings Collapse at Key Ports
The clearest sign of the pressure is at Tuapse, a Black Sea port that has been under sustained drone attack since May and loaded almost no oil products for a second consecutive month in July, according to the Centre for Research on Energy and Clean Air’s monthly tracking of Russian fossil fuel exports. Loadings at the port fell a further 23% in July to just 4.7 million tonnes — their lowest level on record and less than half the 9.6 million tonnes loaded in July of the previous year.
The disruption intensified following Ukraine’s July 19 drone strike on the Caspian Pipeline Consortium’s marine terminal near Novorossiysk, after which only one oil shipment was loaded between July 22 and 26, with total monthly loadings at the port dropping 23% month-on-month. With refinery throughput still depressed and domestic demand taking priority — jet fuel, diesel, and gasoline all remain under an export ban — the continued slide points to a further fall in oil product revenues in August.
Urals Crude Trades Well Above the Price Cap
Prices tell a more nuanced story. The average price of Russia’s benchmark Urals-grade crude fell 3% month-on-month to $60.22 per barrel in July, still significantly higher than the EU and UK price cap of $44.1 per barrel that took effect in February. The gap between the market price Russia is actually realising and the Western-imposed cap illustrates how the broader oil-market disruption from the separate Iran conflict has, paradoxically, given Moscow more room above the sanctions ceiling than it has enjoyed for much of the past two years.
That relief has been substantial in dollar terms. Oil export earnings rose from an average of $10.4 billion per month in January-February to $19.1 billion in March, $21.5 billion in April, and $20.8 billion in May, according to a mid-year assessment by the Kyiv School of Economics Institute, as the Iran war’s disruption to global energy flows lifted prices broadly and, by extension, Russian revenue even as sanctions architecture remained largely unchanged.
Sanctions Circumvention Under Scrutiny
Enforcement efforts continue to target the shadow fleet and its supporting ecosystem. The Georgian port of Kulevi — whose refinery has run solely on Russian crude and has not received a single shipment of non-Russian crude since opening operations in October 2025 — has said it will stop accepting Russian oil as of August or September, after a new sanctions package introduced a transaction ban on the refinery for processing and trading Russian crude, effective after a six-month wind-down period. CREA’s analysis suggests Kulevi and the nearby port of Batumi have been exporting refined products suspected of containing Russian-origin molecules to jurisdictions that maintain sanctions on Moscow.
Washington Escalates With a New Sanctions Bill
The pressure from Washington has grown more concrete as well. The US Senate passed legislation dubbed the “Lindsey O. Graham Sanctioning Russia and Iran Act of 2026,” which sets up to 100% tariffs on major nations importing Russian oil and gas. The bill’s supporters argue it will have a ripple effect across Russia’s economy by deterring countries from trading with Moscow, given that Russia’s fossil fuel exports earn the country roughly 734 million euros a day and remain the central pillar of its war financing.
Russia’s embassy in Washington has condemned the legislation, pointing to the knock-on energy constraints already caused by the US-Israel war on Iran and warning that further sanctioning of Russia’s trading partners risks compounding an “impending energy crisis” ahead of US midterm elections.
The Bigger Fiscal Picture
Even with the Iran-war windfall, Russia’s broader economic trajectory remains under pressure. Growth is projected at just 0.4% for 2026, worse than the 1% recorded in 2025, and authorities have moved to hike taxes — including raising VAT from 20% to 22% — to shore up a budget strained by continued military spending. Analysts at KSE Institute frame the coming months as a fork in the road: a prolonged global oil crisis would continue supporting Russian export and budget revenues without resolving the domestic fuel crisis, while a faster return of the oil market to surplus would expose Russia more fully to lower revenues and mounting fiscal pressure.
Key Takeaways
- Ukrainian drone strikes on Novorossiysk and Tuapse have pushed Russian oil product loadings to record lows in July.
- Urals crude averaged $60.22 a barrel in July, still well above the $44.1 Western price cap, thanks to the separate Iran-war oil-price shock.
- Russian oil export earnings roughly doubled from January-February levels through the spring, even as sanctions enforcement tightened elsewhere.
- The US Senate passed a bill threatening up to 100% tariffs on countries importing Russian oil and gas.
- Russia’s own 2026 growth forecast stands at just 0.4%, with authorities raising VAT to shore up war-strained public finances.
Frequently Asked Questions
Why have Russian oil exports fallen at key ports? Ukrainian drone strikes on the Caspian Pipeline Consortium terminal near Novorossiysk and on the port of Tuapse have severely disrupted loadings, pushing volumes to record lows in July 2026.
Why is Russia’s Urals crude trading above the Western price cap? The Iran war’s disruption to global oil markets has lifted prices broadly, allowing Russia to sell Urals crude at $60.22 a barrel — well above the $44.1 EU/UK price cap — despite ongoing sanctions.
What new US legislation targets Russian oil buyers? The US Senate passed the “Lindsey O. Graham Sanctioning Russia and Iran Act of 2026,” which authorizes tariffs of up to 100% on countries that import Russian oil and gas.
Discover more from The Economy
Subscribe to get the latest posts sent to your email.

BRICS Summit 2026: Economic Implications of the India-China Diplomatic Thaw

Emerging Market Debt: The Ripple Effect of China’s Sovereign Refinancing Role

Dropping Oil & Surging Gold: Navigating Safe-Haven Investments in Q3

2026 AI Stock Frenzy: How to Position Your Portfolio

The AI Disruption in Financial Risk Management: Moving Beyond Record Banking Profits

The Rise of Green Aviation: Balancing High Fuel Prices with Sustainable Infrastructure

US-China Relations in Q3 2026: Trade Tariffs and Supply Chain Risks

Emerging Markets Rebound: Top Stock Strategies for the Gulf and South Asia

Tackling the 2026 Global Food Crisis: Policy Shifts and Market Speculation

Post-Quantum Encryption in Banking: The Next Frontier in Cybersecurity Investments

The Financial Cost of Sanctions: Afghanistan’s Economy 5 Years Under the Taliban

Supply Chain Fragmentation: 10 Trends Reshaping Global Trade This Year

The 2026 Aviation Boom: Investing in Airline Stocks as Passenger Traffic Surges

China’s 2026 Corporate Laws: Western Compliance Guide

China Politburo July 2026: Stimulus Signals Explained

Russia Fuel Shortages 2026: Inside a Cracking War Economy

Top 15 Financial Stocks for Investment in PSX

Pakistan Passed Its Third IMF Review

SpaceX Stock Lockup Expiration Explained: Why $123B in Shares Could Hit the Market

Pakistan IMF Program 2026: Inside the Push Toward an Interest-Free Economy

Andy Burnham, UK Gilts and Mortgages: July 2026 Explainer

Russia Oil Revenue 2026: How Sanctions on Rosneft and Lukoil Are Draining the War Chest

State Farm’s $5B Dividend 2026: Who Qualifies & Payout Dates

Pakistan’s 2026 Monsoon Floods Threaten Fragile Economic Recovery as Inflation Nears 9%

Gold Price 2026: Why Bullion Has Fallen 25% From Its January Record High

Russia Oil Revenue 2026: The Iran War Windfall and What a Hormuz Deal Means for Moscow

Canada US Trade War 2026: Inside Carney’s Push to Cut Ties With Trump’s Tariffs

Russia’s Budget Deficit Blew Past Its Full-Year Target in Three Months
-

 Markets & Finance8 months ago
Top 15 Stocks for Investment in 2026 in PSX: Your Complete Guide to Pakistan’s Best Investment Opportunities
-

 Analysis6 months ago
Johor’s Investment Boom: The Hidden Costs Behind Malaysia’s Most Ambitious Economic Surge
-

 Analysis6 months ago
Top 10 Stocks for Investment in PSX for Quick Returns in 2026
-

 Analysis7 months ago
Brazil’s Rare Earth Race: US, EU, and China Compete for Critical Minerals as Tensions Rise
-

 Banks7 months ago
Best Investments in Pakistan 2026: Top 10 Low-Price Shares and Long-Term Picks for the PSX
-

 Investment7 months ago
Top 10 Mutual Fund Managers in Pakistan for Investment in 2026: A Comprehensive Guide for Optimal Returns
-

 Global Economy8 months ago
15 Most Lucrative Sectors for Investment in Pakistan: A 2025 Data-Driven Analysis
-

 Global Economy8 months ago
Pakistan’s Export Goldmine: 10 Game-Changing Markets Where Pakistani Businesses Are Winning Big in 2025