
Investment
Consumer Discretionary Stocks Face Q4 Reckoning: Winners, Losers, and Where Smart Money Is Flowing

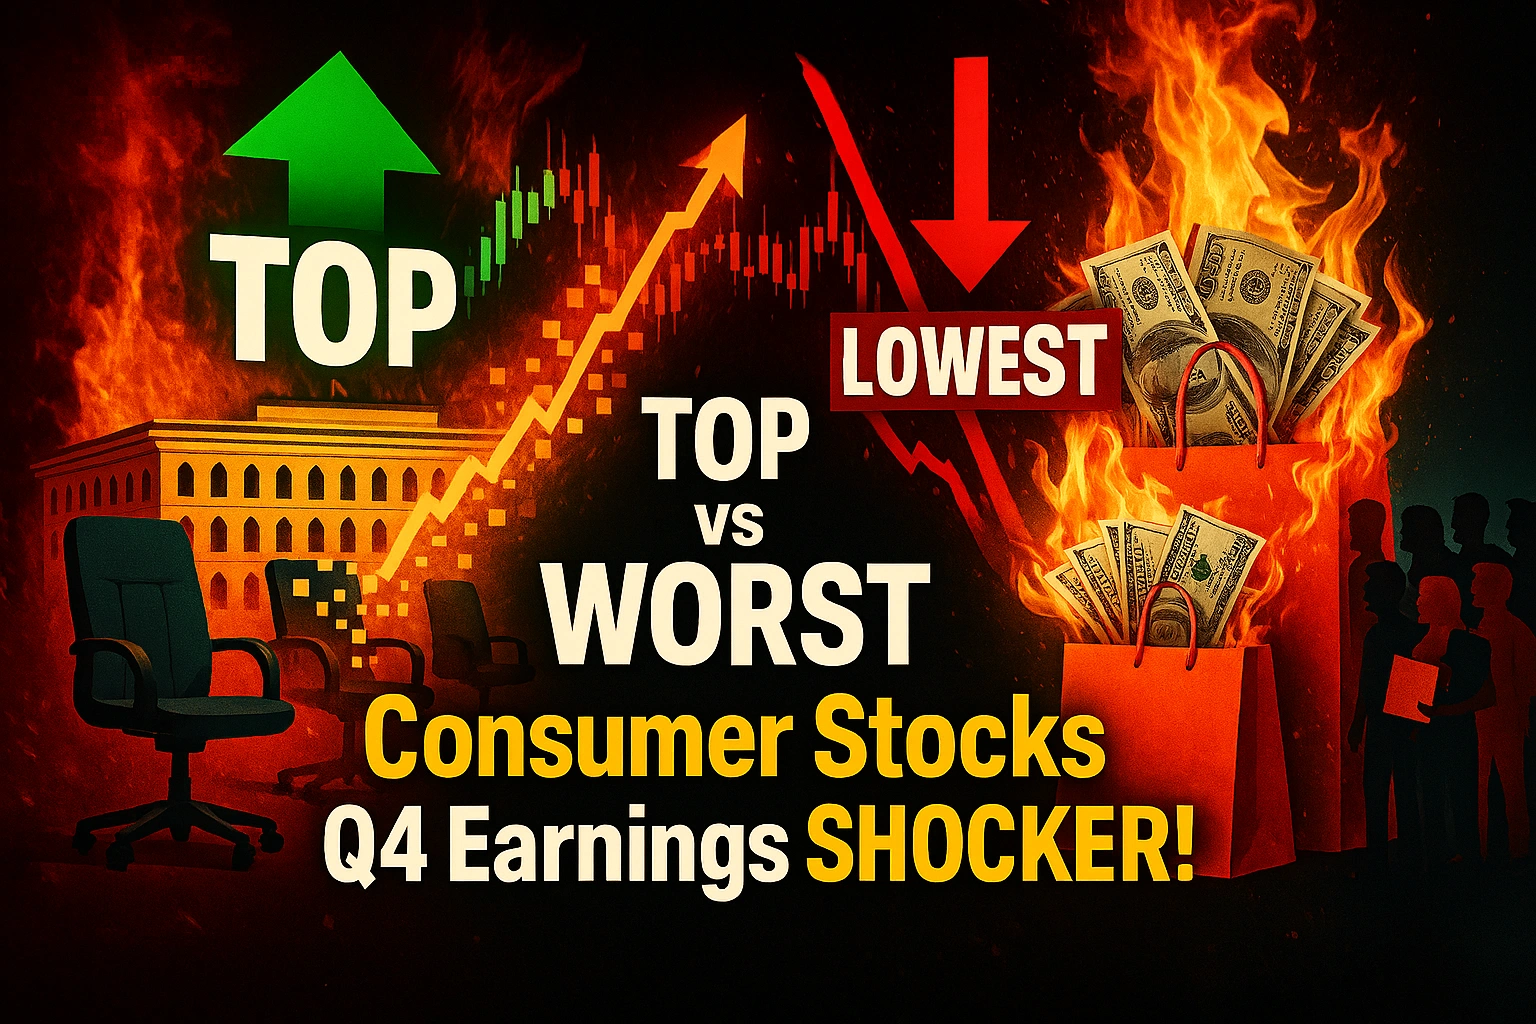
Consumer discretionary stocks enter Q4 earnings with stark divergence. Our expert analysis reveals top-rated winners, struggling laggards, and actionable investment strategies for this pivotal earnings season.
The consumer discretionary sector stands at a crossroads that most retail investors aren’t seeing clearly.
As Q4 earnings season accelerates, I’m watching a fascinating divergence unfold—one that separates the companies genuinely thriving from those merely surviving on borrowed time and hopeful press releases. After fifteen years analyzing market cycles and political-economic intersections, I can tell you this: the current setup in consumer discretionary stocks represents one of the most asymmetric risk-reward environments I’ve witnessed since the post-pandemic reopening trade.
Here’s what’s keeping me up at night—and what’s got me genuinely excited.
The Consumer Discretionary Select Sector SPDR Fund (XLY) has delivered impressive returns, yet beneath that headline number lies a tale of two markets. A handful of mega-cap names have dragged the index higher while dozens of mid-cap retailers and leisure companies struggle with margin compression, inventory gluts, and a consumer who’s growing increasingly selective about where discretionary dollars flow.
According to FactSet’s latest earnings analysis, Q4 earnings growth expectations for the consumer discretionary sector hover around 13%—notably above the S&P 500’s blended estimate. But averages deceive. The spread between winners and losers in this sector has widened to levels that demand your attention.
Let me walk you through exactly where I see opportunity, where I see danger, and how I’m thinking about positioning for what comes next.
The Macroeconomic Landscape: Reading the Consumer’s Mind
Before diving into individual stocks, we need to understand the economic backdrop shaping consumer behavior. And frankly, the picture is more nuanced than the bulls or bears want to admit.
The U.S. economy has demonstrated remarkable resilience. Bureau of Economic Analysis data shows GDP growth maintaining momentum, defying the recession predictions that dominated headlines throughout 2023 and much of 2024. Consumer spending—which drives roughly 70% of economic output—has remained robust, though the composition of that spending tells a more complex story.
Here’s what I find particularly telling: consumers are spending, but they’re trading down within categories and becoming ruthlessly value-conscious. The Conference Board’s Consumer Confidence Index has stabilized, yet the “present situation” component consistently outperforms the “expectations” component. Translation? People feel okay about today but harbor genuine concerns about tomorrow.
The Federal Reserve’s policy trajectory adds another layer of complexity. After the aggressive rate-hiking cycle, the central bank has pivoted toward a more accommodative stance, with rate cuts providing tailwinds for consumer credit and big-ticket purchases. Federal Reserve economic projections suggest a continued easing bias, which historically benefits consumer discretionary stocks—particularly those in housing-adjacent categories and durable goods.
But here’s where my political economy lens becomes crucial: we’re navigating a post-election environment with significant policy uncertainty. Trade policy, tax policy, and regulatory frameworks remain in flux. Companies with domestic supply chains and pricing power hold structural advantages over those dependent on complex international logistics or razor-thin margins.
Unemployment remains historically low, but the labor market has cooled from its white-hot 2022-2023 levels. Wage growth has moderated, and while that’s disinflationary (positive for Fed policy), it also suggests consumers face constraints that weren’t present eighteen months ago.
The net effect? A bifurcated consumer. High-income households continue spending on experiences, luxury goods, and premium products. Middle and lower-income consumers are stretching budgets, hunting for deals, and deferring discretionary purchases when possible. The companies positioned to serve both segments—or dominating one definitively—will outperform. Those stuck in the middle face brutal margin pressure.
Top-Rated Consumer Discretionary Stocks: Where Strength Meets Opportunity
After analyzing earnings estimates, analyst revisions, fundamental metrics, and qualitative competitive positioning, these consumer discretionary stocks stand out as Q4 winners with continued upside potential.
Amazon (AMZN): The Undisputed Category Killer
I’ll start with the obvious one because ignoring Amazon in any consumer discretionary analysis would be analytical malpractice.
Amazon’s Q4 setup looks exceptionally strong. Bloomberg Intelligence estimates project AWS revenue growth reaccelerating, while the core e-commerce business benefits from holiday seasonality and improved fulfillment efficiency. The advertising segment—often overlooked—has become a high-margin cash machine that subsidizes competitive pricing in retail.
What excites me most isn’t the headline numbers but the margin trajectory. Amazon’s North American retail segment has swung to consistent profitability after years of investment-phase losses. Operating leverage is finally materializing, and Q4’s volume surge should amplify this dynamic.
Current analyst consensus shows overwhelming buy ratings, with price targets suggesting 15-25% upside. At roughly 35x forward earnings, Amazon isn’t cheap by traditional metrics—but traditional metrics miss the AWS optionality and advertising growth runway.
My Take: Amazon remains a core holding for any growth-oriented investor. Q4 earnings should catalyze the next leg higher. I’m particularly watching management commentary on AI infrastructure spending and international profitability improvements.
Costco Wholesale (COST): The Recession-Proof Compounder
Costco defies easy categorization. Yes, it’s a consumer staples business at its core. But the discretionary upside from membership fees, ancillary services, and big-ticket items like electronics and furniture warrants inclusion here.
The membership model creates one of the most durable competitive moats in retail. Morningstar analysis highlights Costco’s 93% membership renewal rate—a staggering figure that speaks to genuine customer loyalty rather than mere convenience.
Q4 typically delivers Costco’s strongest comparable sales growth, driven by holiday entertaining, gift purchases, and seasonal merchandise. The company’s treasure-hunt shopping experience generates the kind of excitement that drives traffic even when consumers claim they’re cutting back.
Valuation gives me pause—Costco trades at a premium that prices in considerable future growth. But premium businesses deserve premium valuations, and Costco’s execution consistency justifies investor confidence.
My Take: Costco belongs in portfolios as a quality compounder. Don’t expect explosive upside, but do expect steady outperformance and downside protection during market turbulence.
Royal Caribbean Group (RCL): The Experience Economy Winner
Here’s where I break from consensus caution.
Cruise lines remain under-owned by institutional investors scarred by pandemic-era balance sheet destruction. But Royal Caribbean’s transformation has been remarkable. CNBC reported record booking levels and yield growth that’s exceeding pre-pandemic peaks on a real basis.
The demand story is simple: consumers—especially affluent Boomers—are prioritizing experiences over things. Cruising offers exceptional value compared to land-based vacations, with all-inclusive pricing that resonates in an inflationary environment. Royal Caribbean’s private island investments and fleet modernization have elevated the product while competitors struggle with older ships and weaker balance sheets.
Q4 earnings should reflect strong Wave Season booking momentum (the January-March period when cruise lines book 60%+ of annual capacity). Management’s pricing power commentary will be closely watched.
My Take: Royal Caribbean offers compelling risk-reward at current levels. The stock has run significantly, but earnings power continues expanding. I’m overweight cruise lines generally and RCL specifically.
Chipotle Mexican Grill (CMG): Fast-Casual Excellence
Chipotle has become the template for fast-casual success, and Q4 should demonstrate why.
Traffic growth—not just price increases—drives Chipotle’s comparable restaurant sales. That’s rare in the current environment and speaks to genuine brand strength. Wall Street Journal coverage noted Chipotle’s successful navigation of ingredient cost inflation while maintaining quality—a balancing act most competitors failed.
The Chipotlane drive-through format expansion addresses the convenience gap that historically limited occasion growth. Digital sales penetration remains elevated post-pandemic, improving order accuracy and labor efficiency.
New unit growth provides the compounding engine: each new restaurant generates returns on invested capital that justify aggressive expansion. Management’s guidance suggests sustained 8-10% annual unit growth, with newer formats delivering improved economics.
My Take: Chipotle deserves its premium multiple. Q4 should reinforce the thesis. My only concern is valuation—at 45x+ forward earnings, execution must remain flawless. Any comparable sales miss would punish the stock severely.
Home Depot (HD): Housing Recovery Beneficiary
Home Depot’s Q4 setup reflects a sector rotation opportunity.
The housing market is stirring. Mortgage rates have declined from cycle highs, and Reuters reported improving homebuilder sentiment and existing home sales stabilization. Every housing transaction generates thousands of dollars in home improvement spending—and Home Depot captures disproportionate share.
The professional contractor segment provides stability through housing cycles, while the DIY consumer responds to interest rate relief and accumulated home equity wealth. Home Depot’s supply chain investments during the pandemic created competitive advantages that persist.
Analyst estimates have begun revising higher after extended negativity. The stock has outperformed in anticipation, but earnings confirmation could drive continued rerating.
My Take: Home Depot represents a quality cyclical at reasonable valuations. I prefer it over Lowe’s given superior execution and professional segment strength. Accumulate on pullbacks.
Lowest-Rated Consumer Discretionary Stocks: Where Caution Is Warranted
Not every consumer discretionary stock deserves your capital. These companies face structural challenges that Q4 earnings are unlikely to resolve.
Nike (NKE): The Fallen Giant
It pains me to write this. Nike is an iconic American brand—and a stock I owned for years. But the company’s competitive position has deteriorated in ways that demand acknowledgment.
Yahoo Finance analyst coverage highlights Nike’s market share losses to upstarts like On Running, Hoka, and resurgent competitors like New Balance and Adidas. The direct-to-consumer pivot, initially celebrated, has alienated wholesale partners without delivering promised margin benefits.
China exposure compounds problems. The Chinese consumer discretionary market has struggled with property sector contagion and youth unemployment, pressuring a region that historically delivered outsized growth.
Innovation has stalled. When was Nike’s last genuinely exciting product launch? The running community has largely abandoned the brand, and basketball—Nike’s heritage sport—increasingly features athletes in competitor footwear.
Q4 earnings may stabilize sentiment temporarily, but the fundamental challenges require years of reinvestment and cultural change to address.
My Take: Nike is a value trap until proven otherwise. The dividend provides modest support, but capital appreciation potential appears limited. I’m avoiding the stock despite apparent valuation support.
Dollar General (DG): Structural Deterioration
Dollar General’s challenges transcend cyclical weakness.
The thesis was simple: inflation-pressured consumers would trade down to dollar stores. Reality proved more complicated. Seeking Alpha analysis documented comparable sales weakness, inventory management failures, and execution stumbles that forced management turnover.
Shrinkage (theft) has become an existential issue for discount retailers operating in urban and semi-urban locations. Dollar General’s store count growth—previously a competitive advantage—now looks like overexpansion into marginal locations.
Competition from Walmart’s aggressive everyday low pricing and Amazon’s expanding household essentials presence squeezes Dollar General from above and below simultaneously.
My Take: Dollar General requires a proven turnaround before warranting investment. The stock appears cheap, but cheap can become cheaper when fundamental trends deteriorate. There are better places to hunt for value.
Tesla (TSLA): Volatility Without Commensurate Reward
I’ll catch criticism for this one. Tesla inspires passionate devotion among shareholders who view any skepticism as blasphemy.
But let’s examine the consumer discretionary fundamentals objectively.
Tesla’s automotive gross margins have compressed significantly as price cuts defend market share against Chinese EV manufacturers and legacy automakers’ accelerating electrification efforts. MarketWatch noted the company’s sequential delivery growth has decelerated, raising questions about demand elasticity.
Elon Musk’s distraction with other ventures creates governance concerns that institutional investors increasingly acknowledge. The robotaxi narrative, while potentially transformative, remains speculative with uncertain timelines.
Valuation assumes perfection. Any execution stumble—demand weakness, production issues, competitive pressure—punishes the stock disproportionately given elevated expectations embedded in the current price.
My Take: Tesla is a trading vehicle, not an investment for most portfolios. The risk-reward at current valuations skews negatively for Q4 and beyond. I’m neutral-to-bearish and would consider short exposure on rallies.
Starbucks (SBUX): Identity Crisis Brewing
Starbucks faces a problem money can’t easily solve: brand perception decay.
The new CEO inherits a company that has lost its way. Is Starbucks a premium experience or a convenient caffeine dispensary? The mobile order surge transformed stores into chaotic pickup locations that alienate the customers willing to pay premium prices for ambiance.
China, which was supposed to become Starbucks’ largest market, has disappointed consistently. Local competitors offer comparable quality at lower prices, and nationalism has created headwinds for American brands broadly.
Labor relations have become contentious, with unionization efforts creating operational uncertainty and potential cost pressures. Financial Times coverage documented the extent of worker grievances and their potential impact on store-level execution.
My Take: Starbucks requires patience I’m not prepared to exercise. The turnaround thesis depends on execution from a management team still defining its strategy. Better opportunities exist elsewhere.
Peloton (PTON): The Cautionary Tale Continues
Peloton serves as a reminder that pandemic beneficiaries weren’t necessarily good businesses—just temporary demand surges mistaken for sustainable competitive advantages.
The connected fitness company continues bleeding cash, losing subscribers, and searching for a viable path forward. Various strategic alternatives have been explored and abandoned. The hardware business faces commoditization while the subscription content competes with free YouTube workouts and lower-cost alternatives.
Recent quarters have shown stabilization, but stabilization at depressed levels isn’t victory. Investopedia analysis questioned whether Peloton can generate sustainable profitability even under optimistic scenarios.
My Take: Peloton is uninvestable for anyone focused on fundamental value. Speculative short-covering rallies create short opportunities rather than buying opportunities. Avoid.
Sector Comparison Table
| Stock | Ticker | Rating | P/E (Fwd) | Q4 EPS Est. | Analyst Target | Risk Level |
|---|---|---|---|---|---|---|
| Amazon | AMZN | Strong Buy | 35x | $1.82 | $230 | Moderate |
| Costco | COST | Buy | 52x | $3.79 | $1,050 | Low |
| Royal Caribbean | RCL | Buy | 14x | $1.45 | $250 | Moderate-High |
| Chipotle | CMG | Buy | 47x | $0.28* | $70 | Moderate |
| Home Depot | HD | Buy | 24x | $3.02 | $425 | Low-Moderate |
| Nike | NKE | Hold | 27x | $0.85 | $82 | Moderate |
| Dollar General | DG | Hold | 14x | $1.58 | $95 | High |
| Tesla | TSLA | Hold | 85x | $0.75 | $285 | Very High |
| Starbucks | SBUX | Hold | 25x | $0.80 | $105 | Moderate-High |
| Peloton | PTON | Sell | N/A | -$0.28 | $5 | Very High |
*Post-split adjusted
Investment Strategy and Outlook: Positioning for What Comes Next
Let me synthesize these individual assessments into an actionable framework.
The consumer discretionary sector offers genuine opportunity—but selection matters enormously. The days of rising-tide-lifts-all-boats sector allocation ended when easy monetary policy gave way to higher rates and discriminating consumers.
Quality Over Value: This isn’t the environment to bottom-fish in struggling retailers hoping for mean reversion. Companies with pricing power, strong balance sheets, and differentiated offerings will capture share from weakened competitors. Pay up for quality and sleep better.
Barbell Your Exposure: I’m simultaneously overweight premium experiences (cruises, travel) and defensive growth (Costco, Amazon). The middle—moderately priced discretionary goods without brand differentiation—faces the most competitive pressure.
Watch the Consumer Credit Data: Consumer credit card delinquencies have ticked higher, though from low bases. If this trend accelerates, discretionary spending will compress faster than optimistic Q4 estimates assume. Federal Reserve consumer credit data deserves monthly monitoring.
Respect Earnings Season Volatility: Individual stock moves of 10-15% post-earnings are common in this environment. Size positions appropriately, and consider using options strategies to define risk around binary events.
Think Beyond Q4: The most compelling opportunities emerge when short-term challenges create long-term entry points. I’m building watchlists of quality companies that might stumble—not because their businesses are impaired, but because expectations grew excessive.
My twelve-month outlook for consumer discretionary remains constructive but selective. The sector offers alpha generation potential for active investors willing to do the work distinguishing winners from losers. Passive XLY exposure captures the sector beta but misses the dispersion opportunity.
Conclusion: The Earnings Season That Separates Pretenders From Contenders
Q4 earnings season will reveal truths that year-to-date performance has obscured.
Some consumer discretionary stocks trading at premium valuations will justify those multiples with blowout results and confident guidance. Others will stumble, exposing the fragility beneath headline numbers. The gap between expectations and reality drives stock prices—and that gap appears wider in consumer discretionary than any other sector I’m tracking.
I’ve shared my highest-conviction ideas: Amazon and Costco for foundational quality, Royal Caribbean and Home Depot for cyclical exposure, Chipotle for growth. I’ve flagged my concerns: Nike’s competitive erosion, Tesla’s valuation risk, Dollar General’s execution failures, Starbucks’ identity crisis, Peloton’s existential uncertainty.
Your job now is to stress-test these conclusions against your own research, risk tolerance, and portfolio construction needs. No analyst gets every call right—humility about uncertainty is essential to long-term investing success.
What I know with confidence: the consumer discretionary stocks that emerge from Q4 earnings season as winners will compound that advantage through 2025 and beyond. Those that disappoint will face extended periods of multiple compression and investor skepticism.
Choose wisely. The market is offering a clarifying moment—don’t waste it chasing yesterday’s winners or averaging down into deteriorating businesses.
The consumer is speaking through their spending choices. Are you listening?
Frequently Asked Questions (FAQ)
What are consumer discretionary stocks?
Consumer discretionary stocks represent companies selling non-essential goods and services that consumers purchase when they have disposable income. This sector includes retailers, restaurants, hotels, automakers, entertainment companies, and luxury goods manufacturers. Performance typically correlates with economic cycles and consumer confidence levels.
Which consumer discretionary stocks are best for Q4 earnings?
Based on current analyst ratings, earnings revisions, and fundamental strength, Amazon (AMZN), Costco (COST), Royal Caribbean (RCL), Chipotle (CMG), and Home Depot (HD) appear best-positioned for Q4 earnings outperformance. Each demonstrates pricing power, strong execution, and favorable demand trends heading into the holiday quarter.
Why do consumer discretionary stocks perform differently in Q4?
Q4 represents peak seasonality for consumer discretionary stocks due to holiday shopping, travel, and entertainment spending. Companies generate disproportionate revenue and earnings during this quarter, making year-over-year comparisons particularly meaningful. Weather, consumer confidence, and promotional intensity all influence Q4 performance variance.
What economic factors affect consumer discretionary stocks?
Consumer discretionary stocks respond to employment levels, wage growth, consumer confidence, interest rates, inflation, housing market conditions, and overall GDP growth. Federal Reserve policy significantly impacts financing costs for big-ticket purchases. Political and trade policy uncertainty can also influence consumer and business spending decisions.
Should I buy consumer discretionary stocks before earnings?
Buying before earnings introduces binary event risk—stocks can move sharply in either direction regardless of fundamental quality. Consider building positions gradually, using limit orders on pullbacks, or employing options strategies to define risk. Long-term investors focused on quality companies can use earnings volatility as entry opportunities rather than timing events.
Discover more from The Economy
Subscribe to get the latest posts sent to your email.



Palantir’s appeal in 2026 is not simply that it uses artificial intelligence. Many companies do. The market debate is whether the business can convert enterprise interest in AI into deployed systems that influence real operations, generate recurring customer spending and expand margins. Its latest published results show considerable momentum, while also raising the difficult question of how much growth investors should reasonably expect to continue.
The company’s software spans data integration, analytical workflows and AI-assisted operational decision-making. Buyers do not necessarily want another stand-alone chatbot. They want systems that connect permissions, proprietary information, business processes and people. That is the economic opportunity behind Palantir’s Artificial Intelligence Platform, or AIP. The term “AI sovereignty” appears prominently in company messaging, but buyers’ need to control where data goes and who can use it is a concrete business concern.
The fact check starts with reported figures
Palantir’s August 3 earnings release reported $1.935 billion in revenue for the quarter ended June 30, 2026, up 93% year over year. U.S. commercial revenue was $764 million, up 149%; U.S. government revenue was $809 million, up 90%. The company also reported $912 million in GAAP operating income and $1.194 billion in adjusted operating income. The GAAP and adjusted values use different definitions and must not be presented interchangeably.
These rates help explain the high visibility of PLTR among traders. But a growth rate describes the past period, while a share price discounts an uncertain sequence of future periods. A company can exceed every operational target and still disappoint an investor who assumed even more aggressive future progress. Readers should therefore assess the revenue base, customer retention, contract terms and operating cash flows alongside headline percentages.
What AIP customers may actually be buying
Business AI is often less about a model’s ability to produce fluent text than about whether it can operate within a secure workflow. An organization needs access controls, audit trails, approved data sources, validation of outputs and integration with existing software. These tasks are unglamorous, but they can determine whether a pilot becomes a permanent budget item.
Palantir argues that its platforms help customers move from prototypes into operational use. That is a company position, which can be evaluated with disclosed customer wins, recurring revenue and contract expansion. The more valuable deployment is one tied to a recurring process that management continues funding because it saves time, increases throughput or reduces losses. Projects based on temporary excitement without measurable benefits face greater renewal risk.
Why U.S. commercial growth deserves a separate lens
The company’s U.S. commercial growth has outpaced its global total, suggesting enterprise adoption is a leading driver. Yet percentage growth can eventually normalize as a revenue base becomes larger. Investors need both year-on-year and sequential comparisons, plus details about new-customer acquisition versus expansion of existing accounts. The latter can signal that a product grows more deeply embedded in customer operations.
Palantir disclosed $3.373 billion of total contract value signed in the quarter, with $2.132 billion attributed to U.S. commercial deals. The company explains that TCV can include options and is not equivalent to immediately recognizable or guaranteed revenue. Palantir SEC release and contract definitions. Responsible reporting should never sum contract announcements as if they were all cash collected in the current quarter.
The difference between a sales pipeline and a moat
A large potential contract can create investor enthusiasm but does not automatically mean a customer cannot replace the software. The durability of a platform business may depend on integration complexity, data quality, employee training, switching costs, procurement rules and the economic savings customers experience. Some contracts may be terminated or re-competed; others may expand for years.
A stronger moat test asks whether an enterprise would still renew when rival vendors offer cheaper models or broadly available AI tools. If Palantir controls crucial orchestration and monitoring layers, generic improvements in AI models could increase its value. If customers can reproduce the functionality through internal platforms, competitive pressure could rise. Both outcomes are plausible and should be monitored through retention and deal economics rather than assumed.
Government business brings scale—and scrutiny
Public-sector deals are an important component of Palantir’s business. They can support long deployments and mission-critical functionality, but they also invite debate about procurement transparency, privacy, national security and public dependence on particular vendors. The company faces scrutiny over some government use cases and contracts abroad; these debates are relevant to revenue risk even when the stock-market narrative focuses on AI adoption.
In October, the Financial Times reported on the cost and extension of Palantir’s work connected with the U.K.’s Homes for Ukraine program, a story that highlighted concerns around technology dependence and procurement choices. The report is relevant context, not evidence that every Palantir government contract is improper.
Companies working with public institutions must navigate political transitions, budget decisions and procurement requirements. An investor should ask how much revenue is exposed to a handful of large buyers and how the company manages security, compliance and public trust. Customer concentration can improve initial growth but also increase vulnerability to policy changes.
Cash flow is central to the valuation argument
Palantir’s reported $1.216 billion cash from operations and $1.220 billion adjusted free cash flow in Q2 provide evidence that its rapid growth was not solely a headline about future demand. These are company-reported measures, and adjusted free cash flow should be read alongside its reconciliation and exclusions.
Margins may reflect favorable software economics, but sustaining them while expanding staff, infrastructure and international reach is an open question. Investors should examine stock-based compensation, cash conversion, deferred revenue, capital requirements and recurring contract mix. A business with exceptional margins today may face new spending needs as deployment demands evolve or competition intensifies.
What would justify investor confidence?
Evidence would include repeated quarterly performance, durable commercial renewals, increasing value from existing customers, lower customer acquisition friction, limited dependence on any one buyer and transparent profitability measures. Palantir forecast third-quarter 2026 revenue of roughly $2.160 billion to $2.164 billion in its August release; this is management guidance, not a reported October result.
A skeptical reader may ask whether valuation already presumes these favorable developments. That is a reasonable question even when operational performance is exceptional. Conversely, strong growth can sometimes justify a high multiple if durability and market opportunity are underestimated. The key is to specify the evidence necessary for either interpretation.
The FinTwit signal, with context
Palantir appeared fourth by composite buzz score in an October 10 snapshot of one finance-specific X tracker. Such rankings reveal subject interest within a methodology, not a directional price forecast. Adanos. Social excitement can increase short-run share volatility, while enterprise contracts are usually negotiated over much longer periods. This mismatch between the market’s daily clock and business development’s quarterly or yearly clock explains why a fast-growing company can remain a battleground stock.
A useful weekly editorial dashboard would update company disclosures, major contract wins, analyst estimate changes and notable regulatory developments separately. That structure prevents repeated opinion pieces from drifting into unsourced hype.
Frequently asked questions
What did Palantir report for Q2 2026 revenue?
$1.935 billion, up 93% year over year, according to its August 3 SEC-hosted results.
Is AIP the same as a consumer chatbot?
No. Palantir positions its AI platform around enterprise data integration and operational workflows rather than a consumer-facing assistant alone.
Does total contract value equal booked revenue?
No. Contract values may include options or future periods and must be separated from recognized revenue and collected cash.
Why does government procurement matter to PLTR?
Government buyers can be major customers, but political, compliance, privacy and procurement decisions may affect contracts and future growth.
Discover more from The Economy
Subscribe to get the latest posts sent to your email.

NVIDIA remains near the top of finance-focused social discussion because the company sits at a critical point in the artificial-intelligence supply chain. AI developers need compute to train and serve models; cloud operators must buy, install and power that compute; and semiconductor suppliers try to capture part of the resulting investment. Attention alone would not sustain the narrative. NVIDIA’s disclosed revenue growth gives the debate a substantial factual anchor.
For the fiscal quarter ended July 26, 2026, NVIDIA reported $96.2 billion in revenue, a 106% increase from a year earlier. Its Data Center segment generated $89.0 billion, up 117% year over year, and the company reported 75.0% GAAP and non-GAAP gross margins. NVIDIA calls this fiscal second-quarter 2027, although it was reported in August 2026. That accounting distinction matters for readers searching “Nvidia Q2 2026.” NVIDIA investor-relations release.
These results explain why NVIDIA can remain a central market topic even when investors become more skeptical about AI valuations elsewhere. But revenue recognized by a chip supplier is not the same thing as return on investment earned by the eventual chip user. The next phase of the story asks whether the ecosystem can turn spending into durable profits.
A systems business, not just a chip business
The simplest NVIDIA narrative focuses on graphics processing units. The more important business model also includes networking, software, supporting systems, developer tools and the coordination of specialized infrastructure. Large-scale AI deployments require accelerators, efficient communication between devices, memory, data movement and stable software environments. A buyer may prefer a tightly integrated technology stack if it reduces deployment difficulty or accelerates useful workload output.
This approach can create switching costs. Teams have invested in optimization, operations and skills built around supported platforms. Yet the lock-in argument should not be treated as absolute. Competitors, alternative accelerators, specialized application-specific chips and changes in model architecture could shift portions of AI computing workloads over time. Customers with the largest budgets also have incentives to avoid relying on a single vendor indefinitely.
Why inference economics could redefine leadership
Early AI commentary emphasized training larger models. Inference—the repeated process of generating answers, images or other model outputs—has become an equally important commercial question. Inference is where a successful product can incur expenses on every interaction. A system that reduces cost per useful response can help an AI service attract customers without losing money on every additional user.
NVIDIA has discussed new platforms including Blackwell and Rubin in the context of performance and inference efficiency. Product claims and performance comparisons need independent workload-by-workload interpretation; a manufacturer benchmark does not establish the effective cost of every customer deployment. NVIDIA fiscal-2026 release and Rubin overview.
The relevant metric is not simply peak speed. It is useful work delivered per unit of equipment, electricity, cooling and operator expense, at a utilization rate customers can actually sustain. If model providers find ways to do the same work with less compute, demand can change even while AI adoption continues growing.
Data-center electricity is now a growth constraint
Power availability can make or break an AI project regardless of how many chips a company can purchase. Data centers need grid interconnections, transformers, backup capacity, cooling systems and a location where the expected demand can be served economically. A major application may be ready for deployment while the physical site remains unavailable for months or longer.
A Reuters report on Morgan Stanley’s analysis indicated that NVIDIA and Broadcom may be better placed than some secondary suppliers to weather a near-term data-center power squeeze. That conclusion is an analyst assessment, not a guarantee that semiconductor orders are immune to delays. Memory, optics, utilities, generators and construction groups can experience different demand patterns as projects slip. Reuters power-constraint reporting.
For an investor, the power issue also creates a timing mismatch. Some equipment sales may precede the customer’s successful commercialization by years. Strong supplier results can coexist with uncertainty about downstream payback.
The financing question behind the boom
The largest cloud platforms can fund investment through operations, borrowing and balance-sheet resources. Smaller AI companies may depend more heavily on outside capital. That difference becomes important when interest rates rise, equity valuations compress or lenders demand stronger evidence of revenue. Reuters has examined how rising AI investment obligations are putting pressure on major technology companies’ expected free cash flows. Reuters capex and cash-flow analysis.
NVIDIA benefits when customers choose to build. It does not necessarily benefit from every dollar customers spend on property, electricity, water or networking. Conversely, if customers can earn sufficient money from AI services, they may buy additional systems over many hardware generations. The value of the hardware market depends on a durable customer profit pool rather than a permanent willingness to spend regardless of returns.
Export controls and the geopolitics of AI computing
Powerful semiconductors are now closely linked to national-security policy. The United States restricts certain advanced computing exports and scrutinizes transactions that may circumvent those restrictions. Compliance depends on product specifications, destination, end user and evolving rules. A semiconductor sale may be attractive commercially yet restricted legally.
In October, Reuters reported a guilty plea by a contractor tied to a scheme to divert AI servers containing restricted NVIDIA chips to China. That is an enforcement case, not a finding that NVIDIA itself participated in wrongdoing. It underscores how hardware demand, global supply chains and export enforcement intersect. Reuters October 9 report.
The business implications can cut both ways: restricted markets may limit sales; compliance costs rise; domestic or friendly-country alternatives may receive more support. Predictions require attention to individual licensing changes, not a generic claim that the entire international market is open or closed.
How to read an earnings surprise sensibly
A company’s profit can grow rapidly while its stock produces a disappointing return if earlier expectations were even higher. NVIDIA’s disclosed 106% revenue growth should therefore be assessed alongside market valuation, sales guidance, gross-margin direction, customer concentration and the pace of order conversion. Analysts may correctly predict strong operational results yet misjudge how much investors were already paying for them.
Compare sequential and year-on-year growth: they answer different questions. Year-on-year figures show scale relative to a prior cycle; sequential numbers reveal the latest quarter’s pace. Check whether guidance includes already contracted shipments, assumptions about export approvals and product-transition effects. There is no single number that resolves every valuation question.
What would weaken the bull case?
Several mechanisms could pressure the outlook without disproving AI’s long-term utility. Hyperscalers could slow spending because of weaker cash flow. Customers could become better at running models on less hardware. Competing systems could take share in selected applications. Export rules could restrict sales. Manufacturing yields or packaging constraints could alter margin economics. Or customers could delay receiving systems because power infrastructure is unavailable.
The counterargument is that lower inference costs may stimulate additional usage. The history of computing repeatedly shows efficiency improvements expanding the market for useful applications. The unresolved question is the balance between lower cost per task and the number of tasks businesses can justify paying for. Investors should treat both as scenarios, not facts already decided.
A useful scoreboard for late 2026
Watch NVIDIA’s next official results for data-center growth, margin direction, inventory and receivables, product availability, company guidance and commentary about customer types. Separately track cloud-provider capex, AI product revenue, data-center utility agreements, model efficiency improvements and national rules for advanced chips. These indicators tell different parts of the same story.
An evidence-based article should also avoid declaring NVIDIA “the most discussed company on X.” The Adanos finance-specific snapshot observed October 10 placed NVDA second on a composite buzz score after SPCX, with the caveat that its results represent a proprietary sample. Adanos tracker and methodology.
Frequently asked questions
What was Nvidia’s latest quarterly revenue as of October 10, 2026?
Its latest disclosed fiscal Q2 2027 revenue was $96.2 billion for the quarter ended July 26, 2026. Fiscal year labels do not match calendar-year quarter labels.
Why does AI inference matter for the stock?
Repeated commercial use of AI services could create ongoing computing demand, but price competition and hardware efficiency may reduce cost per transaction.
Does a power shortage always hurt Nvidia?
Not necessarily immediately. It can delay downstream deployments, and effects differ across suppliers and contractual arrangements.
Is strong revenue growth proof the shares are inexpensive?
No. Equity value depends on future profits, risk, discount rates and already embedded expectations, not on one historic growth percentage.
Discover more from The Economy
Subscribe to get the latest posts sent to your email.

When Washington doubles down on reshoring corporate capital, export-reliant trade partners typically prepare for impact. However, Ireland’s Prime Minister Micheál Martin is turning trade pressure into bilateral leverage—using U.S. “America First” incentives to sharpen Irish competitiveness while securing high-profile tariff rollbacks for staple Irish exports.
Following a landmark pledge from President Donald Trump to eliminate the 10% U.S. duty on Irish whiskey, Irish diplomats have locked their sights on the next major trade concession: Kerrygold butter, a commodity generating over $1 billion in annual U.S. retail sales.
The Bilateral Investment Balance Sheet
Contrary to popular belief that transatlantic trade flows primarily benefiting European exporters, the economic relationship between the U.S. and Ireland operates as a two-way investment engine. Official data from the U.S. Bureau of Economic Analysis ranks Ireland among the top five foreign direct investment (FDI) contributors to the U.S. economy.
| Economic Metric | U.S. Capital in Ireland | Irish Investment in the U.S. |
| Total Investment Position | ~$460+ Billion | ~$390+ Billion |
| Employment Footprint | ~210,000 Irish workers | ~200,000 U.S. workers |
| Key Industries | Pharmaceuticals, Tech, MedTech | Agrifood, Health Sciences, Tech Services |
| Enterprise Presence | ~950 U.S. Multinationals | ~800 Irish Companies |
Data supported by Enterprise Ireland demonstrates that Irish-owned firms expanded their U.S. payrolls significantly across regional manufacturing and tech hubs, creating a dual-dependency that insulates Dublin from hostile tariff measures.
From Doonbeg to Distilleries: The Whiskey Breakthrough
The political momentum behind recent tariff exemptions crystallized during President Trump’s visit to his Doonbeg golf resort in County Clare, Ireland. Following direct representations by Taoiseach Micheál Martin and Irish golfer Shane Lowry, the administration committed to stripping away duties on Irish spirits.
As reported by Global Banking & Finance, the announcement removed a 10% import tariff that had been applied to EU spirits, returning Irish whiskey exports toward a zero-for-zero trade parity.
“He’s certainly had success in terms of the investments that companies are making in the U.S.,” stated Micheál Martin. “In a way, it makes us more competitive. We’ve analyzed it and said, ‘OK, that’s a new challenge. How do we double down, make ourselves more competitive, and stay agile?'”
Kerrygold in the Crosshairs: The Next $1 Billion Trade Target
With spirits secured, Ireland’s diplomatic and commercial apparatus is pivoting toward agricultural exports—specifically dairy products managed by Irish dairy cooperative Ornua.
- Market Scale: Kerrygold stands as the second-largest butter brand by value in the United States, crossing the $1 billion retail sales threshold in 2025.
- Economic Stake: Food and drink exports form the backbone of Ireland’s rural economy. Agricultural tariffs directly impact primary producers across all 26 counties.
- Regulatory Leverage: As Ireland leads discussions during its presidency of the Council of the European Union, reducing regulatory friction and bureaucracy for U.S. technology imports serves as potential bargaining leverage for agricultural parity.
EU Bureaucracy vs. Transatlantic Competitiveness
A central theme in ongoing U.S.-EU discussions is European regulation. American MNEs routinely cite European red tape as a primary barrier to capital deployment.
According to official briefings from the European Commission, the EU and U.S. have been working on reciprocal tariff reductions across industrial goods, aerospace, and generic pharmaceuticals while streamlining sanitary certification processes. Ireland is using its influence within the EU Council to prioritize deregulation, aligning European business practices more closely with U.S. capital efficiency.
By framing American domestic investment pushes not as a threat, but as a benchmark for national agility, Ireland maintains its position as the premier European bridgehead for U.S. multinationals while methodically clearing tariff hurdles for its own flagship exports.
Discover more from The Economy
Subscribe to get the latest posts sent to your email.

Stock Market Crash in 2026? Warning Signs, Scenarios and a Calm Investor Checklist

Peso Mexicano vs Dólar Estadounidense: A Practical USD/MXN Guide for October 2026

Is the Stock Market Open on Columbus Day 2026? NYSE, Nasdaq and Bonds Explained

Concert Ticket Prices in 2026: Dynamic Pricing, Fees and How to Buy Safely

High-Yield Savings Accounts in 2026: How to Compare APY Without Chasing a Headline

EU-China Trade Deal 2026: How Beijing and Brussels Avoided a Trade War—and Who Wins

Social Security 2027 COLA Announcement: Date, Formula and What Retirees Should Check

China’s AI Microdrama Boom: How Beijing Is Reshaping Global Media

Q3 2026 Earnings Preview: Can Record Profit Expectations Keep Wall Street’s Rally Alive?

Russia Diesel Deal 2026: Oil Prices and Inflation Risks

Fed Rates 2026: Treasury Yields, Bonds and SGOV Explained

S&P 500 Market Breadth 2026: Weak Rally or Rotation?

The AI Capex Boom: Data Centers Reshaping Growth

Palantir Stock in 2026: Extraordinary AI Growth

PSX Forecast 2026: KSE-100, IMF Reviews & Geopolitics

Middle East War Economics 2026: Oil Prices & Energy Markets

China Stocks Today: Are Big Economies in Asia Nearing a Market Bottom?

Crypto Daily Outlook: Bitcoin, Altcoins, and the Future of Decentralized Finance

Global Pension Systems Ranked: The World’s Best and Worst Retirement Frameworks

World’s Largest Economies: Ranking the Top Global Powers

Elon Musk’s Next Moves: Disrupting the 2026 Global Economy

Pakistan Economy 2026: Inside the SBP’s Balancing Act

GasBuddy Market Insights: How Crude Price Shifts Impact Local Fuel Cost Averages

World Bank & IMF Reports 2026: Why the “3% Growth” Consensus Is Actually a Debate

Crude Oil & Petroleum Market Analysis: OPEC+ Decisions and Price Forecasts

Global Equity Market Divergence: US Tech vs. European Dividend Stocks vs. Asian Growth

IMF & World Bank Global Economic Outlook: Growth Forecasts Across Europe and Asia

Silver Price Today: Why the Xi-Trump AI Standoff Is Fueling a Safe-Haven Rally
-

 Markets & Finance9 months ago
Top 15 Stocks for Investment in 2026 in PSX: Your Complete Guide to Pakistan’s Best Investment Opportunities
-

 Analysis8 months ago
Johor’s Investment Boom: The Hidden Costs Behind Malaysia’s Most Ambitious Economic Surge
-

 Analysis8 months ago
Top 10 Stocks for Investment in PSX for Quick Returns in 2026
-

 Banks9 months ago
Best Investments in Pakistan 2026: Top 10 Low-Price Shares and Long-Term Picks for the PSX
-

 Analysis8 months ago
Brazil’s Rare Earth Race: US, EU, and China Compete for Critical Minerals as Tensions Rise
-

 Investment9 months ago
Top 10 Mutual Fund Managers in Pakistan for Investment in 2026: A Comprehensive Guide for Optimal Returns
-

 Global Economy10 months ago
15 Most Lucrative Sectors for Investment in Pakistan: A 2025 Data-Driven Analysis
-

 Global Economy10 months ago
Pakistan’s Export Goldmine: 10 Game-Changing Markets Where Pakistani Businesses Are Winning Big in 2025