
UK Economy
UK Economy Defies Expectations: How Industrial Production Powered November’s Surprising 0.3% Growth
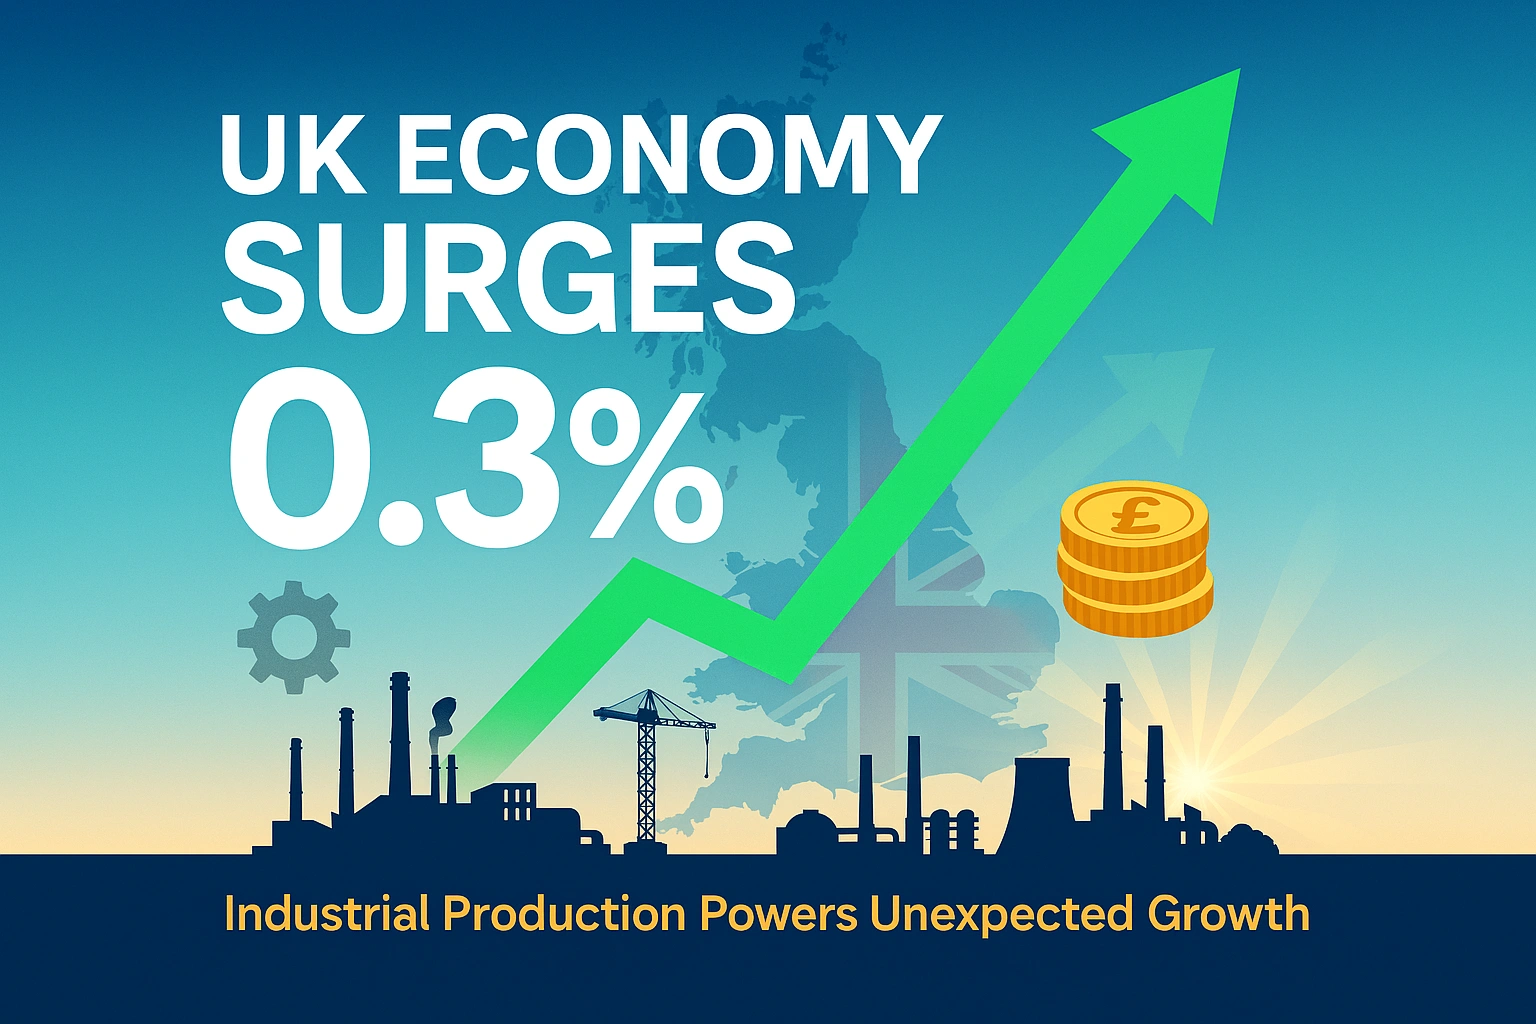
UK economy grows 0.3% in November 2024, beating forecasts as industrial production surges. Expert analysis reveals what this means for 2026 growth, Bank of England policy, and your financial future.
UK Economy Growth November 2024
Key Highlights:
- Economic growth: 0.3% in November (tripled 0.1% forecast)
- Primary driver: Industrial production surge of 1.1%, led by manufacturing recovery
- Manufacturing rebound: 25.5% increase in motor vehicle output following JLR cyberattack recovery
- Services growth: Solid 0.3% expansion, particularly in hospitality sector
- Significance: Five-month high suggesting economic resilience heading into 2026
- Outlook: Economists increasingly optimistic despite persistent challenges
Here’s something that doesn’t happen often in British economic data: genuine surprise. On a grey January morning, the Office for National Statistics dropped numbers that made economists do a double-take. The UK economy expanded by 0.3% in November 2024—triple what the forecasting consensus had predicted.
But what makes this figure particularly fascinating isn’t just that it beat expectations. It’s how it did so, and what that tells us about the underlying structural dynamics of Britain’s economic engine as we navigate through 2026.
The Numbers Behind the Surprise: More Than Just a Statistical Blip
Let’s cut through the noise. When economic data exceeds forecasts by 200%, skepticism is warranted. Yet the November figures tell a coherent story that aligns with recent on-the-ground developments across British industry.
According to official ONS data, production output surged by 1.1% month-on-month—a remarkable reversal after three consecutive months of decline. This wasn’t statistical noise or creative accounting. It represented real factories producing real goods, shipping real products to real customers.
The standout performer? Manufacturing output jumped 2.1%, with the transport equipment sector leading the charge with a staggering 10.7% increase. To put that in perspective, motor vehicle manufacturing alone posted a 25.5% monthly gain. That’s the kind of number you might see during a post-recession boom, not in the middle of uncertain economic times.
Jane Foley, head of FX Strategy at Rabobank, told CNBC the data represented a “big relief” following October’s unexpected contraction. But relief implies we were merely avoiding disaster. These numbers suggest something more interesting might be happening beneath the surface.
Industrial Production: The Unsung Hero of Britain’s Economic Story
For years, the narrative around British economic growth has centered on services—financial services, professional services, the knowledge economy. Manufacturing? That’s supposedly a declining sector, a relic of Britain’s industrial past.
November’s data challenges that assumption head-on.
The surge in industrial output wasn’t just about one sector having a good month. It reflected genuine operational capacity coming back online across multiple manufacturing subsectors. Yes, the recovery at Jaguar Land Rover’s facilities following the devastating September cyberattack—which cost the UK economy an estimated £1.9 billion—played a significant role. But that’s precisely the point.
When a single manufacturer can move the national GDP needle by getting back to work, it demonstrates how vital our industrial base remains. According to recent analysis, manufacturing still accounts for 9.4% of the UK economy, down from 17% in 1990 but still representing billions in economic output and hundreds of thousands of jobs.
The JLR recovery exemplifies modern manufacturing’s complexity and interconnectedness. The cyberattack didn’t just shut down JLR’s factories; it paralyzed over 5,000 organizations in the supply chain, from small component suppliers to logistics firms. When production resumed in early October, the economic ripple effects were substantial and immediate.
But here’s what the headline numbers don’t capture: manufacturing’s return isn’t about nostalgia for Britain’s industrial past. It’s about high-value, technologically sophisticated production in sectors like aerospace, pharmaceuticals, and luxury automotive—areas where the UK maintains genuine competitive advantages in global markets.
What This Means for the Average Briton: Beyond the Statistical Abstract
Economic growth figures can feel abstract, disconnected from daily reality. So let’s translate the 0.3% into something tangible.
First, employment. Manufacturing directly supports over 2.6 million jobs in the UK, but the multiplier effects extend far beyond factory floors. Every manufacturing job typically supports 2-3 additional positions in the supply chain, from logistics to business services. The industrial recovery signaled by November’s data suggests these jobs are becoming more secure, not less.
Regional implications matter enormously. The North West of England remains Britain’s manufacturing powerhouse with £29.5 billion in annual output. When manufacturing rebounds, these regions—often overlooked in London-centric economic narratives—benefit disproportionately.
For consumers, the picture is nuanced. Services output grew 0.3%, with accommodation and food service activities posting particularly strong gains of 2.0% after October’s decline. Translation? Hospitality is bouncing back, restaurants are filling seats, and consumer confidence appears to be stabilizing after months of anxiety around the Autumn Budget.
Yet challenges persist. Real household disposable income per capita remains barely 2% higher than pre-pandemic levels—a sobering reminder that while the economy might be growing, living standards are still under pressure.
The Political Economy Lens: Winners, Losers, and the Budget’s Shadow
Economics and politics are inseparable in 2026’s Britain, and November’s growth figures arrive at a politically charged moment.
Chancellor Rachel Reeves’ Autumn Budget 2025 announced £26 billion in tax increases—the third-largest tax-raising budget in post-war British history. The political gamble was explicit: short-term fiscal pain for medium-term economic stability and growth.
November’s data provides the first real test of that strategy. The Institute for Fiscal Studies noted that Reeves faced a smaller fiscal repair job than anticipated, with forecast downgrades partially offset by higher-than-expected inflation and wage growth. That created fiscal space for the Chancellor to increase her headroom to £22 billion—a prudent buffer against economic turbulence.
But here’s the political calculus: borrowing will be higher in each of the next three years under Reeves’ plans. Only after 2029-30 will borrowing decrease, enabled by back-loaded tax rises and spending restraint promises that conveniently come just before the next election. As the IFS tactfully noted, “one could be forgiven for treating that with a healthy dose of skepticism.”
November’s growth surge gives Reeves breathing room. It demonstrates economic resilience despite uncertainty around her fiscal changes. Manufacturing’s recovery, in particular, validates her emphasis on industrial strategy—supporting sectors where Britain has competitive advantages rather than spreading resources thinly across the entire economy.
Yet opposition voices remain vocal. Shadow Chancellor Mel Stride described growth as “still flatlining,” arguing that the government’s approach of raising taxes rather than controlling benefit expenditure weighs heavily on business confidence and economic dynamism.
The truth, as usual, sits somewhere in the middle. One month’s strong data doesn’t establish a trend. But neither does it represent a statistical fluke. It suggests the UK economy possesses more underlying resilience than recent pessimistic commentary acknowledged.
Storm Clouds on the Horizon: Why Optimism Must Be Qualified
Let’s inject some necessary realism. One good month doesn’t make a robust recovery, and significant headwinds remain clearly visible.
Inflation Remains Stubborn: Despite falling from its October 2025 peak of 3.6%, inflation sits at 3.2%—well above the Bank of England’s 2% target. The Bank of England has emphasized that underlying inflationary pressures, particularly in services, remain concerning.
Interest Rate Uncertainty: The Bank of England cut rates to 3.75% in December 2025, the fourth reduction of the year. But future cuts remain uncertain. Market signals suggest investors are less confident about the pace of easing in 2026 than economists’ forecasts would justify.
As Morningstar analysts noted, “Stubborn wage growth will constrain how far the Bank can cut.” Private sector regular pay growth remains around 4.9%—substantially higher than what’s compatible with sustained 2% inflation. Until wage pressures moderate convincingly, the Monetary Policy Committee will remain cautious about aggressive rate cutting.
Labor Market Weakness: Unemployment rose to 5.1% in August-October 2025—the highest since 2021. Youth unemployment hit 16.0%, the worst level since early 2015. These aren’t abstract statistics; they represent hundreds of thousands of people struggling to find work in an economy that’s supposedly growing.
Global Headwinds: The OECD warns of persistent global uncertainties, from trade policy volatility to geopolitical tensions. UK-weighted world GDP growth is projected below historical averages, limiting export opportunities for British manufacturers and service providers.
Productivity Puzzle: Perhaps most troubling, the OBR downgraded its medium-term productivity forecast from 1.3% annually to 1.0%—closer to the dismal post-2008 trend. Without productivity improvements, sustainable wage growth becomes impossible, and living standards stagnate.
Productivity remains Britain’s fundamental economic challenge. November’s industrial surge is welcome, but unless it translates into sustained productivity gains—doing more with less, innovating processes, adopting new technologies—it won’t fundamentally alter Britain’s economic trajectory.
Expert Forecast: Navigating 2026’s Economic Landscape
So where do we go from here? Let’s avoid the false precision of exact numerical forecasts and instead focus on scenarios and probabilities.
The Baseline Scenario (60% probability): Modest, uneven growth continues through 2026. Quarterly GDP growth oscillates between 0.1% and 0.3%, averaging around 1.2-1.5% annually. The Bank of England continues gradual rate cuts, bringing Bank Rate down to 3.0-3.25% by year-end. Inflation slowly converges toward target, reaching approximately 2.2% by Q4 2026.
Manufacturing maintains momentum as supply chains fully normalize post-JLR recovery, but services growth remains subdued amid fiscal tightening and cautious consumer behavior. Real wage growth turns positive but remains modest. Unemployment stabilizes around 5.0%.
This scenario aligns with current OBR projections and represents neither triumph nor disaster—just gradual, grinding progress.
The Optimistic Scenario (25% probability): Something clicks. Business confidence improves significantly as Budget uncertainty fades and clarity around taxation emerges. The industrial strategy gains traction, driving increased capital investment in high-productivity sectors. Planning reforms accelerate housing and infrastructure development.
Consumer confidence rebounds more strongly than anticipated as real wages rise and mortgage rates fall. Export growth surprises to the upside as UK competitiveness improves relative to struggling European peers. GDP growth reaches 1.8-2.0% in 2026, with unemployment falling back toward 4.5%.
In this scenario, November’s data marked an inflection point—the moment when Britain’s economic engine found its rhythm again.
The Pessimistic Scenario (15% probability): Global shocks derail fragile recovery. Escalating trade tensions, geopolitical instability, or financial market turbulence trigger renewed economic anxiety. Consumer and business confidence crater. The productivity downgrade proves prescient as structural weaknesses reassert themselves.
The Bank of England faces an impossible choice between cutting rates to support growth and holding firm to combat persistent inflation. Growth stalls, potentially turning negative in one or more quarters. Unemployment rises above 5.5%. Political stability fractures as the fiscal consolidation strategy collapses.
This isn’t prediction—it’s acknowledging tail risks that could rapidly materialize in our interconnected, fragile global economy.
For Investors and Business Leaders: The prudent approach is planning for the baseline while hedging against downside risks and positioning to capitalize on potential upside. That means:
- Maintaining liquidity to navigate potential turbulence
- Focusing on productivity improvements rather than relying on demand-side tailwinds
- Exploring opportunities in advanced manufacturing, where Britain maintains competitive advantages
- Watching inflation and wage data closely—these will determine the Bank of England’s policy trajectory
- Diversifying geographically to reduce dependence on UK-specific risks
For households, the advice is similar: maintain emergency savings, lock in mortgage rates if you can afford to, and don’t count on rapid improvements in living standards. But also don’t succumb to excessive pessimism. Britain’s economy has repeatedly demonstrated more resilience than commentators anticipated.
The Bigger Picture: Britain’s Economic Identity in Transition
Step back from the monthly data and a larger pattern emerges. Britain’s economy is undergoing a quiet but significant transition.
The service-sector dominance that defined Britain’s economy for three decades is giving way to something more balanced. Not a return to mid-20th-century manufacturing dominance—that ship sailed long ago—but recognition that high-value manufacturing and services are complementary, not competitive.
November’s data captures this transition mid-stream. Manufacturing’s strong performance wasn’t despite Britain’s service-oriented economy but because of it. Modern advanced manufacturing depends on sophisticated business services, logistics networks, financial infrastructure, and professional expertise.
The cyberattack that paralyzed JLR and the subsequent recovery both demonstrate this reality. Britain’s manufacturing sector survives and thrives not through mass production but through specialization, quality, and integration with global value chains. That model proved vulnerable to digital disruption but also capable of rapid recovery when systems came back online.
This is Britain’s economic reality in 2026: neither industrial powerhouse nor pure service economy, but something hybrid and evolving. Success requires embracing that complexity rather than retreating into simplified narratives about what “type” of economy Britain should be.
Final Analysis: Cautious Optimism with Eyes Wide Open
November’s 0.3% growth isn’t cause for celebration or complacency. It’s evidence of resilience—the kind that emerges from businesses adapting, workers persevering, and industrial capacity proving more robust than pessimists believed.
The industrial production surge matters not because manufacturing will save Britain’s economy single-handedly but because it demonstrates that multiple growth engines can fire simultaneously. Services, manufacturing, and construction can all contribute when conditions align favorably.
Yet fundamental challenges persist. Productivity remains stubbornly low. Living standards barely exceed pre-pandemic levels. Public debt continues rising. Inflation sits well above target. Global conditions remain uncertain. Political tensions around fiscal policy show no signs of abating.
The path forward requires acknowledging both progress and problems. November’s data suggests Britain’s economy possesses underlying strength that recent gloomy forecasts underestimated. That’s genuinely good news. But converting one month’s strong performance into sustained, inclusive, productivity-driven growth remains the challenge.
As we navigate deeper into 2026, the question isn’t whether November marked a turning point—monthly data rarely does. The question is whether policymakers, business leaders, and society more broadly can build on this resilience to create the conditions for sustainable prosperity.
The answer to that question won’t be found in GDP reports. It will be written in investment decisions, productivity improvements, policy choices, and the daily efforts of millions of Britons working to build a more prosperous future.
One thing is certain: those who dismissed Britain’s economic prospects based on a few months of weak data should reconsider. And those celebrating November’s figures as vindicating current policies should remember that economic performance isn’t determined by individual data points but by sustained trends, structural fundamentals, and the ability to navigate uncertainty with wisdom and adaptability.
November 2024’s surprise growth reminds us that economies—like people—are more resilient, complex, and unpredictable than our models suggest. That’s simultaneously humbling and encouraging. The path ahead remains uncertain, but it’s far from predetermined.
Sources: All data sourced from official UK government statistics, Bank of England publications, and analysis from premium economic research institutions including the OECD, IFS, and Institute for Government.
Discover more from The Economy
Subscribe to get the latest posts sent to your email.


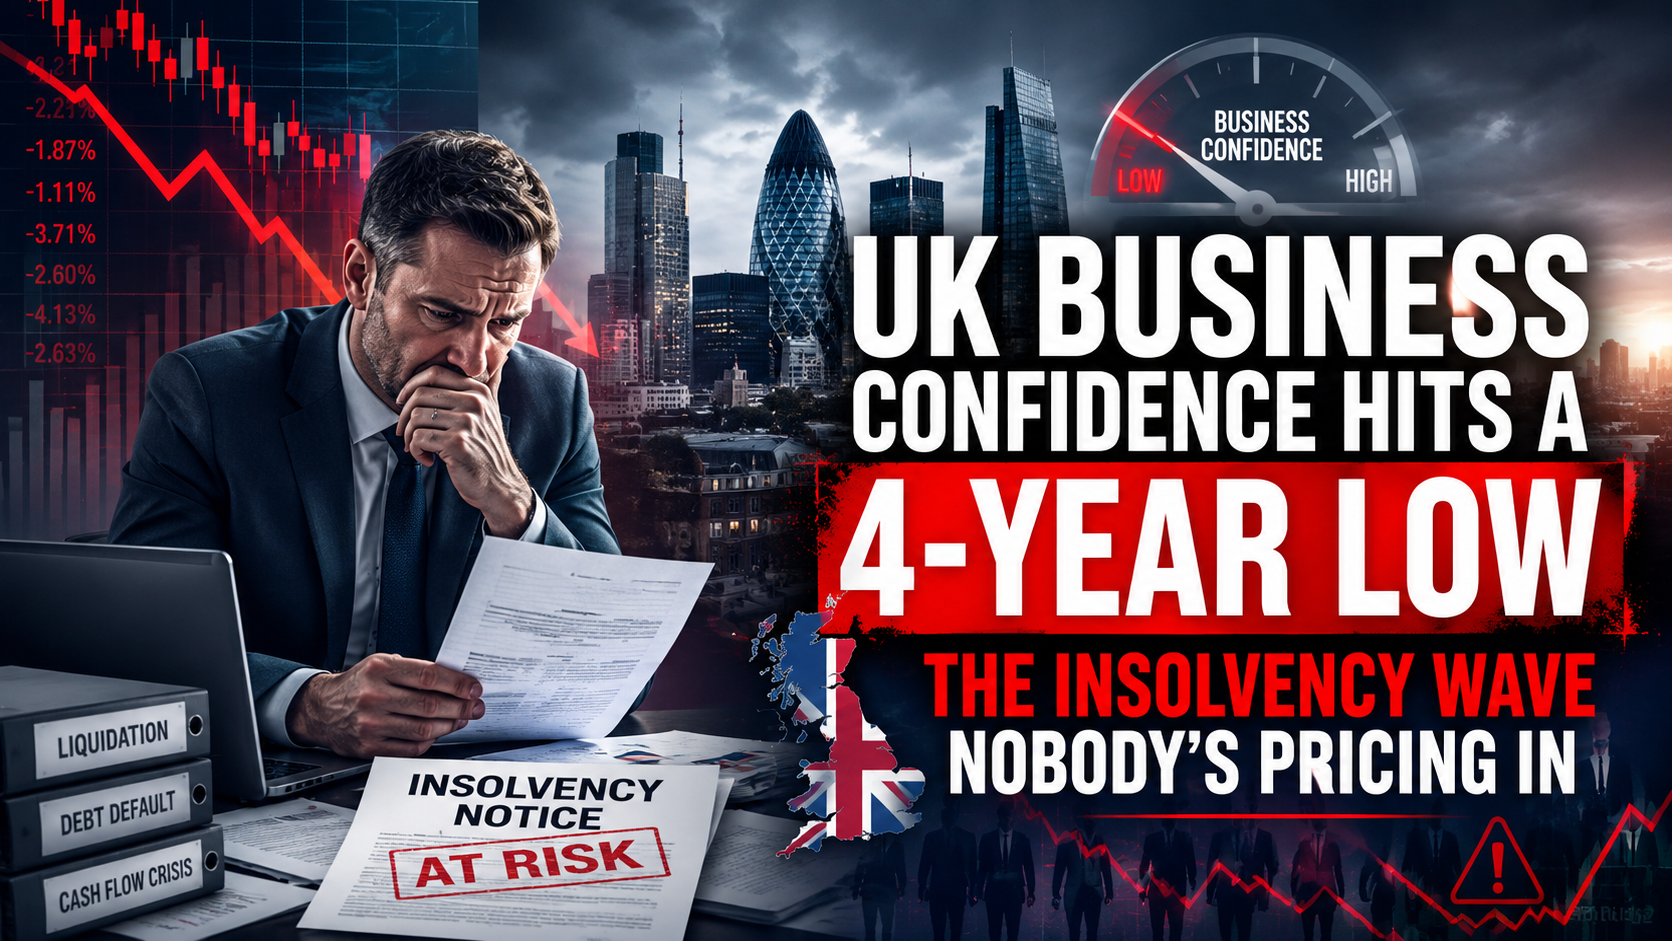
Britain’s headline economic data has looked defensible in 2026: the economy grew 0.6% in the first quarter, unemployment has stayed contained, and inflation, while above target, hasn’t spiralled. Yet underneath that data, business sentiment has collapsed to levels not seen since the post-mini-budget turmoil of 2022. The ICAEW Business Confidence Monitor recorded minus 14.6 for the second quarter — six consecutive quarters in negative territory, while the Institute of Directors’ sentiment index cratered to minus 61 in June, down from minus 53 in May, with the revenue-expectations sub-index collapsing to 11 from 27, its lowest reading of the year.
Most coverage has treated this as a generic “confidence is soft” story tied loosely to the Middle East conflict. The more precise and underreported explanation is a specific transmission mechanism: an energy-cost shock colliding with a Bank of England that cannot cut rates, arriving at the exact moment the UK is also absorbing a leadership transition.
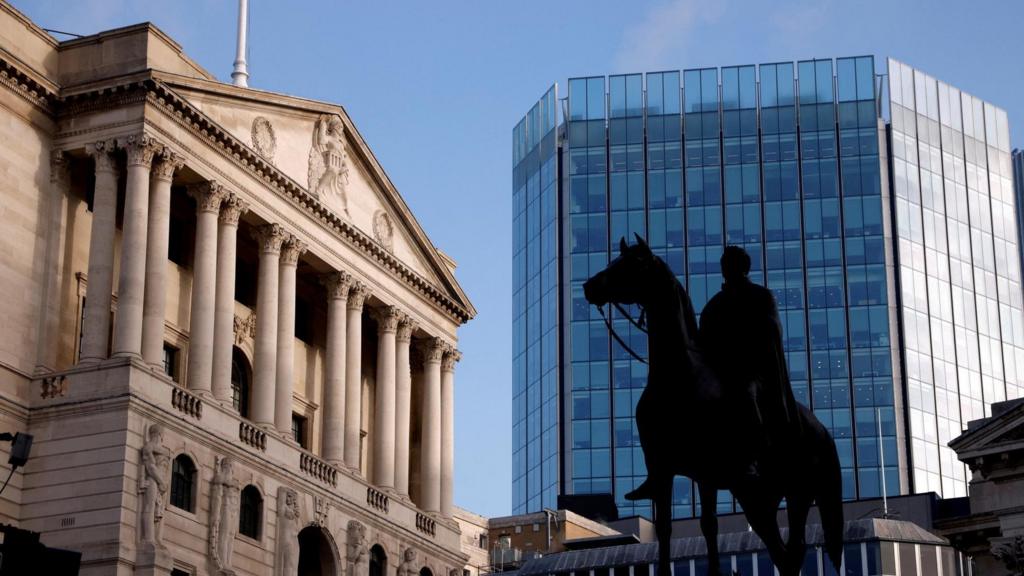
The Mechanism: Energy Costs Meet a Frozen Bank Rate
The Bank of England has held its base rate at 3.75% through the summer, and Governor Andrew Bailey has been explicit that rate cuts once priced in for 2026 are now “off the table.” His reasoning: the US-Iran conflict pushed energy prices higher for months, and even as oil has since retreated, the inflationary pressure from that period is still working through the pipeline. Chief Economist Huw Pill went further, warning rates might need to rise again if inflation — currently at 2.8%, above the 2% target — proves persistent, noting the economy may still be running beyond its productive capacity.
For businesses, this is the worst combination: input costs that rose sharply during the conflict period, a central bank unwilling to ease borrowing costs to compensate, and — according to the IoD survey — 72% of businesses reporting rising energy and fuel costs, with a fifth facing increases of at least 25%. Falling confidence in this context isn’t sentiment noise; it’s a rational response to a genuine margin squeeze with no near-term monetary relief in sight.
The PMI Confirms It’s Not Just Survey Noise
S&P Global’s composite Purchasing Managers’ Index — a harder, transaction-based confidence signal — fell to 49.4 in June, its lowest level in 14 months, with services activity slumping to a 41-month low of 48.7. Anything below 50 signals contraction. The drop was driven specifically by weaker consumer discretionary spending and businesses delaying planned expenditure — the textbook pattern of firms battening down ahead of an anticipated downturn rather than merely feeling gloomy.
The Political Overlay Nobody’s Pricing Correctly
Compounding the energy-and-rates squeeze is a leadership transition most international coverage underweighted. Prime Minister Starmer’s decision to step down following poor local election results has cleared the way for Andy Burnham to become Prime Minister, securing nominations from more than 320 Labour MPs. Business Secretary Peter Kyle has separately floated the possibility of legislating to force UK pension funds to invest more domestically if voluntary commitments fall short — a policy signal that, regardless of its merits, adds a layer of regulatory uncertainty for institutional allocators at precisely the moment firms are already retrenching.
The Insolvency Risk This Points Toward
The Credit Protection Association’s own read on the data is the most operationally useful: falling confidence “often leads businesses to delay investment, tighten spending and become slower or more selective in paying suppliers” — a dynamic that shows up in payment-delay data before it shows up in headline insolvency statistics. With hospitality alone reporting nearly a quarter of venues operating at a loss and pub closures running at nearly two a day in early 2026, the sectors most exposed to discretionary consumer spending and energy costs are the ones most likely to show up in insolvency data over the coming two quarters — a lagging indicator that the confidence surveys are already flagging in real time.
What to Watch Next
Three signals will determine whether this is a temporary dip or the start of a genuine downturn: whether the Bank of England’s July Monetary Policy Report signals a rate rise rather than a hold; whether new Prime Minister Burnham’s tax proposals add or remove uncertainty for business investment; and whether the services PMI stabilises above 50 once the residual energy-price effects from the Middle East conflict fully clear the inflation pipeline.
Discover more from The Economy
Subscribe to get the latest posts sent to your email.
The United Kingdom is heading into a second consecutive year of what economists at RSM UK are calling “stagflation-lite,” a combination of sluggish growth and rising inflation driven by an energy shock that traces directly back to the closure of the Strait of Hormuz. Bank of England Governor Andrew Bailey has said market pricing for two rate cuts this year looked reasonable before the Iran war lifted inflation risks, a shift in tone that now has traders debating whether the next move is a cut, a hold, or an outright hike, according to the Credit Protection Association’s business briefing.
Growth That Keeps Disappointing
The headline numbers tell a story of an economy losing momentum even before the latest shock fully lands. UK GDP grew just 0.1% at the end of 2025, revised down from an initial 0.2% estimate, and while first-quarter 2026 growth came in stronger at 0.6%, GDP then fell 0.1% in April, according to the Office for National Statistics data cited by CPA. Real household disposable income fell 0.8% in the first quarter as rising prices and higher taxes squeezed consumers, and business confidence data from the Institute of Directors showed its sentiment index falling to minus 61 in June from minus 53 in May, the lowest revenue expectations reading of the year.
RSM UK’s economic outlook frames the underlying trajectory starkly: GDP growth of just 1.0% this year, down from 1.4% in 2025, with inflation trending back toward 4%, “another dose of ‘stagflation-lite,'” the firm wrote in its assessment, per RSM UK. The firm’s base case sees inflation averaging 3.1% in 2026 and peaking around 3.5%, though it warns the risks are larger than usual given how heavily the outlook depends on developments in the Middle East.
The Energy Shock’s Direct Line to Household Bills
The mechanics of the inflation threat are unusually direct this time. A 13% rise in the energy price cap in July, combined with higher motor fuel costs and pass-through effects into food and supply chains, is expected to push inflation back toward 3.5% by year end, RSM UK’s analysis found. Oil prices, which had briefly dipped, rose to an average of over $100 a barrel within 30 days of the Iran conflict’s outbreak, though RSM UK notes the closure of the Strait of Hormuz represents the largest oil supply shock in history, and energy markets have so far reacted with relative calm, with oil now around $79 a barrel, well below the post-Ukraine invasion peaks.
That calm may not last. High global oil stocks have provided a buffer, but these are being run down at a record rate and could reach critical levels by September if the June peace deal between the US and Iran proves fragile, according to RSM UK’s forecast. KPMG UK’s separate economic outlook adds that the disruption to oil and gas supplies has already put upward pressure on energy prices, with headline inflation expected to rise from the third quarter onward as the spike gradually feeds through, per KPMG UK.
A Central Bank Caught Between Two Mandates
The Bank of England’s Monetary Policy Committee held its base rate at 3.75% through the first half of 2026, pausing a cutting cycle that had brought borrowing costs down from a 16-year high, according to NewsNow’s aggregated coverage of the situation. The next MPC decision falls on July 30, and while a base rate rise isn’t off the table, most analysts expect the committee to use the meeting to assess how durable the US-Iran peace deal proves before committing to any directional shift, according to mortgage-market analysis from Tembo Money.
The labor market complicates the calculus further. Unemployment has risen to around 5.1% to 5.2% as slower growth and higher employer National Insurance contributions weigh on hiring, even as pay growth cools from recent highs, easing the case for further rate cuts while simultaneously pressuring real household incomes, per NewsNow’s summary. KPMG UK’s modeling suggests that if the Middle East disruption proves short-lived and both oil and gas prices decline before summer’s end, inflation could still fall from a September peak toward the Bank’s 2% target by the second quarter of 2027, but that scenario now looks less certain than it did in the spring.
Politics Compounds the Uncertainty
Economic uncertainty is being amplified by domestic political developments. RSM UK’s outlook specifically flags the prospect of a change in Prime Minister as adding headwinds through higher borrowing costs and gilt yield pressure, noting that gilt yields are likely to remain elevated regardless of what the Bank of England does with the policy rate, given the UK’s particular sensitivity to inflation surprises and its unresolved political landscape. Hospitality businesses have separately renewed calls for a VAT cut, with almost a quarter of venues reportedly operating at a loss even before the latest energy price increases take effect, according to CPA’s reporting.
RSM UK’s own assessment of the year ahead captures the mood succinctly: the economy has grown at an average of just 1.2% through two turbulent years, and while early signs suggest that resilience will hold, the firm’s base case remains slower growth paired with rising inflation, not recession, but with a bigger-than-usual health warning attached to that call.
Discover more from The Economy
Subscribe to get the latest posts sent to your email.
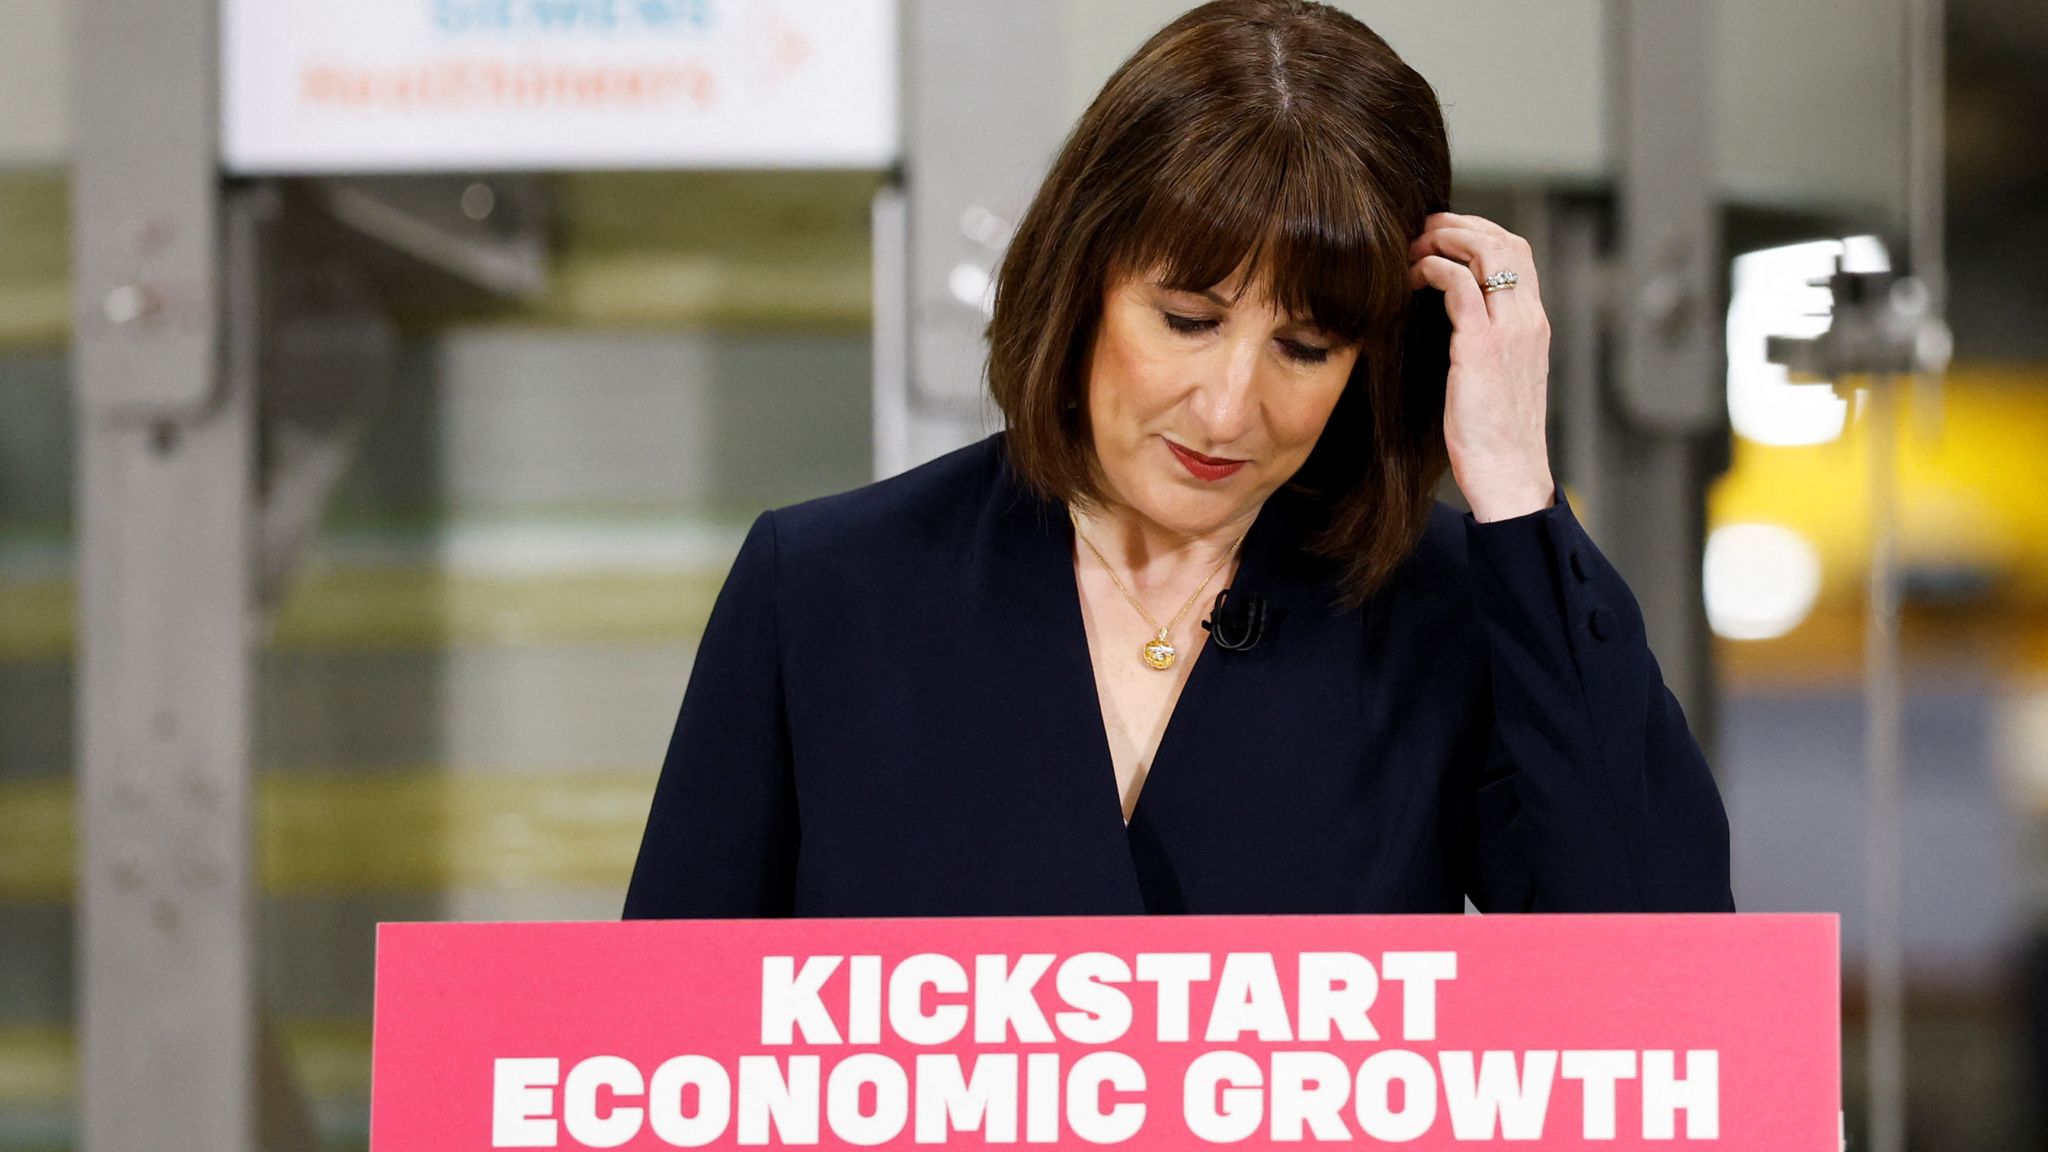
The British pound and UK markets are under pressure as reports suggest incoming Prime Minister Andy Burnham plans to demote Chancellor Rachel Reeves, while the Fed’s hawkish pivot tightens global financial conditions. Here is what Britain’s compounding crises mean for investors.
A Kingdom in Political and Economic Uncertainty
Britain entered June 25, 2026, facing a confluence of pressures that have become characteristic of the country’s post-Brexit decade: political instability at the top, persistent inflation, and a global monetary environment that is tightening at precisely the wrong moment for the UK’s already-strained public finances.
The BBC and the Financial Times reported that Andy Burnham — the sole contender to replace Keir Starmer as Prime Minister — would demote Rachel Reeves from Chancellor of the Exchequer to a more junior role should he become prime minister. The prospect of yet another change at the UK’s Treasury — the country’s fourth Chancellor in eight years — sent ripples through sterling and gilt markets.
The response was immediate and predictably fractious. Former Goldman Sachs Asset Management Chairman Jim O’Neill, a member of the House of Lords and informal advisor to Burnham, pushed back publicly on CNBC, suggesting the reports may not be “entirely accurate” and that there “shouldn’t be so much focus on who the person is.” The ambiguity itself was damaging — markets dislike uncertainty about who controls fiscal policy in the world’s sixth-largest economy.
The Bank of England’s Difficult Balancing Act
Against this political backdrop, the Bank of England faces one of its most difficult policy environments in decades. The Bank of England kept its base rate steady at 3.75% at its most recent Monetary Policy Committee meeting, acknowledging that it was “hard to predict” what will happen to prices as a result of the Iran war. Annual inflation in the UK was unchanged at 2.8% in May versus the previous month.
UK inflation at 2.8% is above the 2% target but below the 4.2% running in the United States, giving the MPC somewhat more flexibility than its American counterpart. However, the energy shock from the Hormuz crisis has driven transport inflation sharply higher, and the global backdrop — with the US Fed now signaling potential rate hikes — limits how far the Bank of England can diverge from American monetary policy without putting downward pressure on sterling.
A weaker pound raises import prices and adds to domestic inflation — the classic import inflation trap that has bedeviled UK monetary policy for much of the post-2016 period.
Fiscal Credibility: Reeves’ Legacy and Burnham’s Challenge
Rachel Reeves, love her or loathe her, represented continuity for markets. Her replacement — or even the uncertainty over her replacement — introduces a fiscal risk premium at a time when the UK’s debt burden is already elevated, public services are under strain, and the government’s fiscal rules are being tested by slow growth and high borrowing costs.
Whoever runs the Treasury in 2026 faces the same brutal arithmetic: limited room to spend, political pressure to invest in public services, and borrowing costs elevated by global monetary tightening. The question for markets is whether the incoming leadership has the credibility and the will to maintain fiscal discipline under that pressure.
Jim O’Neill’s intervention — telling markets not to fixate on the individual — suggests that those close to Burnham are aware of the optics and are attempting damage control. But in finance, perception often creates its own reality. UK gilt yields and sterling will be closely watched in the days ahead.
What Investors Should Watch
Sterling: Any confirmed report that Reeves is being demoted is likely to trigger a sterling selloff as markets reprice fiscal risk. Watch the GBP/USD rate closely.
UK Gilts: 10-year gilt yields remain the key indicator of market confidence in UK fiscal policy. A rise above 4.5% would signal genuine concern about fiscal credibility.
UK Equities: The FTSE 100’s heavy commodity exposure means it is actually partially shielded from domestic political risk — energy stocks have benefited from higher oil prices during the Iran crisis. The FTSE 250, more domestically focused, is more vulnerable to UK-specific political risk.
Bank of England Path: If the Fed hikes in 2026, the Bank of England will face pressure to follow, even if domestic conditions would otherwise argue for a hold. The global rate environment has become the binding constraint on UK monetary policy.
FAQ
Q: Who is Andy Burnham? Andy Burnham is the Mayor of Greater Manchester and, as of June 2026, the sole contender to replace Keir Starmer as Labour leader and UK Prime Minister. Known for his populist, Northern England-focused political brand, he has not yet fully articulated his economic programme.
Q: What has Rachel Reeves done as Chancellor? Reeves has focused on fiscal stability and attempted to restore market confidence in UK public finances following a period of turbulence. Her approach has been broadly orthodox — maintaining fiscal rules while trying to create space for public investment.
Q: What is the Bank of England’s current interest rate? As of June 2026, the Bank of England’s base rate stands at 3.75%, following a period of cautious easing. The next move is uncertain, with the MPC balancing persistent above-target inflation against the economic drag from the Iran war’s energy shock.
Discover more from The Economy
Subscribe to get the latest posts sent to your email.

Gulf Capital Retreat From Pakistan 2026: UAE Loan Freeze & What It Means

Pakistan’s Most Reliable Export Is Its People: Remittances Hit $41.6 Billion, Overtaking Total Exports

Indonesia’s Confidence Problem: Record Investment, a Sinking Rupiah, and a Widening Credibility Gap

Down But Not Out: Inside the Slow Sinking of Russia’s War Economy

China’s Growth Slips to a Four-Year Low: Why Beijing Still Won’t Pull the Stimulus Trigger

The Johor-Singapore Corridor: How Malaysia Became Southeast Asia’s AI Infrastructure Powerhouse

Canada’s Economy ‘On Pause’: Inside the CUSMA Deadline That Passed Without a Deal

Dubai’s Millionaire Magnet: How the UAE Turned Middle East Turmoil Into a Capital Safe-Haven Boom

Britain’s Sixth Prime Minister in a Decade: What Starmer’s Exit Means for Gilts, Sterling and Your Portfolio

Anthropic Offers Up to $600,000 Salary for Critical IPO Role as AI Giant Prepares for Wall Street Debut

EU Readies Crisis Team for Potential China Rare Earths Stand-Off as Supply Chain Risks Mount

Singapore Weighs Hedge Fund Tax Cuts to Counter Hong Kong’s Growing Financial Challenge

Facebook and Instagram Experience Global Outage

Inside the $1 Billion Tap-to-Pay Fraud Rings Targeting Banks and Retailers

Carry Trade Unwind 2026: How the Yen’s Snapback Triggered a Global Margin Call

AI Bubble Warning 2026: Why BIS, IMF and Bank of England Fear a Market Crash

BRICS De‑Dollarization Strategy Takes Shape with $15 Billion Local‑Currency Push

Male Labor Force Participation Rate 2026: Why Men Are Leaving & Economic Impact

Russia Bans Diesel Exports 2026: Global Fuel Market Impact Explained

The AI Super Bubble Is Ready to Burst

Strait of Hormuz Blockade 2026: Oil Prices Surge 9% as US-Iran Conflict Reignites

IMF Cuts Pakistan Growth Forecast, Raises Inflation to 8.4%

Private Credit Warning: Most BDCs Turn Unprofitable in 2026, Reuters Finds
Gulf Capital Retreat From Pakistan 2026: UAE Loan Freeze & What It Means

India Economic Rise 2026: How the Subcontinent Toppled Japan

Bitcoin $150k Milestone Achieved as US Sovereign Crypto Pivot Looms

Strait of Hormuz 2026: Why Markets Still Don’t Trust It’s Open

Chipmakers Just Lost 6.7% in Two Days: Inside the Great AI Trade Rotation
-

 Markets & Finance7 months ago
Top 15 Stocks for Investment in 2026 in PSX: Your Complete Guide to Pakistan’s Best Investment Opportunities
-

 Analysis5 months ago
Johor’s Investment Boom: The Hidden Costs Behind Malaysia’s Most Ambitious Economic Surge
-

 Analysis5 months ago
Top 10 Stocks for Investment in PSX for Quick Returns in 2026
-

 Analysis6 months ago
Brazil’s Rare Earth Race: US, EU, and China Compete for Critical Minerals as Tensions Rise
-

 Banks6 months ago
Best Investments in Pakistan 2026: Top 10 Low-Price Shares and Long-Term Picks for the PSX
-

 Investment7 months ago
Top 10 Mutual Fund Managers in Pakistan for Investment in 2026: A Comprehensive Guide for Optimal Returns
-

 Global Economy7 months ago
15 Most Lucrative Sectors for Investment in Pakistan: A 2025 Data-Driven Analysis
-

 Global Economy7 months ago
Pakistan’s Export Goldmine: 10 Game-Changing Markets Where Pakistani Businesses Are Winning Big in 2025