
Trade Analyzer
NBA Trade Analyzer Tools: Essential Business Intelligence for Franchises


Explore how NBA trade analyzer tools help franchises navigate the $154.65 million salary cap, optimize assets, and make data-driven decisions worth millions in today’s complex NBA economy.
The NBA’s projected $154.65 million salary cap for the 2025-26 season represents more than just a spending limit. It defines a complex financial ecosystem where every trade decision carries millions in implications. NBA trades involve intricate financial rules including salary caps, luxury taxes, and apron restrictions that can significantly alter franchise trajectories.
Modern NBA organizations navigate these waters through sophisticated trade analysis platforms. Teams must evaluate salary matching requirements, asset valuations, and compliance regulations simultaneously. The stakes are enormous: a single miscalculation can trigger hard caps, generate excessive luxury tax penalties, or waste valuable assets.
Trade analyzer tools have evolved from simple calculators to comprehensive business intelligence platforms. These systems help franchises make data-driven decisions by processing multiple variables including contract structures, draft pick valuations, and CBA compliance requirements. The result is strategic clarity in an otherwise overwhelming financial landscape.
Key Takeaways:
- Financial Complexity: NBA trades involve multiple financial layers including salary caps, luxury taxes, and apron restrictions that require sophisticated analysis
- Asset Valuation: Draft picks and young talent represent critical assets that need strategic evaluation for long-term franchise success
- Competitive Edge: Teams investing in basketball analytics and trade analysis tools consistently outperform competitors in regular season wins
- Risk Mitigation: Proper trade analysis helps franchises avoid costly mistakes like triggering hard caps or excessive luxury tax penalties
- Business Intelligence: Trade analyzer tools transform complex CBA regulations into actionable business insights for roster construction
The Financial Foundation of NBA Trades
Understanding the NBA’s Economic Ecosystem
The NBA operates within a carefully constructed economic framework designed to promote competitive balance. The projected $154.65 million salary cap for 2025-26 serves as the foundation for all team-building decisions. Trades function as the primary mechanism for roster adjustment within these financial constraints.
Successful franchises understand that salary cap management directly correlates with on-court performance. Teams must balance immediate competitive needs with long-term financial flexibility. This creates a strategic puzzle where every contract, draft pick, and player option carries both basketball and economic significance.

Salary Cap Basics and Team Flexibility
The salary cap creates distinct operational tiers for NBA franchises. Teams under the cap enjoy maximum flexibility in free agency and trade negotiations. They can absorb contracts without matching salaries and benefit from cap space as a competitive advantage.
Teams above the cap face increasingly restrictive rules. Those exceeding the luxury tax threshold must navigate percentage-based salary matching requirements. “Teams under the cap have more flexibility in free agency and trades, while those above the aprons face stricter salary matching rules,” explains the current CBA structure.
Organizations operating above the first or second apron encounter the most severe restrictions. These teams face hard caps, limited exceptions, and reduced roster-building options. Strategic planning becomes essential to avoid these financial traps.
The Luxury Tax System and Financial Penalties
The luxury tax system creates progressive penalties for exceeding established thresholds. First-time taxpayers face dollar-for-dollar penalties, while repeat offenders encounter escalating rates reaching $4.75 for every dollar over specific amounts.
These penalties redistribute to compliant teams, creating financial incentives for disciplined spending. The system generates substantial revenue streams for organizations that maintain flexibility while penalizing excessive spending patterns.
Real-world impact extends beyond immediate penalties. Teams facing luxury tax payments must evaluate every roster decision through a cost-benefit analysis. This economic pressure influences trade timing, contract negotiations, and asset allocation strategies.
Key Economic Components That Drive Trade Decisions
Salary Matching Rules and CBA Compliance
NBA trade regulations require specific salary matching based on team financial status. Teams under the salary cap can absorb additional payroll without matching requirements up to available cap space. Organizations above the cap must match within percentage limits that vary by total incoming salary.
Contract structures must remain intact during trades unless specific exceptions apply. Players cannot renegotiate terms mid-season, creating constraints on deal flexibility. Simultaneous traded player exceptions (S-TPEs) provide limited workarounds for complex transactions.
Sign-and-trade agreements offer additional complexity and opportunity. These deals allow teams to acquire players they couldn’t sign directly while providing compensation to losing franchises. However, they trigger hard caps and create long-term flexibility constraints.
Asset Valuation: Draft Picks as Currency
Draft picks function as the NBA’s primary trade currency beyond player contracts. First-round selections carry considerable value due to cost-controlled rookie contracts and potential star development. Second-round picks provide depth options with minimal financial commitment.
Protection conditions dramatically impact draft pick valuations. A top-3 protected first-round pick carries different strategic value than an unprotected selection. Teams must evaluate probability scenarios when incorporating protected picks into trade packages.
Statistical analysis reveals that draft position strongly correlates with player value and trade influence. Lottery picks command premium returns, while late first-round selections serve as valuable additions in complex negotiations.
Young Talent and Cost Control Advantages
Rookie contracts represent the NBA’s most valuable assets from a cost-efficiency perspective. Players on rookie deals provide potential All-Star production at predetermined salaries well below market rates. This creates enormous strategic value for teams acquiring young talent.
Organizations must balance immediate competitive impact against future potential when evaluating young players. A developing prospect on a rookie contract might provide less current value but considerably more long-term upside than a veteran on a maximum deal.
Cost-controlled talent becomes essential for teams operating near luxury tax thresholds. These players allow franchises to maintain competitive rosters while avoiding excessive financial penalties.
Contract Structures and Financial Planning
Multi-year contracts create both opportunities and constraints in trade scenarios. Teams can trade for expensive players by timing deals with contract expirations or salary reductions. Conversely, long-term commitments limit future flexibility and must be evaluated carefully.
Player and team options add complexity to trade valuations. An expiring contract with a player option carries different risk than a guaranteed deal. Teams must factor option decisions into their strategic planning and trade timing.
Expiring contracts function as valuable assets for teams seeking financial flexibility. These deals provide immediate relief from luxury tax penalties while creating future cap space for free agency or additional trades.
Essential NBA Trade Analyzer Tools for Business Intelligence
FantasySP NBA Trade Analyzer: Performance-Based Valuations
FantasySP’s platform focuses on player performance evaluation through comprehensive rating systems. The tool analyzes past production, current performance, and projected future value to create detailed player assessments. This data-driven approach helps organizations move beyond subjective evaluations.
The trade value chart feature provides direct player comparisons based on statistical production and contract terms. Users can evaluate fair value exchanges by comparing performance metrics against salary commitments. This creates objective frameworks for complex negotiations.
Personalized trade breakdowns offer detailed analyses of proposed deals including fairness assessments and strategic implications. The platform translates complex performance data into actionable business intelligence for both fantasy applications and real NBA scenarios.
Spotrac NBA Trade Machine: Real-Time CBA Compliance
Spotrac specializes in real-time financial analysis and CBA compliance verification. The platform maintains up-to-date roster information and salary data for all 30 NBA franchises. This ensures trade proposals reflect current financial realities and regulatory requirements.
Multi-team trade support allows users to construct complex deals involving players, draft picks, and cash considerations. The system processes these transactions against current NBA rules and provides immediate legality validation.
Real-time feedback prevents costly compliance errors by identifying rule violations before they occur. Organizations can test multiple scenarios while ensuring all proposals meet current CBA standards and financial requirements.
Fanspo NBA Trade Machine & Cap Manager: Comprehensive Scenarios
Fanspo offers extensive customization capabilities for complex trade scenario planning. The platform allows users to construct multi-team deals while adjusting various parameters including trade rules and roster compositions.
Season-specific roster population ensures accuracy across different time periods and rule sets. Users can analyze historical trades, current possibilities, and future scenarios using appropriate financial constraints and player availability.
Contract modification capabilities provide detailed views of payroll implications and salary cap impacts. The platform translates complex financial data into visual representations that clarify long-term strategic implications.
SalarySwish: Salary Cap Tracking and Compliance
SalarySwish focuses on comprehensive salary cap monitoring and compliance management. The platform tracks real-time cap situations for all NBA franchises including luxury tax implications and apron restrictions.
Detailed contract tracking provides granular analysis of individual player agreements including options, bonuses, and escalators. This level of detail ensures accurate trade impact assessments and financial planning.
Interactive calculators help organizations evaluate various contract types and their implications on salary cap flexibility. The platform transforms complex CBA regulations into user-friendly tools for strategic decision-making.
Trade Analyzer Tool Comparison:
| Tool | Primary Focus | Key Features | Best Use Case |
|---|---|---|---|
| FantasySP | Player Performance | Rating system, value charts | Performance evaluation |
| Spotrac | Financial Compliance | Real-time CBA rules, multi-team trades | Legal validation |
| Fanspo | Scenario Planning | Customization, community features | Strategic planning |
| SalarySwish | Cap Management | Contract tracking, compliance monitoring | Financial oversight |
Business Value: How Analyzer Tools Transform NBA Operations
Salary Cap Navigation and Compliance Management
Advanced trade analyzer tools provide real-time tracking of luxury tax implications and apron restrictions. Organizations can model various scenarios before committing to deals, preventing costly compliance violations. The ability to project financial impacts across multiple seasons enables strategic long-term planning.
Proper cap management through analytical tools generates measurable savings. Teams avoiding luxury tax penalties through strategic planning can save millions in annual payments. These savings create additional resources for player development, scouting, or facility improvements.
Hard cap avoidance represents another critical value proposition. Teams that trigger hard caps through sign-and-trade deals or other mechanisms face severe roster construction limitations. Analyzer tools help organizations identify these risks before committing to problematic transactions.
Strategic Asset Optimization
Data-driven valuation systems help organizations maximize return on their assets. Draft picks, young players, and expiring contracts all carry specific values that fluctuate based on market conditions and team needs. Sophisticated analysis tools quantify these valuations for strategic decision-making.
Performance-based projections enable teams to identify undervalued assets and potential breakout candidates. Organizations can acquire future stars at below-market rates through advanced statistical models and projection systems.
Return on investment analysis helps teams balance competitive ambitions with financial realities. Tools that quantify the relationship between spending and winning create frameworks for optimal resource allocation.
Competitive Intelligence and Market Analysis
Research consistently demonstrates that teams investing in basketball analytics outperform competitors in regular season performance. Organizations using comprehensive trade analysis tools gain competitive advantages through superior decision-making processes.
Data-driven approaches enable more effective negotiation strategies. Teams armed with objective valuations and market analysis can identify optimal timing for trades and free agency decisions. This creates influence in complex negotiations with other franchises.
Market timing capabilities help organizations capitalize on inefficiencies and opportunities. Teams that identify undervalued assets or motivated trading partners can extract maximum value from their transactions.
Risk Mitigation and Financial Protection
Trade analyzer tools serve as insurance against costly mistakes in complex financial transactions. The ability to model various scenarios and identify potential complications prevents organizations from entering problematic deals.
Scenario planning capabilities enable teams to prepare for multiple outcomes and contingencies. Organizations can evaluate best-case and worst-case scenarios while developing mitigation strategies for various risks.
Long-term financial health preservation requires sophisticated planning tools that account for future obligations and opportunities. Teams using comprehensive analysis platforms maintain flexibility while avoiding financial traps that constrain future options.
Real-World Applications and Success Stories
Case Studies in Effective Trade Analysis
Several NBA franchises have demonstrated the value of sophisticated trade analysis through successful roster construction. Teams that acquired undervalued assets through data-driven evaluation have generated substantial returns on investment.
Cost savings through strategic planning extend beyond direct transaction benefits. Organizations that avoid luxury tax penalties, hard caps, and other financial constraints maintain competitive advantages over less disciplined franchises.
Competitive advantages gained through analytical superiority translate directly into improved on-court performance. Teams making better trades and roster decisions consistently outperform organizations relying on traditional evaluation methods.
Industry Adoption and Investment Trends
Growing investment in sports business intelligence reflects the increasing complexity of NBA economics. Organizations recognize that sophisticated analytical capabilities provide essential competitive advantages in modern roster construction.
Integration of trade analyzer tools into front office operations has become standard practice across successful franchises. Teams without these capabilities operate at notable disadvantages in trade negotiations and strategic planning.
Future trends indicate continued evolution toward more sophisticated analytical platforms. Artificial intelligence, machine learning, and advanced statistical modeling will further improve the capabilities of trade analysis tools.
Measurable Business Outcomes
Quantifiable improvements in team performance correlate directly with analytical investment. Organizations using comprehensive trade analysis tools show measurable gains in winning percentage and playoff success rates.
Financial savings from avoided mistakes compound over time, creating substantial value for disciplined organizations. Teams that prevent costly errors through proper analysis maintain financial flexibility for future opportunities.
Enhanced negotiation capabilities result in more favorable trade terms and asset acquisitions. Organizations armed with superior analytical tools consistently extract better value from their transactions.
FAQ
Q: How do NBA trade analyzer tools help teams avoid luxury tax penalties? A: Trade analyzer tools provide real-time tracking of salary commitments and project luxury tax implications for current and future seasons. Teams can model different trade scenarios to stay under tax thresholds or minimize penalties, potentially saving millions in payments.
Q: What makes draft picks valuable assets in NBA trades? A: Draft picks offer cost-controlled talent on rookie contracts, providing potential star production at predetermined salaries well below market rates. Protected picks add complexity to valuations, and teams use sophisticated analysis to evaluate probability scenarios and strategic timing.
Q: Why do teams above the salary cap face different trade rules? A: Teams above the salary cap must match salaries within specific percentage limits when making trades, while teams under the cap can absorb additional payroll up to their available cap space. This creates different strategic options and constraints for roster construction.
Q: How do trade analyzer tools provide competitive advantages? A: These tools enable data-driven decision making through objective player valuations, real-time compliance checking, and scenario planning capabilities. Research shows teams investing in basketball analytics consistently outperform competitors who rely on traditional evaluation methods.
Q: What financial risks do teams face without proper trade analysis? A: Without sophisticated analysis, teams risk triggering hard caps through improper deals, facing excessive luxury tax penalties, wasting valuable assets, and violating CBA compliance rules. These mistakes can cost millions and constrain future roster flexibility.
The evolution of NBA trade economics demands sophisticated analytical capabilities from successful franchises. Trade analyzer tools have transformed from simple calculators into essential business intelligence platforms that drive strategic decision-making. Organizations that invest in comprehensive analysis capabilities gain measurable competitive advantages while avoiding costly mistakes that constrain future flexibility.
The projected $154.65 million salary cap for 2025-26 represents just one component of an increasingly complex financial ecosystem. Teams must navigate luxury tax implications, apron restrictions, and asset valuations while maintaining competitive rosters. This complexity requires sophisticated tools that can process multiple variables simultaneously and provide actionable insights for strategic planning.
Future success in the NBA will increasingly depend on analytical superiority and data-driven decision making. Trade analyzer tools provide the foundation for this competitive advantage by transforming complex regulations into clear strategic guidance for roster construction and asset management.
NBA Trade Economics: Why Analyzer Tools Matter for Business
Market Overview
The National Basketball Association (NBA) operates within a complex financial ecosystem, where player trades are a critical component of team building and competitive strategy. The economic landscape of NBA trades is governed by intricate rules and regulations, including salary cap restrictions, luxury tax implications, and asset valuation considerations. These factors significantly influence a team’s ability to acquire talent, manage payroll, and maintain long-term financial health. The use of advanced analytics and specialized tools has become essential for navigating this complex environment and achieving a competitive advantage.
Key Financial Components and Economic Considerations in NBA Trades
Salary Cap Rules and Their Impact
The NBA’s salary cap system is designed to promote competitive balance by limiting team payrolls. For the 2025-26 season, the salary cap is projected to be around $154.65 million IndyStar. Teams can exceed the cap, but face increasing restrictions and penalties as they cross thresholds like the luxury tax and aprons. Teams under the cap have more flexibility in free agency and trades, while those above the aprons face stricter salary matching rules and limitations on exceptions IndyStar.
Luxury Tax Implications
The luxury tax is a financial penalty imposed on teams whose payroll exceeds the luxury tax threshold. The penalty increases progressively the further a team exceeds the threshold. Luxury tax money is partially redistributed to teams below the tax line. Teams near or above the luxury tax threshold must carefully manage trades to avoid exacerbating tax penalties CBS Sports.
Player Contract Structures
Player contracts remain intact when traded, with the receiving team assuming the existing contract terms. The NBA’s Collective Bargaining Agreement (CBA) governs contract terms, trade exceptions, and salary matching rules Sports Business Classroom. Trade matching rules require outgoing and incoming salaries to be within certain percentage limits depending on the team’s salary tier. Simultaneous traded player exceptions (S-TPEs) and sign-and-trade deals provide additional flexibility [en.wikipedia.org/wiki/Sign-and-trade_deal].
Asset Valuation: Draft Picks and Young Talent
Draft picks and young players are critical assets in NBA trades, often valued for their potential and cost control ESPN. Draft picks are ranked and protected with various conditions, affecting their trade value. Young talent under rookie contracts is highly valued due to lower salary costs and potential upside. Asset valuation balances immediate player impact versus future potential, influencing trade decisions.
NBA Trade Analyzer Tools
Several tools are available to assist teams and individuals in analyzing potential trades. These tools provide valuable insights into player valuations, salary cap implications, and trade legality.
FantasySP NBA Trade Analyzer
FantasySP’s NBA Trade Analyzer assigns ratings to players based on past, current, and expected performance across various categories FantasySP. It provides a trade value chart to compare players and offers personalized trade breakdowns, helping users assess trade fairness and roster fit. The tool is particularly useful for fantasy basketball trade evaluation.
Spotrac NBA Trade Machine
Spotrac’s NBA Trade Machine uses up-to-date roster and financial information, incorporating CBA rules and restrictions [apps.apple.com/us/app/nba-trade-machine/id6739259588]. It allows users to build trades, including players, draft picks, and cash, and supports multi-team trades. The tool validates trade legality under NBA rules in real-time, providing immediate feedback on trade feasibility.
Fanspo NBA Trade Machine & Cap Manager
Fanspo’s NBA Trade Machine & Cap Manager allows users to create customized trade scenarios involving multiple teams [fanspo.com/nba/trade-machine]. It populates rosters and assets for the selected NBA season, supports trading players and draft picks, and enables contract modifications and payroll viewing. The tool features adjustable trade rules settings and community interaction.
SalarySwish NBA Salary Cap Tracker and Trade Machine
SalarySwish tracks salary cap compliance for all 30 NBA teams, providing detailed player contracts, team rosters, and cap hits [salaryswish.com]. It includes calculators for various contract types and offers an interactive trade machine to simulate trades and analyze their impact on cap space and compliance.
How Analyzer Tools Matter for Business
Navigating Salary Cap and Compliance
Trade analyzer tools are essential for navigating the complexities of salary cap rules, luxury tax implications, and apron restrictions CBS Sports. Tools like Spotrac and Fanspo provide real-time salary and tax tracking, trade simulation with salary cap rules, and financial breakdowns to ensure trades comply with CBA regulations. These tools help teams avoid triggering hard caps and penalties associated with apron thresholds, allowing for strategic payroll and roster construction Spotrac, Fanspo.
Strategic Valuation and Optimization of Trade Assets
Trade analyzer tools contribute to the strategic valuation and optimization of trade assets, such as draft picks, young talent, and player contracts FantasySP, SalarySwish. FantasySP’s performance-based ratings and projections help teams estimate the future value of draft picks and young players. SalarySwish provides the financial framework to understand how player contracts affect team salary cap space and luxury tax liabilities. These tools enable franchises to align competitive ambitions with financial realities, leveraging draft picks, young talent, and contracts to build sustainable, competitive rosters.
Gaining a Competitive Edge and Mitigating Financial Risks
NBA teams and agents use trade analyzer tools to gain a competitive edge and mitigate financial risks in trade negotiations and roster construction Fanspo. An empirical study published in Sage Journals found that NBA teams investing more in basketball analytics tend to outperform competitors in terms of regular season wins Sage Journals. These tools help teams make data-driven decisions, optimize resource allocation, and ensure trades comply with complex financial regulations.
Conclusion
In conclusion, NBA trade analyzer tools are indispensable for modern team management. They provide the means to navigate complex financial regulations, strategically value assets, and gain a competitive edge. By leveraging these tools, NBA franchises can make informed decisions, optimize their rosters, and build sustainable success in a highly competitive environment.
Sources
- https://www.indystar.com/story/sports/nba/pacers/2025/06/30/nba-free-agency-2025-explaining-salary-cap-luxury-tax-and-aprons-cba/84333215007
- https://www.cbssports.com/nba/news/nba-trade-deadline-luxury-tax-apron-explainer-2026
- https://sportsbusinessclassroom.com/understanding-trade-matching-in-the-new-collective-bargaining-agreement
- https://en.wikipedia.org/wiki/Sign-and-trade_deal
- https://www.espn.com/nba/story/_/id/44938717/nba-draft-asset-rankings-stacking-all-30-teams-pick-collections
- https://www.fantasysp.com/nba_trade_analyzer
- https://apps.apple.com/us/app/nba-trade-machine/id6739259588
- https://fanspo.com/nba/trade-machine
- https://salaryswish.com
- https://www.spotrac.com/nba/tax
- https://journals.sagepub.com/doi/10.1177/15270025251328264
Discover more from The Economy
Subscribe to get the latest posts sent to your email.


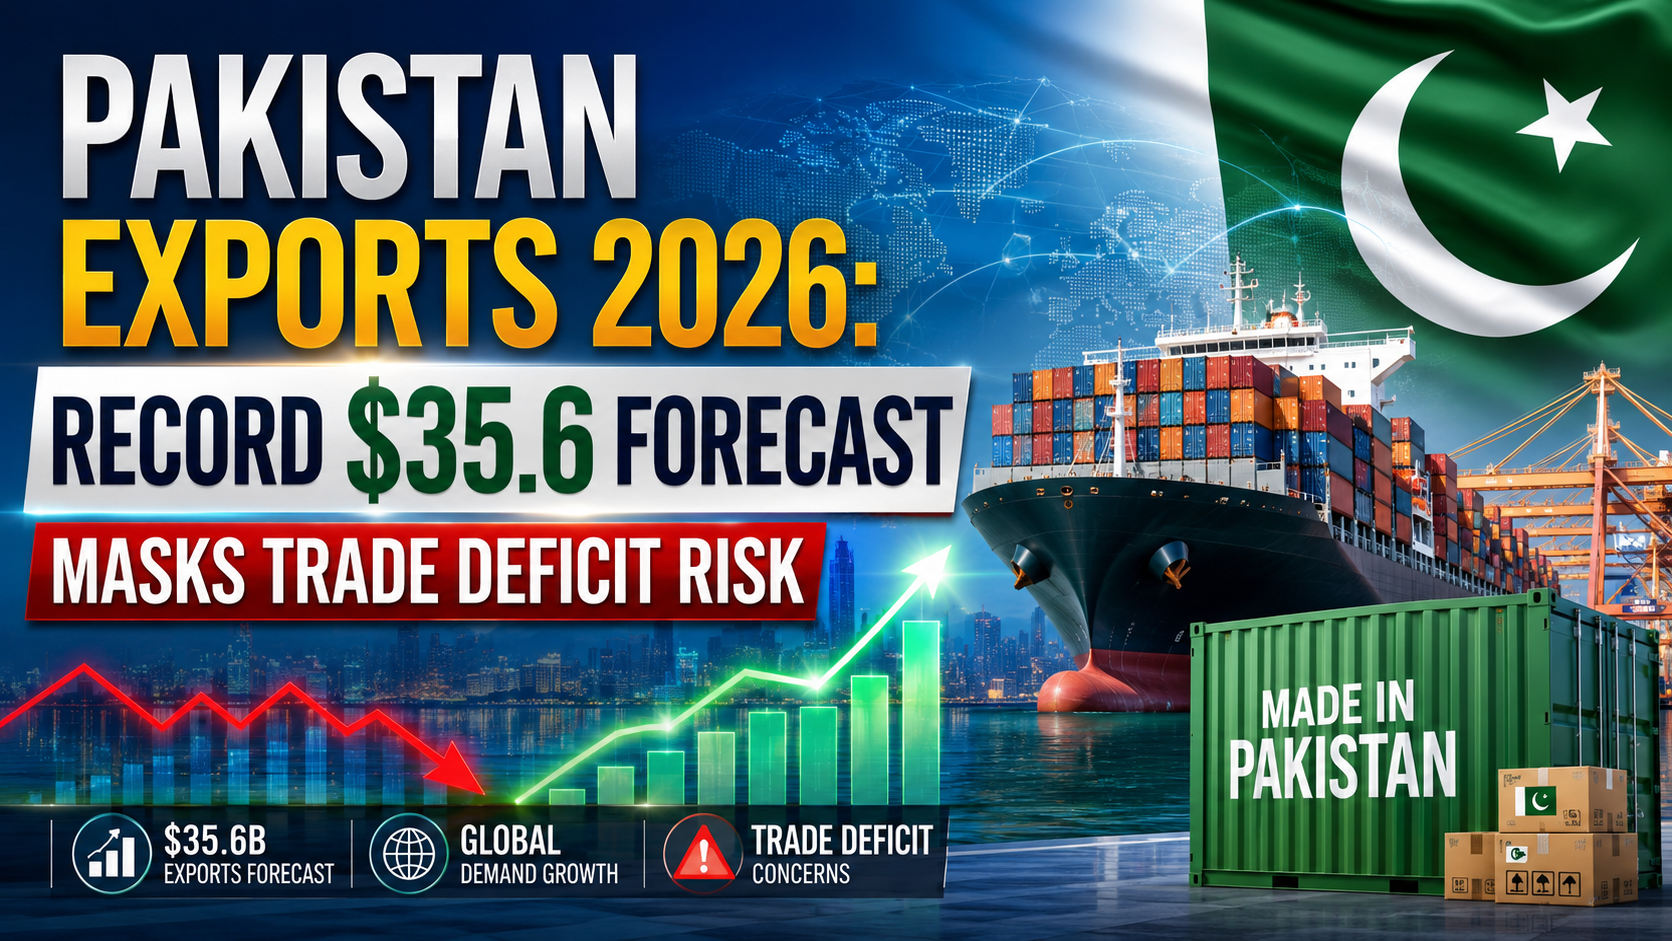
Pakistan opened its new fiscal year with its strongest July export performance on record, and the IMF is projecting the country’s best-ever full-year export total for FY27. Beneath that headline, though, the numbers show an external sector still leaning heavily on financing rather than genuine competitiveness.
According to Ministry of Commerce data cited by Global Textile Times, Pakistan’s total exports reached $2.96 billion in July 2026, a 10% increase over the $2.69 billion recorded a year earlier. Imports rose a more modest 5% to $4.62 billion, allowing the country to post a narrower trade deficit for the month relative to the pace of export growth — a rare piece of unambiguously good news for a country that has spent much of the past two years managing external account stress.
The IMF’s Record Forecast
The momentum has fed into a bullish official outlook. The IMF now estimates Pakistan’s exports will climb to a record $35.63 billion in the fiscal year beginning July 1, 2026 — up sharply from an estimated $31.93 billion in the year just ended, according to figures reported by ProPakistani. If realised, that would mark the strongest annual increase in Pakistan’s export earnings in recent years, built on a recovery in textile shipments, stronger IT exports and improved access to foreign markets.
The Number the Headlines Miss
But the same IMF projections carry a less flattering companion figure: import growth is expected to outpace export growth in percentage terms, meaning Pakistan’s trade deficit is forecast to widen even as exports hit a record. That is not a hypothetical risk — it is already showing up in the most recent full-year data.
A detailed roadmap published by Pakistan Today lays out the scale of the problem: Pakistan’s trade deficit widened by 25% in FY26, expanding from $26.96 billion to $33.66 billion, even as the State Bank of Pakistan reported foreign exchange reserves strengthening to $18.4 billion — driven largely by IMF financing and workers’ remittances rather than by trade performance itself. Foreign direct investment, meanwhile, fell 24% over the same period, undercutting the case that global investors see Pakistan’s growth story as self-sustaining.
The report is unambiguous about what this combination means: “Pakistan’s financial stability cannot continue to depend on IMF support, workers’ remittances, and external borrowing alone,” the analysis states, even as it notes IMF projections suggest reserves could reach $21 billion by FY27 — an improvement the report characterises as “primarily financing-driven rather than export-led.”
Textiles: Growth Engine or Growth Ceiling?
Textiles remain the backbone of Pakistan’s export economy, generating the overwhelming majority of shipments to the United States, according to comments from Pakistan’s Ambassador to the US, Rizwan Saeed Sheikh, at the Texworld New York trade show, reported by Dawn. Five Pakistani manufacturers — including A1 Infinity, MRI Group, Hometex Corporation, Ruqi Sports and Niza Sports — showcased home textiles, apparel, leather garments and sportswear to US and international buyers at the Jacob K. Javits Convention Centre.
Yet the sector’s full-year trajectory has been closer to stagnation than triumph. Textile and clothing exports for FY26 reached just $17.93 billion, a marginal 0.26% increase over the prior year’s $17.88 billion, according to data compiled by Global Textile Times. Official figures show merchandise exports missed their annual target by $4.87 billion — a gap that underscores how far the “record forecast” narrative still has to travel before it becomes reality on the ground.
What the IMF’s Country Review Shows
Pakistan’s broader macro picture, as laid out in the IMF’s most recent country report, adds further texture. GDP growth in the first half of FY26 averaged 3.8% year-on-year despite July–August flooding, driven by the auto, construction and garment industries. But the same review flags structural revenue weaknesses that constrain the government’s room to manoeuvre: the GST C-efficiency ratio has fallen from 27.4% to 22.8% over the past decade, petroleum products are taxed at an effective rate of 166%, and roughly three-quarters of the theoretical GST base remains untaxed due to exemptions and provincial fragmentation.
The Fund also noted Pakistan missed a structural benchmark on adopting international governance standards for its Sovereign Wealth Fund by end-March 2026, though the required amendments remain pending Cabinet approval — a reminder that programme compliance, not just export volume, will shape the pace of continued IMF disbursements.
The Diversification Push
Beyond textiles, Pakistan’s July export growth also drew support from agricultural shipments — rice and processed food maintained market share — alongside early signs of diversification into specialised manufacturing and engineering goods, according to the Global Textile Times report. Government officials frame this as evidence of a broadening industrial base, though the scale remains small relative to textiles’ dominant share of total exports.
Separately, the textile industry’s own roadmap calls for a shift toward higher-value products — smart textiles, antimicrobial fabrics, fire-resistant fabrics and recycled fibres — arguing that closer collaboration between universities, research institutions and manufacturers is needed to escape a decade of stagnant per-unit export values.
Pakistan’s July export figures and the IMF’s record FY27 forecast are genuinely positive data points after a difficult multi-year stretch. But the same set of official numbers shows a trade deficit projected to widen, FDI still declining, and reserve growth that owes more to financing than to trade competitiveness. For a country whose last two IMF programmes were both triggered by external account crises, the distinction between record exports and a resilient external position is not academic — it is the difference between durable stability and another financing-dependent reprieve.
Discover more from The Economy
Subscribe to get the latest posts sent to your email.
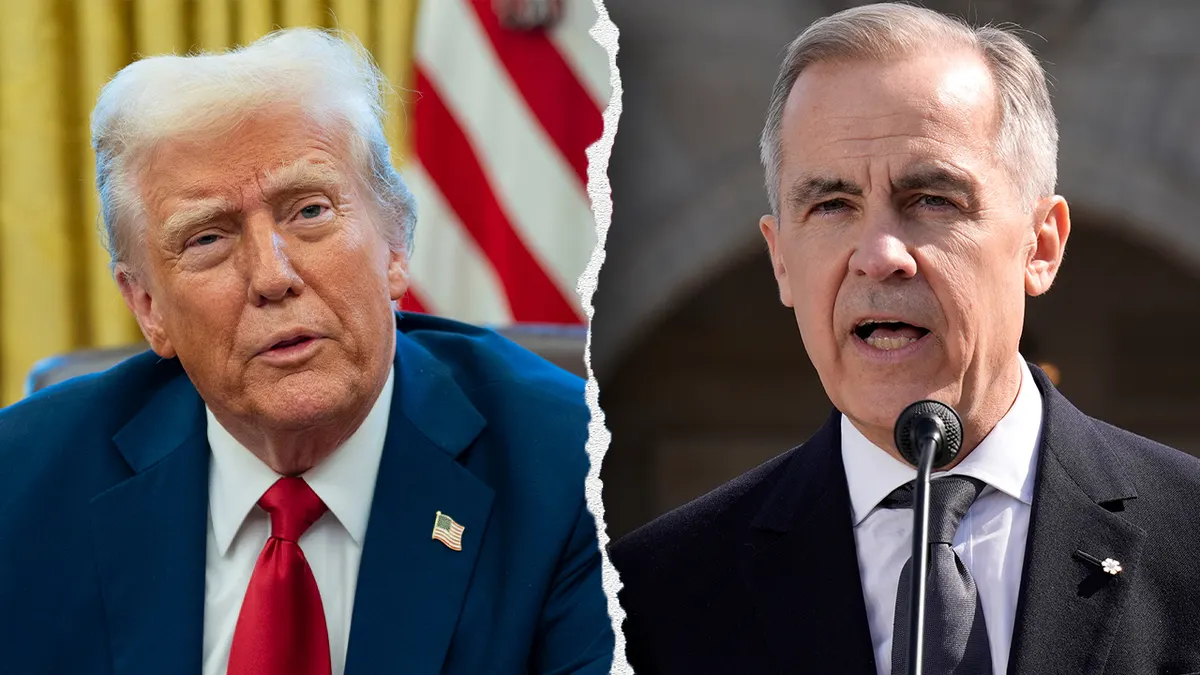
Every headline about the Canadian economy in July 2026 leads with the same frame: a stalled CUSMA review, punishing sectoral tariffs on steel and autos, and a technical recession. What almost none of them mention is the number that matters more for Canada’s next decade — a near-50% increase in non-US export value since 2024.
The CUSMA deadline that came and went
The Canada-US-Mexico Agreement’s mandatory review was due July 1, 2026. It could have renewed the deal for another 16 years, extended it for 10 years with annual reviews, or replaced it entirely — but the deadline passed with no resolution, according to TD Economics’ Weekly Bottom Line. The process now shifts to annual reviews, which TD Economics notes “will keep the cloud of uncertainty hanging” even though “parties can strike a deal at any time.”
Deloitte’s assessment, reported by Global News, is blunt: Canada’s economy is “on pause” amid the negotiations, with 2026 GDP growth forecast at just 0.7%, down from 1.7% in 2025. Business investment has now declined for five consecutive quarters through Q1 2026, and the country met the technical definition of recession over the six months from October 2025 through March 2026 — though several officials, including the Bank of Canada, have resisted that label given the data isn’t uniformly weak.
The diversification story underneath the headlines
Here’s what’s being underreported: Sébastien McMahon, chief economist at iA Financial Group, told BNN Bloomberg that Canada’s next phase of growth depends on expanding trade with markets beyond the US — and that exports to non-US destinations have already increased by nearly 50% in value since 2024. That’s a structural shift happening in real time, largely obscured by the tariff-headline cycle.
Energy has been doing the heavy lifting in the meantime. Statistics Canada reported GDP expanded 0.5% in April 2026 — the strongest monthly growth since July 2025 — driven substantially by energy: conventional and non-conventional oil and gas extraction, pipeline transportation, and refined petroleum manufacturing all contributed, according to Dominique Lapointe of Manulife Investment Management, per BNN Bloomberg. Western Canadian Select crude was trading around US$56 a barrel — more than 30% higher than at the start of the year — even as global benchmark prices had declined, partly because energy revenue is dollar-denominated and a weaker loonie makes production more lucrative.
The China trade angle nobody expected
In a move that received surprisingly little attention outside Canadian outlets, Canada cut its 100% tariff on Chinese electric vehicles to 6.1% for an initial quota of 49,000 units, in exchange for China reducing tariffs on Canadian canola seed (from roughly 85% to about 15%) and suspending tariffs on canola meal, peas, lobster, and crab through the end of 2026, according to Oye! Times. Canada is opening its market to up to 278,989 Chinese EVs over five years — a trade-off that Canadian auto manufacturers argue creates both competitive and data-security risk, given concerns about connected vehicles.
What this means for businesses and investors
The federal government’s Major Projects Office, created to streamline approvals for nation-building infrastructure, and continued provincial investment plans suggest Ottawa is betting on this diversification thesis rather than waiting out the US relationship. For Pakistani and other emerging-market exporters watching global trade realignment, Canada’s playbook — opening EV market access in exchange for agricultural tariff relief, while building alternative energy export capacity — is a template worth studying: reduce single-partner concentration risk without abandoning your largest existing trade relationship.
The risk, as TD Economics notes, is that “another setback in negotiations, or new tariffs, could unwind the recent progress” — meaning the diversification trend, while real, remains vulnerable to a single adverse CUSMA outcome.
FAQ
Is Canada in a recession in 2026? Canada met the technical definition of recession over October 2025–March 2026 (two consecutive quarterly GDP declines), though officials including the Bank of Canada have disputed whether this reflects a genuine broad-based downturn.
What happened with the CUSMA review deadline? The July 1, 2026 mandatory review deadline passed without a resolution; the process now moves to annual reviews while current tariff terms remain in place.
How is Canada reducing its reliance on US trade? Non-US export value has grown nearly 50% since 2024, according to iA Financial Group, alongside new agreements such as reduced EV tariffs with China in exchange for Chinese tariff relief on Canadian agricultural exports.
Discover more from The Economy
Subscribe to get the latest posts sent to your email.
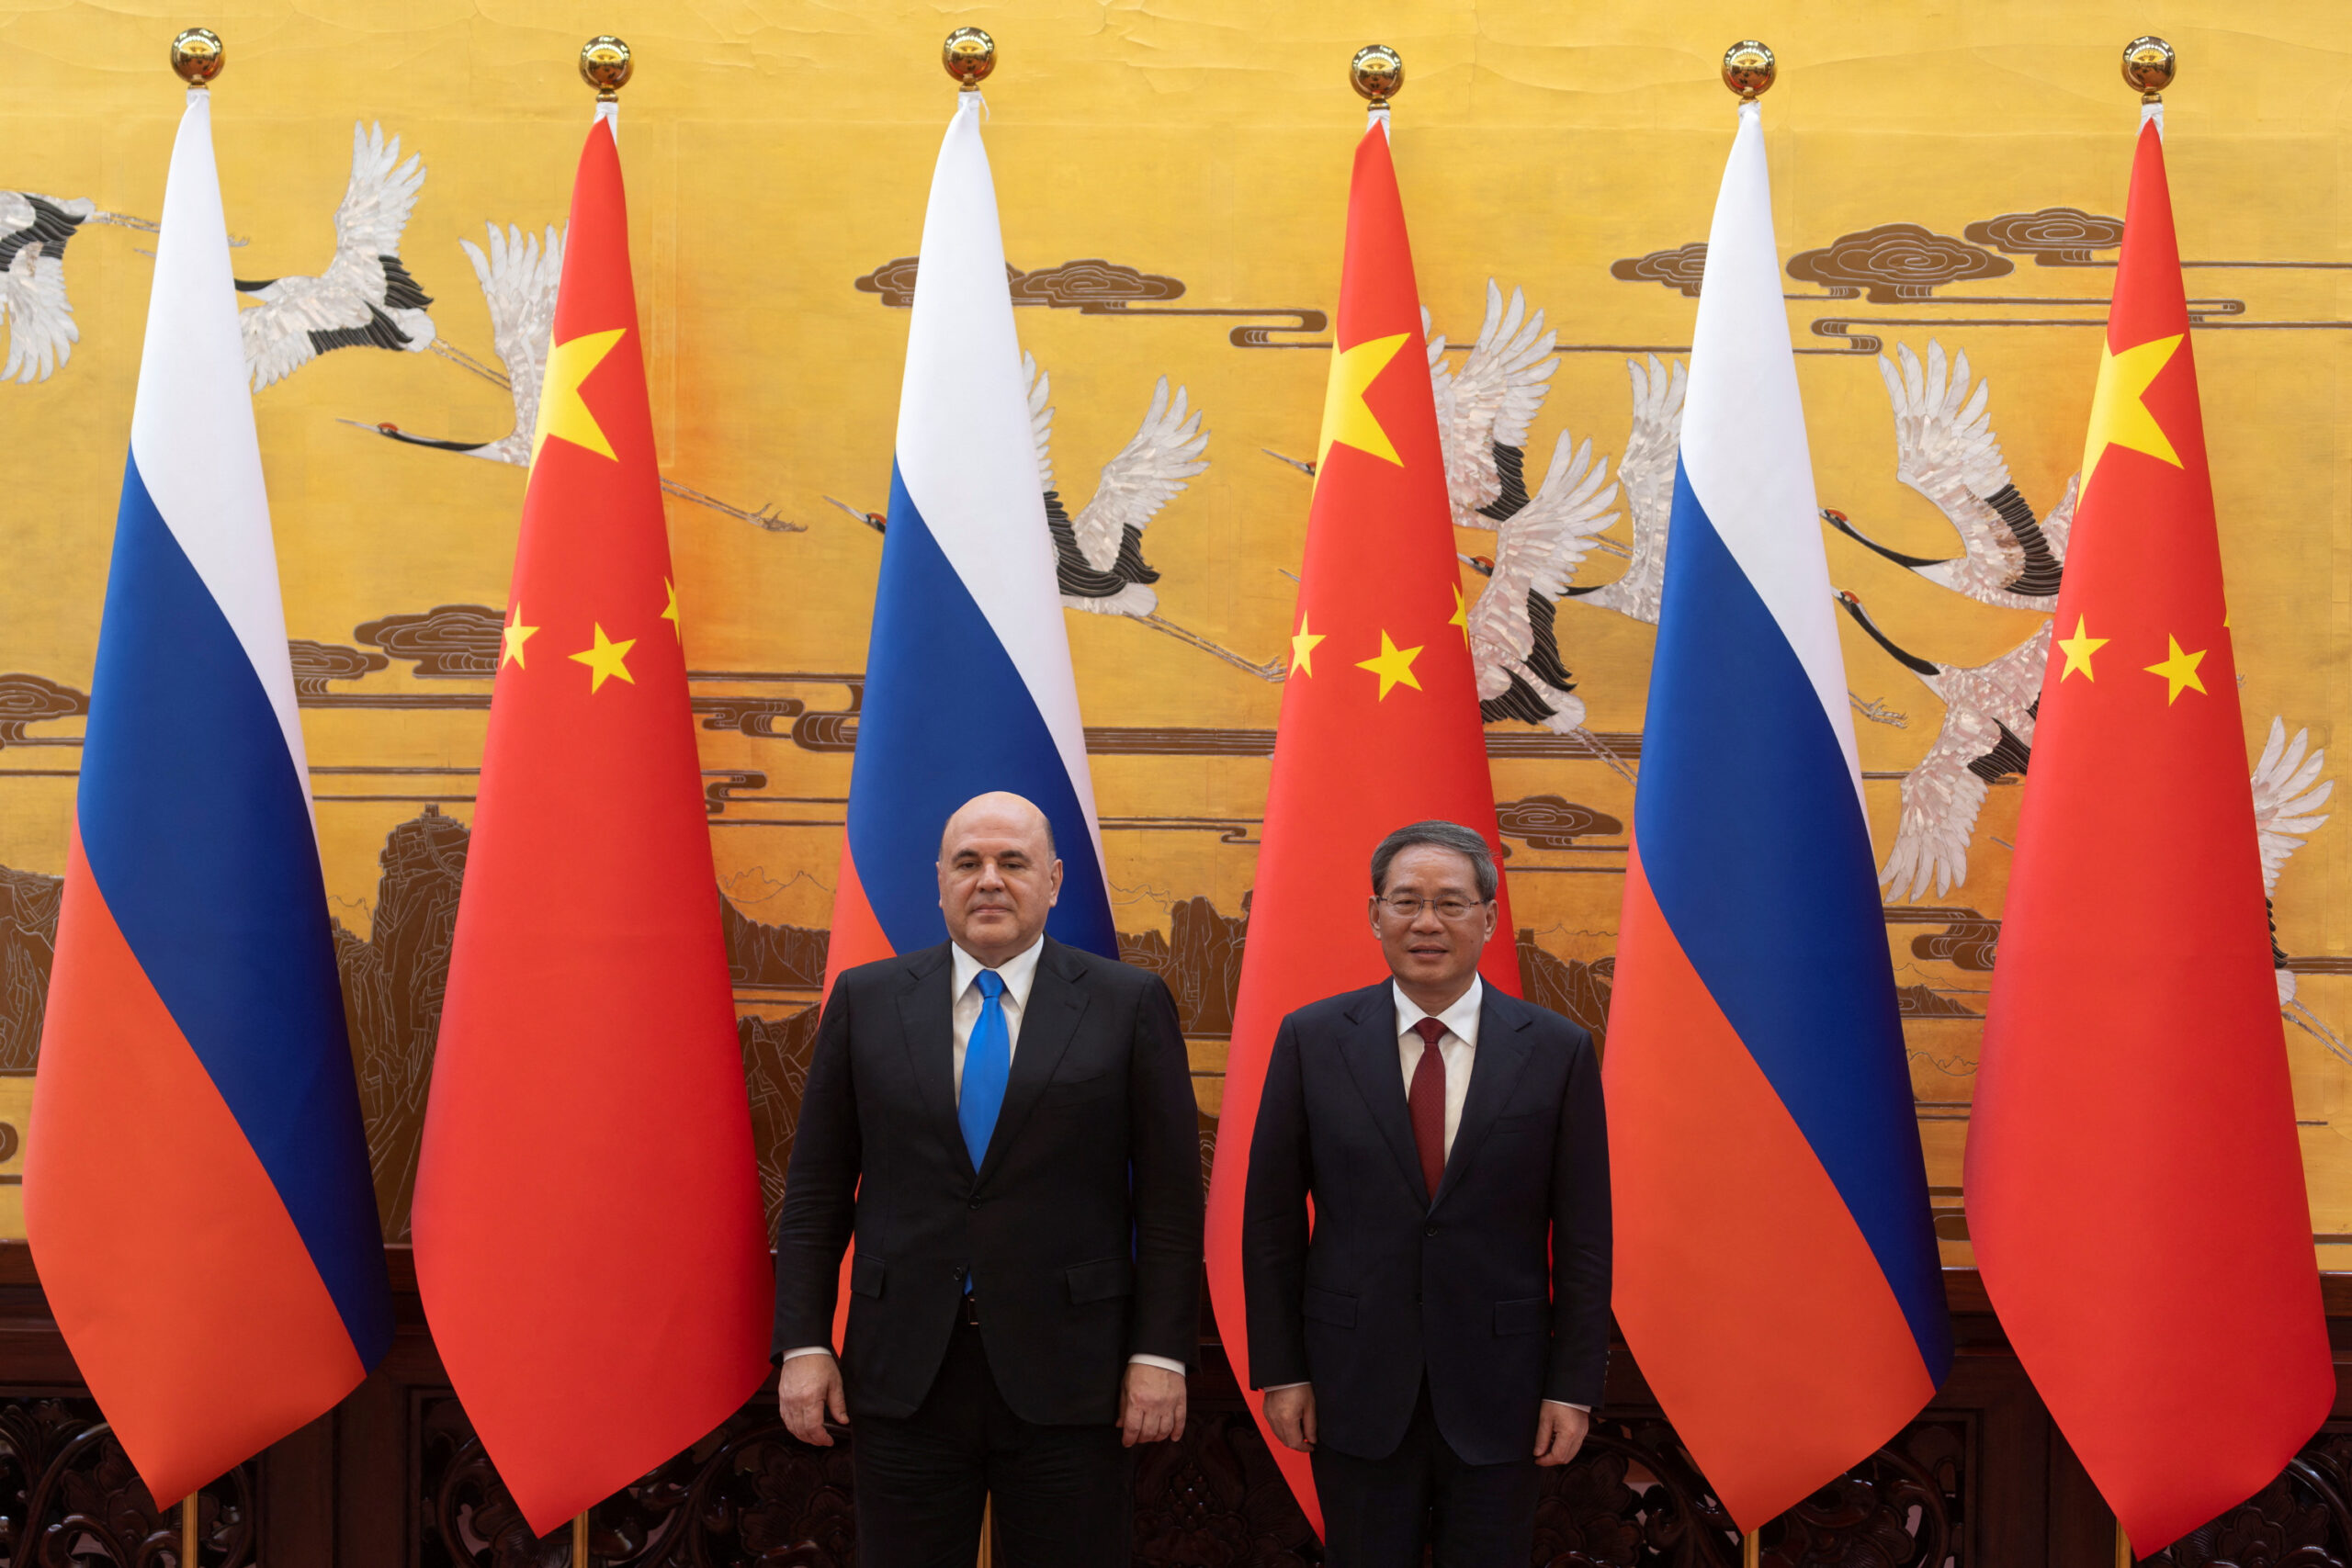
Despite Vladimir Putin’s May 2026 Beijing visit and more than 20 new cooperation agreements signed with Xi Jinping, analysts say China-Russia trade is approaching the limits of what the relationship can economically deliver, with bilateral trade actually declining in 2025 for the first time since the pandemic.
The Numbers Behind the Political Theater
Bilateral trade grew 55% between 2021 and 2025, comfortably surpassing the two countries’ shared $200 billion target set in 2019 — but trade actually fell 7% to $227.6 billion in 2025, marking the first annual decline since the pandemic year of 2020, according to The Moscow Times. Economist Andrei Gnidchenko of Moscow-based analytical center CMAKP said trade growth is likely to slow further in the second half of 2026 as China builds up its own energy reserves and economic activity in both countries remains subdued, estimating full-year trade will land only 5%–10% above 2025 levels — roughly flat with 2024.
Q1 2026 customs data tells a more nuanced story: trade turnover exceeded $61 billion in the first three months, up 14.8% year-on-year, with Russian imports of Chinese goods growing 22% to $27.7 billion and Russian exports to China — dominated by energy — rising 9% to $33.6 billion, according to European Business Magazine.
The May 2026 Beijing Summit
On May 16–17, 2026, Xi and Putin signed two joint statements in Beijing — one deepening their “comprehensive strategic partnership of coordination for a new era” and another renewing the Treaty of Good-Neighborliness and Friendly Cooperation — alongside more than 20 bilateral agreements spanning energy, trade, technology, and media, according to analysis from Indoneo. Both sides also reaffirmed support for India’s BRICS chairmanship in 2026 and pledged deeper cooperation within the BRICS Economic Partnership Strategy framework, per the official joint statement.
Carnegie Russia Eurasia Center director Alexander Gabuev has characterized the summit as evidence Moscow has effectively accepted a junior role in the relationship, trading growing economic dependence on Beijing for diplomatic cover and continued economic survival amid Western sanctions and confrontation, according to Indoneo’s analysis.
Where the Friction Is Emerging
Behind the diplomatic choreography, real frictions are growing over energy pricing, banking channels, and Russian customs duties on Chinese vehicles, according to reporting from Insight EU Monitoring. The long-discussed Power of Siberia 2 pipeline remains unresolved more than a year after Gazprom’s original memorandum, with China’s own 2026-2030 Five-Year Plan committing only to “advance preparatory work” rather than a firm construction timeline. China has also signaled through its energy diversification strategy — expanding solar, wind, and alternative suppliers — that it is no longer as dependent on Russian energy as it was in 2022, giving Beijing more leverage to negotiate lower prices.
What It Means for Global Markets
For Western policymakers, the persistence of the China-Russia trade relationship — even amid signs of cooling — remains the clearest evidence that four years of sanctions pressure has not fractured the alignment, according to Indoneo. But the slowing growth rate suggests the relationship may be maturing into a more transactional, price-sensitive phase rather than continuing its post-2022 boom trajectory — a dynamic that will shape everything from global energy flows to the yuan’s role in bilateral settlement.
Discover more from The Economy
Subscribe to get the latest posts sent to your email.

The Global South: Debt, Climate Finance and Investment in 2026

Energy Security Is the New Economic Security

Can Global Tourism Survive Geopolitical Shocks?

Global Maritime Hegemony: How China Secured Over 81% of All New Shipbuilding Orders

The Coming Battle Over AI, Jobs and Wages

Why Developing Economies Face a Sharper Inflation Problem

The New Geography of Trade: Are Supply Chains Coming Home?

Is AI Saving Global Growth or Creating the Next Bubble?

Global Banking Trends 2026: Digital Banks, AI and Compliance

Gold vs US Dollar vs Bitcoin in 2026: Inflation Hedge Compared

How Global Interest Rates Affect Savings, Loans and Investments

How to Invest During High Inflation: A Global Guide

Best Global Stocks to Watch in 2026: Four Sectors to Research

Pakistan’s 2027 Growth Strategy: Exports, AI, Energy and Jobs

Crude Oil & Petroleum Market Analysis: OPEC+ Decisions and Price Forecasts

World’s Largest Economies: Ranking the Top Global Powers

Silver Price Today: Why the Xi-Trump AI Standoff Is Fueling a Safe-Haven Rally

Top US Convenience Store Chains: Store Counts, EV Charging, and Sales Trends

Algorithmic Dogfights: Why the U.S. and China Must Establish Rules of Engagement for Autonomous Air Power

Who Is Shivon Zilis? The Neuralink Executive at the Center of the Musk–OpenAI Trial

Business Insurance: What Coverage You Actually Need and What It Costs in 2026

Corporate America Faces a New Debt Test as US Borrowing Costs Surge

Global Economic Outlook 2026: 7 Forces Reshaping Markets, Trade and Business

Social Security Extra $90 Deposit: Who Qualifies for the October 2026 Medicare Rebate?

US 10-Year Yield Hits 5.24%: What the Historic Bond Market Sell off Means for Mortgages and Investors

Gold Falls 3.7% as Yields Surge: Is Gold Still a Safe Haven in 2026?

Stock Market Today: Dow, S&P 500, and Nasdaq Retreat as Treasury Yields

MAS Allocates S$1.45 Billion to Five Asset Managers in Third EQDP Batch: Total Deployment Reaches S$5.4 Billion
-

 Markets & Finance10 months ago
Top 15 Stocks for Investment in 2026 in PSX: Your Complete Guide to Pakistan’s Best Investment Opportunities
-

 Analysis8 months ago
Johor’s Investment Boom: The Hidden Costs Behind Malaysia’s Most Ambitious Economic Surge
-

 Analysis8 months ago
Top 10 Stocks for Investment in PSX for Quick Returns in 2026
-

 Banks9 months ago
Best Investments in Pakistan 2026: Top 10 Low-Price Shares and Long-Term Picks for the PSX
-

 Analysis9 months ago
Brazil’s Rare Earth Race: US, EU, and China Compete for Critical Minerals as Tensions Rise
-

 Investment10 months ago
Top 10 Mutual Fund Managers in Pakistan for Investment in 2026: A Comprehensive Guide for Optimal Returns
-

 Global Economy10 months ago
15 Most Lucrative Sectors for Investment in Pakistan: A 2025 Data-Driven Analysis
-

 Global Economy10 months ago
Pakistan’s Export Goldmine: 10 Game-Changing Markets Where Pakistani Businesses Are Winning Big in 2025