
Asia
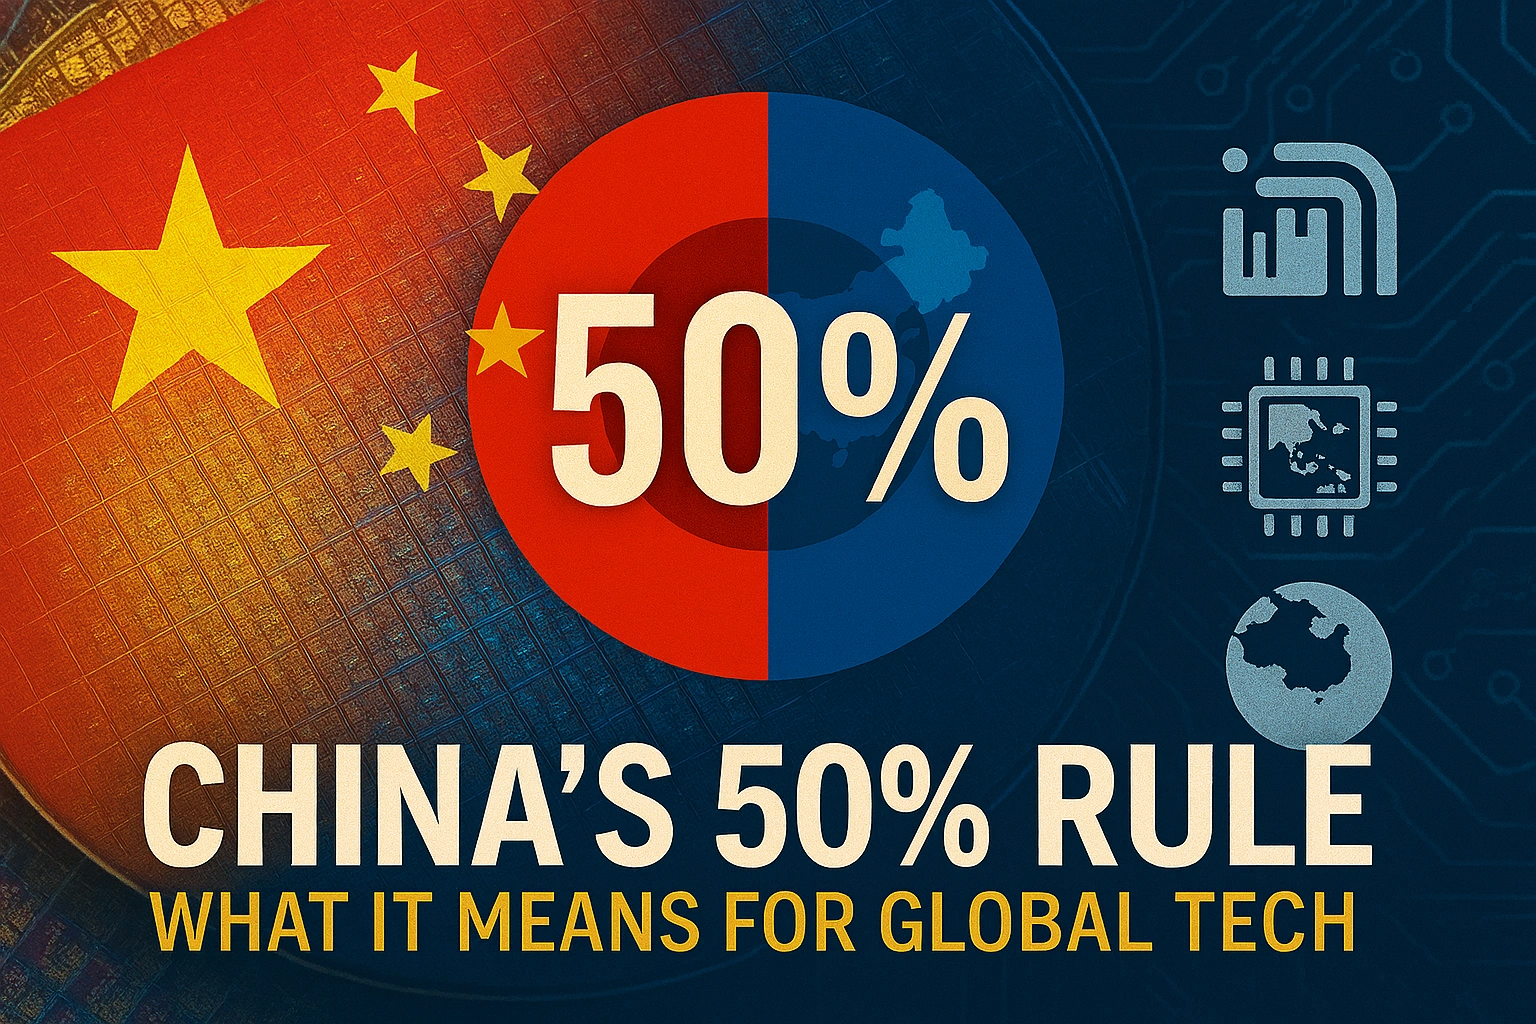
China’s 50% Domestic Equipment Rule: The Semiconductor Mandate Reshaping Global Tech

How Beijing’s Quiet Policy Shift Is Accelerating Chip Independence and Putting $18 Billion in Foreign Sales at Risk
When Chinese chipmakers began receiving approval applications for new fabrication plants in early 2024, they encountered an unexpected requirement: demonstrate that at least half of their equipment purchases would come from domestic suppliers, or face rejection. No formal regulation announced it. No press conference explained it. Yet this unpublished rule—requiring chipmakers to use at least 50% domestically made equipment for adding new capacity—represents one of Beijing’s most aggressive moves yet in the technology cold war with the West.
The mandate arrives at a pivotal moment. China’s semiconductor equipment market reached $23.89 billion in 2024, accounting for roughly 40% of global wafer fabrication equipment spending. With major chip equipment makers’ China revenue doubling from 17% in late 2022 to 41% by early 2024, the new policy threatens to fundamentally reshape who wins and loses in the world’s largest chip market.
This isn’t just another trade restriction. It’s a calculated industrial strategy that’s already yielding measurable results—and forcing both Chinese manufacturers and foreign suppliers to completely rethink their approach to the most critical technology of our time.
The Policy Decoded: What the 50% Rule Really Means
The mandate operates through China’s state approval process rather than published regulations. When companies like Semiconductor Manufacturing International Corporation (SMIC) or Hua Hong Semiconductor submit proposals to build or expand facilities, authorities now require detailed procurement tenders proving that domestic equipment will constitute at least 50% of total spending.
Applications that fail to meet the threshold are typically rejected, though the policy includes strategic flexibility. Advanced production lines targeting cutting-edge nodes receive temporary exemptions where domestic alternatives simply don’t exist yet—particularly for lithography equipment, the most sophisticated tools in chip manufacturing.
The scope is revealing. State-affiliated entities placed a record 421 orders for domestic lithography machines and parts in 2024 worth around 850 million yuan ($121.3 million), signaling an unprecedented surge in demand for locally developed technologies. However, these orders include both new systems and spare parts, making the actual number of new tools difficult to assess.
To put this in perspective, a single advanced lithography tool from ASML—the Dutch company that dominates the market—costs approximately $27.9 million for dry ArF systems used in mature node production. The total value of China’s domestic orders barely covers four or five equivalent machines, illustrating both the progress Chinese suppliers have made and the massive gap that remains.
What makes this policy particularly potent is its timing. While US export controls blocked China’s access to the most advanced chipmaking equipment, the 50% rule forces Chinese manufacturers to choose domestic suppliers even in areas where foreign equipment remains available and technically superior.
Winners Rising: China’s Semiconductor Equipment Champions
The mandate is producing exactly what Beijing intended: a rapid acceleration in domestic equipment capabilities, backed by extraordinary revenue growth and technological breakthroughs.

Naura Technology: The Emerging Powerhouse
Naura Technology Group’s 2024 revenue reached between 27.6 billion yuan and 31.78 billion yuan ($3.79-$4.36 billion), reflecting growth of 25% to 44%. Net profit surged even faster, climbing 33% to 53% year-over-year. This isn’t just financial engineering—it’s a company rapidly closing the technology gap.
Naura is testing its etching tools on SMIC’s cutting-edge 7-nanometer production line, a crucial milestone that puts Chinese equipment into advanced node manufacturing for the first time. Previously, such sophisticated etching was exclusively the domain of American giants Lam Research and Tokyo Electron.
The company’s innovation pipeline is equally impressive. Naura successfully developed key products including capacitively coupled plasma etching equipment, plasma-enhanced chemical vapor deposition systems, atomic layer deposition vertical furnaces, and stacked wafer cleaning systems—all of which have been integrated into customer production lines at scale.
Perhaps most revealing: Naura filed a record 779 patents in 2024, more than double what it filed in 2020 and 2021. This isn’t incremental improvement; it’s a company operating in overdrive.
AMEC: Specializing Under Pressure
Advanced Micro-Fabrication Equipment (AMEC) is taking a different path, focusing intensely on etching technologies. The company’s 2024 revenue hit 9.065 billion yuan ($1.24 billion), up 45% year-over-year, with etching equipment accounting for 7.276 billion yuan—a 55% increase.
AMEC developed electrostatic chucks to replace worn parts in Lam Research equipment that the company could no longer service after 2023 restrictions, demonstrating how necessity drives innovation. When American suppliers were forced to withdraw support, Chinese companies didn’t just wait—they engineered solutions.
China gained nine percentage points in the dry etch tool segment between 2019 and 2024, with AMEC and Naura each capturing roughly 5% market share. It’s a small but strategically significant foothold in a market previously dominated by the United States (59%) and Japan (29%).
ACM Research: The Quiet Achiever
ACM Research, specializing in cleaning and polishing equipment, expects 2024 revenue between 5.6 billion yuan and 5.88 billion yuan ($769-$807 million), reflecting growth of 44% to 51%. The company projects 2025 revenue will reach 6.5-7.1 billion yuan thanks to a robust order backlog.
Analysts estimate that China has now reached roughly 50% self-sufficiency in photoresist-removal and cleaning equipment, a market previously dominated by Japanese firms but now increasingly led by domestic players like Naura and ACM.
These aren’t paper achievements. Multiple sources confirmed that the 50% rule is “accelerating results” and forcing rapid quality improvements as domestic suppliers work directly with leading fabs under commercial pressure.
Losers Squeezed: Foreign Equipment Makers Face Strategic Loss
For Western equipment suppliers, the 50% mandate represents a slow-motion strategic catastrophe—even as some maintain strong China revenues in the near term.
The Scale of Exposure
The top five global wafer fabrication equipment manufacturers experienced a 48% year-over-year revenue increase from China in 2024, with China now accounting for 42% of total system sales. At first glance, this seems positive. In reality, it’s a warning sign—companies are enjoying a final surge before the hammer falls.
Applied Materials provides a cautionary tale. The company’s China business dropped from 54% of semiconductor equipment revenue in Q1 2024 to 39% in Q2 2024, representing a loss of approximately $750 million in DRAM business. Applied Materials’ CFO acknowledged that China exposure would decline further to around 29% in Q4, with the expectation that depressed levels would persist for several quarters.
ASML’s revenue from mainland China reached 10.195 billion euros (about $11.16 billion) in 2024, accounting for 36.1% of total sales. Yet management forecasts this will drop to approximately 20% in 2025, reverting toward historical averages as the mandate takes full effect.
The Technological Lock-Out
The financial impact is significant, but the strategic implications are more profound. China represents not just revenue but the world’s fastest-growing semiconductor market and a critical testbed for new equipment technologies.
Bernstein analysts estimate that potential further restrictions could jeopardize up to 50% of China’s wafer fabrication equipment spending, with China’s total equipment spending at $43 billion in 2024 and $41 billion forecast for 2025.
Lam Research, which competes directly with AMEC in etching equipment, has seen its fortunes shift. The company expects China’s share of revenue to normalize around 30% in Q4 2024, down from 37% in Q1, with management noting that spending from domestic Chinese customers specifically would decrease.
Even sectors where Chinese capabilities lag dramatically—like lithography—are experiencing pressure. While ASML maintains dominance in extreme ultraviolet (EUV) lithography for advanced nodes, its deep ultraviolet (DUV) systems for mature nodes face increasing competition as China aggressively develops alternatives and employs multi-patterning workarounds.
The Feasibility Question: Can China Actually Hit 50%?
The ambition is clear. The execution is another matter entirely.
Where China Has Achieved Parity
As of 2024, China’s semiconductor equipment self-sufficiency rate reached 13.6% overall, but this average masks significant variation across different equipment categories.
In specific segments, China has already achieved or exceeded the 50% threshold:
- Photoresist stripping and cleaning: Approximately 50% self-sufficiency, with Naura taking market leadership from Japanese firms
- Chemical mechanical planarization (CMP): China’s market share jumped from 1.5% in 2022 to nearly 11% in 2023
- Dry etching: China reached 11% market share, up from under 3% in 2019
In areas such as etching, a critical chip manufacturing step that involves removing materials from silicon wafers to carve out intricate transistor patterns, the policy is already yielding results.
The Critical Gaps
Lithography remains the Achilles’ heel. China’s leading lithography company, Shanghai Micro Electronics Equipment (SMEE), produces systems roughly equivalent to technology ASML developed 15-20 years ago. For advanced nodes requiring extreme precision, no domestic alternative exists.
China’s domestic equipment industry can handle various stages of semiconductor manufacturing processes (excluding lithography machines), according to TrendForce analysis. Challenges also persist in measurement, coating, development, and ion implantation equipment.
This explains why authorities grant flexibility for advanced production lines. SMIC’s 7-nanometer manufacturing—used to produce Huawei’s breakthrough Kirin 9000s chip—still relies on ASML’s DUV immersion lithography systems combined with multiple patterning techniques to achieve features smaller than the equipment was originally designed to create.
The Timeline Reality
By 2030, China’s mature semiconductor process market (≥22nm) is projected to reach nearly 40% global market share, up from 30% in 2023, according to IDC. This suggests China will dominate older-generation chip production where domestic equipment can compete effectively.
For advanced nodes, the timeline extends much further. Industry experts estimate China remains roughly a decade behind the cutting edge, and the gap may widen rather than narrow for the most sophisticated processes. Each new generation of lithography—from EUV to the emerging High-NA EUV—represents exponentially greater technical complexity.
The Geopolitical Chessboard: Washington’s Dilemma
The 50% mandate didn’t emerge in a vacuum. It’s a direct counter-move to US technology restrictions that began escalating in 2022 and intensified dramatically in 2023.
The Export Control Paradox
A former Naura employee noted that before 2024 export restrictions, domestic fabs like SMIC would prefer US equipment and would not really give Chinese firms a chance. Washington’s sanctions created an inadvertent gift to Chinese equipment makers: captive customers with no alternative suppliers.
The October 2023 US export controls blocked sales of advanced AI chips and sophisticated semiconductor equipment to China, forcing companies like Applied Materials, Lam Research, and KLA to withdraw personnel from Chinese facilities. These restrictions targeted not just finished equipment but also inputs to Chinese domestic equipment makers, attempting to strangle the emerging industry in its cradle.
It hasn’t worked as intended. Instead of crippling China’s chip sector, the controls accelerated exactly what they aimed to prevent: the development of indigenous alternatives.
The State Backing
China established the National Integrated Circuit Industry Investment Fund Phase III in May 2024 with registered capital of 344 billion yuan ($47.5 billion)—larger than the previous two phases combined and representing the largest government semiconductor investment globally.
The fund operates on a 15-year timeline extending to 2039, acknowledging the long-term nature of semiconductor development. China’s Ministry of Finance holds the largest stake at 17%, with five major state banks each contributing approximately 6% of total capital.
This isn’t venture capital seeking quick returns. It’s strategic industrial policy willing to sustain losses for years to achieve technological sovereignty. The fund targets both the entire semiconductor supply chain and specific critical areas including large manufacturing plants, high-bandwidth memory, and advanced AI chips.
Allied Nations Caught in the Middle
Europe, Japan, and South Korea face an impossible position. Their companies—ASML, Tokyo Electron, and others—generated enormous revenue from China, but increasingly must align with US restrictions or risk their own access to American technology and markets.
The Netherlands, under pressure from Washington, restricted ASML from selling its most advanced High-NA EUV lithography machines to China. Japan implemented similar export controls on advanced chipmaking equipment. These allied restrictions close potential loopholes but also accelerate China’s determination to eliminate foreign dependencies entirely.
Taiwan presents perhaps the thorniest dilemma. TSMC, the world’s leading chipmaker, supplies chips to Chinese customers while maintaining advanced fabs in Taiwan that depend on American equipment and technology. Any escalation in US-China tensions or moves toward Chinese reunification could severely disrupt global chip supplies.
Business Strategy Imperatives: What Companies Must Do Now
The 50% mandate forces a fundamental reassessment of China strategy across multiple stakeholder groups.
For Foreign Equipment Makers: The Diversification Imperative
Companies cannot reverse the trend. The question is how quickly to pivot and where to redirect resources.
Short-term (1-2 years):
- Maximize revenue from remaining China business while it lasts
- Accelerate sales to customers in Taiwan, Korea, Japan, and the United States
- Expand service and upgrade offerings for existing installed base in China
Medium-term (3-5 years):
- Diversify manufacturing footprint to reduce dependence on any single geography
- Develop product variants that comply with various export control regimes
- Strengthen positions in advanced packaging, where Chinese competition remains limited
Long-term (5+ years):
- Accept that China will develop domestic alternatives for most equipment categories
- Focus innovation on areas requiring such extreme precision that Chinese suppliers cannot readily replicate
- Build relationships in emerging semiconductor manufacturing regions (India, Vietnam, Eastern Europe)
China spent $41 billion on wafer fabrication equipment in 2024, accounting for about 40% of all purchases worldwide. Losing this market cannot be fully offset, but AI-driven demand in other regions provides a partial buffer.
For Chinese Chipmakers: The Quality-Versus-Sovereignty Tradeoff
Domestic equipment works, but not always as well as foreign alternatives—at least not yet. Chinese fabs must balance production efficiency against strategic imperatives.
SMIC achieved a significant breakthrough with its 7nm process, notably used for manufacturing Huawei’s Kirin 9000s chip, demonstrating that Chinese fabs can produce sophisticated semiconductors despite equipment limitations. However, yields remain lower and costs higher than at TSMC or Samsung using cutting-edge tools.
The pragmatic approach involves tiering:
- Advanced nodes (7nm and below): Use best available equipment, including remaining foreign tools, to maximize competitiveness
- Mature nodes (28nm and above): Aggressively adopt domestic equipment to drive volume and improvements
- Memory and specialty chips: Leverage areas where Chinese equipment has achieved near-parity
For Multinational Tech Companies: The Supply Chain Nightmare
Companies like Apple, Nvidia, and automotive manufacturers face cascading risks. If Chinese chipmakers using domestic equipment cannot match the quality or capacity of global alternatives, supply chains fragment.
The scenarios range from manageable to catastrophic:
- Optimistic: China achieves competent domestic production for mature nodes, bifurcating the global market into “advanced” (TSMC, Samsung, Intel) and “mature” (Chinese fabs) with minimal disruption
- Pessimistic: Quality gaps persist, forcing companies to duplicate supply chains entirely, one using Chinese chips for Chinese markets and another using TSMC/Samsung for everywhere else
Either way, costs increase. China expanded foundry capacity by 15% in 2024 and is scheduled to add another 14% in 2025, creating enormous production capability that must be absorbed somewhere.
The Venture Capital Angle: Where Smart Money Is Moving
The 50% mandate creates asymmetric investment opportunities for those willing to navigate geopolitical complexity.
The Chinese Equipment Thesis
Naura Technology rose to sixth place globally among semiconductor equipment manufacturers in 2024, making it the only Chinese company in the top ten. For investors willing to accept governance and geopolitical risks, Chinese equipment makers offer:
- Revenue visibility: Captive domestic demand virtually guaranteed by policy
- Margin expansion potential: As technology improves, pricing power increases
- Export upside: Eventually, cost-competitive Chinese equipment could compete in other price-sensitive markets
The caveat: US sanctions could expand to block Chinese equipment companies from accessing critical components, and corporate governance in state-backed firms sometimes prioritizes national objectives over shareholder returns.
The Picks-and-Shovels Alternative
Rather than betting on chipmakers or equipment makers directly, sophisticated investors are targeting:
- Materials suppliers: Chemicals, gases, and substrates required regardless of equipment nationality
- Advanced packaging: China lags in this area, creating opportunities for domestic and foreign providers
- Design tools: Chinese chip designers still depend heavily on Synopsys, Cadence, and other EDA providers
These segments face less direct policy pressure while still benefiting from China’s semiconductor expansion.
The 2026-2030 Outlook: Three Scenarios
Scenario 1: Managed Bifurcation (60% probability)
China achieves competent self-sufficiency in mature node equipment by 2027-2028, while advanced nodes remain dependent on limited foreign tool access. The global semiconductor industry splits into parallel ecosystems:
- “Free world”: TSMC, Samsung, Intel leading on advanced nodes using Western/Japanese/Korean equipment
- “China sphere”: Chinese fabs dominating mature nodes with domestic equipment, serving primarily Chinese and developing market customers
Trade continues but within clearly defined boundaries. Western equipment makers lose 50-70% of China revenue but offset partially through AI-driven demand elsewhere.
Scenario 2: Breakthrough Acceleration (25% probability)
Chinese equipment makers advance faster than expected, achieving near-parity with foreign competitors in most categories by 2028-2030. This could occur through:
- Continued talent recruitment from foreign firms
- Breakthroughs in alternative lithography approaches (multi-beam, nanoimprint)
- Brute-force R&D spending enabled by state backing
In this scenario, Chinese equipment companies begin competing globally on cost, threatening Western suppliers’ positions even outside China.
Scenario 3: Technology Wall (15% probability)
Chinese equipment development stalls at current levels, unable to overcome fundamental physics and engineering challenges without access to Western technology and components. The 50% rule remains in place but creates inefficiency, with Chinese fabs producing lower yields and higher defect rates.
This scenario likely triggers more aggressive Chinese action—potentially including forced technology transfer, industrial espionage escalation, or geopolitical moves to secure access to Taiwan’s semiconductor capabilities.
What This Means for You
If you’re reading this as a tech industry executive, the message is clear: the era of a unified global semiconductor supply chain is ending. Every company with significant China exposure needs a bifurcation strategy—yesterday.
If you’re an investor, the 50% mandate creates both risks and opportunities. US equipment makers with high China exposure (Applied Materials, Lam Research, KLA) face structural headwinds regardless of how strong AI demand runs. Chinese equipment makers offer growth but with governance and geopolitical risks. The real opportunity may lie in picks-and-shovels providers and companies with defensible positions in segments where Chinese competition remains distant.
If you’re a policy maker, recognize that export controls alone won’t slow China’s semiconductor development—they may accelerate it. The 50% mandate proves that restrictions create determination, captive markets, and state-backed alternatives. A more effective strategy might focus on maintaining leadership in truly irreplaceable technologies while accepting China’s inevitable progress in commoditized segments.
The Bottom Line
The 50% rule suggests China has concluded that technological decoupling is no longer a risk to manage, but a reality to optimize around, marking a new phase in the global semiconductor standoff.
This isn’t about whether China will develop domestic semiconductor equipment capabilities. That question is answered: they will. The relevant questions are how quickly, how effectively, and what the rest of the world does in response.
The mandate is already producing measurable results—Chinese semiconductor equipment manufacturers set sales records in 2024, with leading companies posting 25-55% revenue growth. Beijing has poured hundreds of billions of yuan into its semiconductor sector through the Big Fund, demonstrating commitment that transcends typical industrial policy.
For Western companies, this represents an $18 billion annual revenue stream gradually slipping away. For China, it’s a forced march toward technology independence that’s happening faster than most observers expected. For the rest of us, it’s a reminder that in geopolitics, sometimes the quietest policies create the loudest consequences.
The semiconductor industry is fragmenting before our eyes, not through dramatic announcements or treaty violations, but through procurement rules that most people will never read. That may be the most important technology story of 2024—and it’s only just beginning to unfold.
What are your thoughts on China’s semiconductor strategy? How should Western companies respond? Share your perspective in the comments below.
Discover more from The Economy
Subscribe to get the latest posts sent to your email.


Markets & Finance
Beyond Singapore’s Borders: How Squeezed SMEs Can Unlock High-Yield Growth Across ASEAN

Faced with escalating domestic overhead, acute labor bottlenecks, and an ultra-saturated local market, Singapore’s small and medium-sized enterprises (SMEs) are approaching an operational inflection point. While the city-state remains an unrivaled global financial hub, domestic cost structures are increasingly compressing profit margins for mid-market businesses. Expanding across Southeast Asia is no longer merely a growth option—it has become a necessity for enterprise resilience and long-term value creation.
The Singapore Pressure Cooker: Why Domestic Growth Has Hit a Ceiling
Singapore SMEs contend with a uniquely challenging operating environment. According to economic assessments from the Monetary Authority of Singapore, structural cost pressures—spanning commercial real estate rents, utility hikes, and rising labor expenses—continue to outpace revenue growth across several non-oil domestic sectors.
Key factors squeezing Singapore SMEs include:
- Manpower Bottlenecks: Tightening foreign worker quotas and elevated salary thresholds under the Strategic Skills Framework have made local talent recruitment highly competitive and expensive.
- Property and Rental Overhead: Commercial and industrial space costs in prime logistics and office hubs remain among the highest in Asia, squeezing operational margins for retail, manufacturing, and services alike.
- Market Saturation: With a population of roughly 6 million, the domestic addressable market limits scale, making revenue compounding difficult without international customer acquisition.
To achieve sustainable multi-year growth, forward-looking business leaders are restructuring their footprint—using Singapore as an intellectual property (IP), treasury, and management headquarters while scaling operations into neighbor economies.
The ASEAN Dividend: Demographics, Digitalization, and Supply Chain Realignment
Southeast Asia represents a vibrant economic bloc of over 680 million consumers, characterized by rapid urbanization, an expanding middle class, and high mobile technology penetration. Research published by the Asian Development Bank highlights that regional GDP growth across ASEAN continues to outpace global averages, fueled by strong domestic demand and cross-border trade integration.
                  +-------------------------------------------------------+
                  |            Singapore Corporate Head Office            |
                  |     (IP, Treasury, Governance, R&D, Tech Core)        |
                  +-------------------------------------------------------+
                                              |
      +-----------------------+---------------+---------------+-----------------------+
      |                       |                               |                       |
      v                       v                               v                       v
+-----------+           +-----------+                   +-----------+           +-----------+
|  Vietnam  |           | Indonesia |                   | Malaysia  |           | Thailand  |
| (Mfg/Tech)|           | (Consumer)|                   | (Logistics|           | (Industrial|
|           |           |           |                   | & Services|           | & Auto Ops|
+-----------+           +-----------+                   +-----------+           +-----------+
Three macro drivers make ASEAN the primary expansion target for Singaporean firms:
- Supply Chain Diversification (“China+1”): Global multinationals and regional enterprises are diversifying manufacturing hubs toward Southeast Asia to enhance supply chain resilience, boosting local business ecosystems.
- Accelerated Digital Transformation: Digital economy report insights from McKinsey & Company reveal that regional cross-border e-commerce, fintech adoption, and digital services are projected to triple in market value by 2030.
- Regional Trade Integration: Agreements such as the Regional Comprehensive Economic Partnership (RCEP) and ASEAN Free Trade Area (AFTA) reduce trade barriers, lower tariffs, and simplify cross-border logistics.
Comparative Expansion Matrix for Target ASEAN Markets
Selecting the right expansion destination depends on sector alignment, talent requirements, and cost structures. The following framework maps core opportunities for Singapore SMEs across major ASEAN growth markets:
| Expansion Market | Primary Growth Drivers | Strategic Cost Advantage | High-Potential Sectors | Market Entry Complexity |
| Vietnam | Rapid industrialization, tech talent pool, strong export orientation | Low manufacturing and engineering labor costs | Precision engineering, electronics, software development | Moderate (Requires navigating local regulatory channels) |
| Indonesia | Massive domestic market (275M+ population), rising consumer class | High consumer volume potential, lower operational costs | B2C e-commerce, consumer tech, logistics, agritech | Moderate to High (Complex licensing & local partner rules) |
| Malaysia | Proximity to Singapore, shared talent language, integrated supply chains | Lower land and talent costs with minimal cultural friction | Cross-border logistics, professional services, food manufacturing | Low (High synergy with SG business models) |
| Thailand | Strong industrial base, advanced infrastructure, EV ecosystem | Cost-effective industrial facilities and skilled labor | Advanced manufacturing, automotive supply, healthcare, tourism tech | Moderate (Language barriers require local executive talent) |
A 4-Step Actionable Roadmap for Overseas Regionalization
Expanding across borders requires structured execution to avoid capital misallocation. Enterprise leaders can adopt this four-phase framework to mitigate market entry risks:
- Leverage Institutional Support and Co-FundingBefore committing capital, utilize government-backed regionalization initiatives. Programs administered by Enterprise Singapore—such as the Market Readiness Assistance (MRA) grant and the Enterprise Development Grant (EDG)—provide co-funding for market studies, legal set-up, and overseas business matching.
- Adopt a “Hub-and-Spoke” Operational ModelMaintain high-value activities (financing, IP management, advanced R&D, regional leadership) in Singapore to preserve institutional trust and regulatory clarity. Establish operational “spokes” in target ASEAN countries to handle high-volume manufacturing, customer support, and local marketing.
- Form Local Joint Ventures and Strategic AlliancesDirect market entry can carry regulatory hurdles and cultural blind spots. Partnering with established in-market distributors or joint-venture partners accelerates distribution access and ensures regulatory compliance.
- Capitalize on Cross-Border Digital InteroperabilityWith initiatives backed by the ASEAN Secretariat to build unified cross-border payment rails (such as real-time QR payment linkages between Singapore, Malaysia, Thailand, and Indonesia), businesses can handle cross-border payments with reduced friction and lower FX transaction costs.
Mitigating Risk: Structural Protocols for Cross-Border Success
While the growth prospects are significant, cross-border expansion presents operational challenges. SME leadership must address key risk categories:
- Regulatory and Foreign Ownership Restrictions: Certain jurisdictions enforce foreign ownership caps in specific sectors. Engaging qualified legal counsel early ensures proper corporate structuring and compliance with local equity mandates.
- Foreign Exchange Exposure: Currency volatility across emerging ASEAN markets can erode operating profits. Implementing formal hedging policies through treasury banking partners mitigates FX exposure.
- Taxation Structuring: Companies must optimize transfer pricing and leverage bilateral Avoidance of Double Taxation Agreements (DTAs) signed between Singapore and ASEAN member states to avoid overlapping tax obligations.
SMEs that treat regional expansion as a strategic imperative rather than a reactive survival tactic can leverage Singapore’s regional anchor status to capture long-term market share across Southeast Asia.
Discover more from The Economy
Subscribe to get the latest posts sent to your email.
Are Asian stock markets rising in 2026?
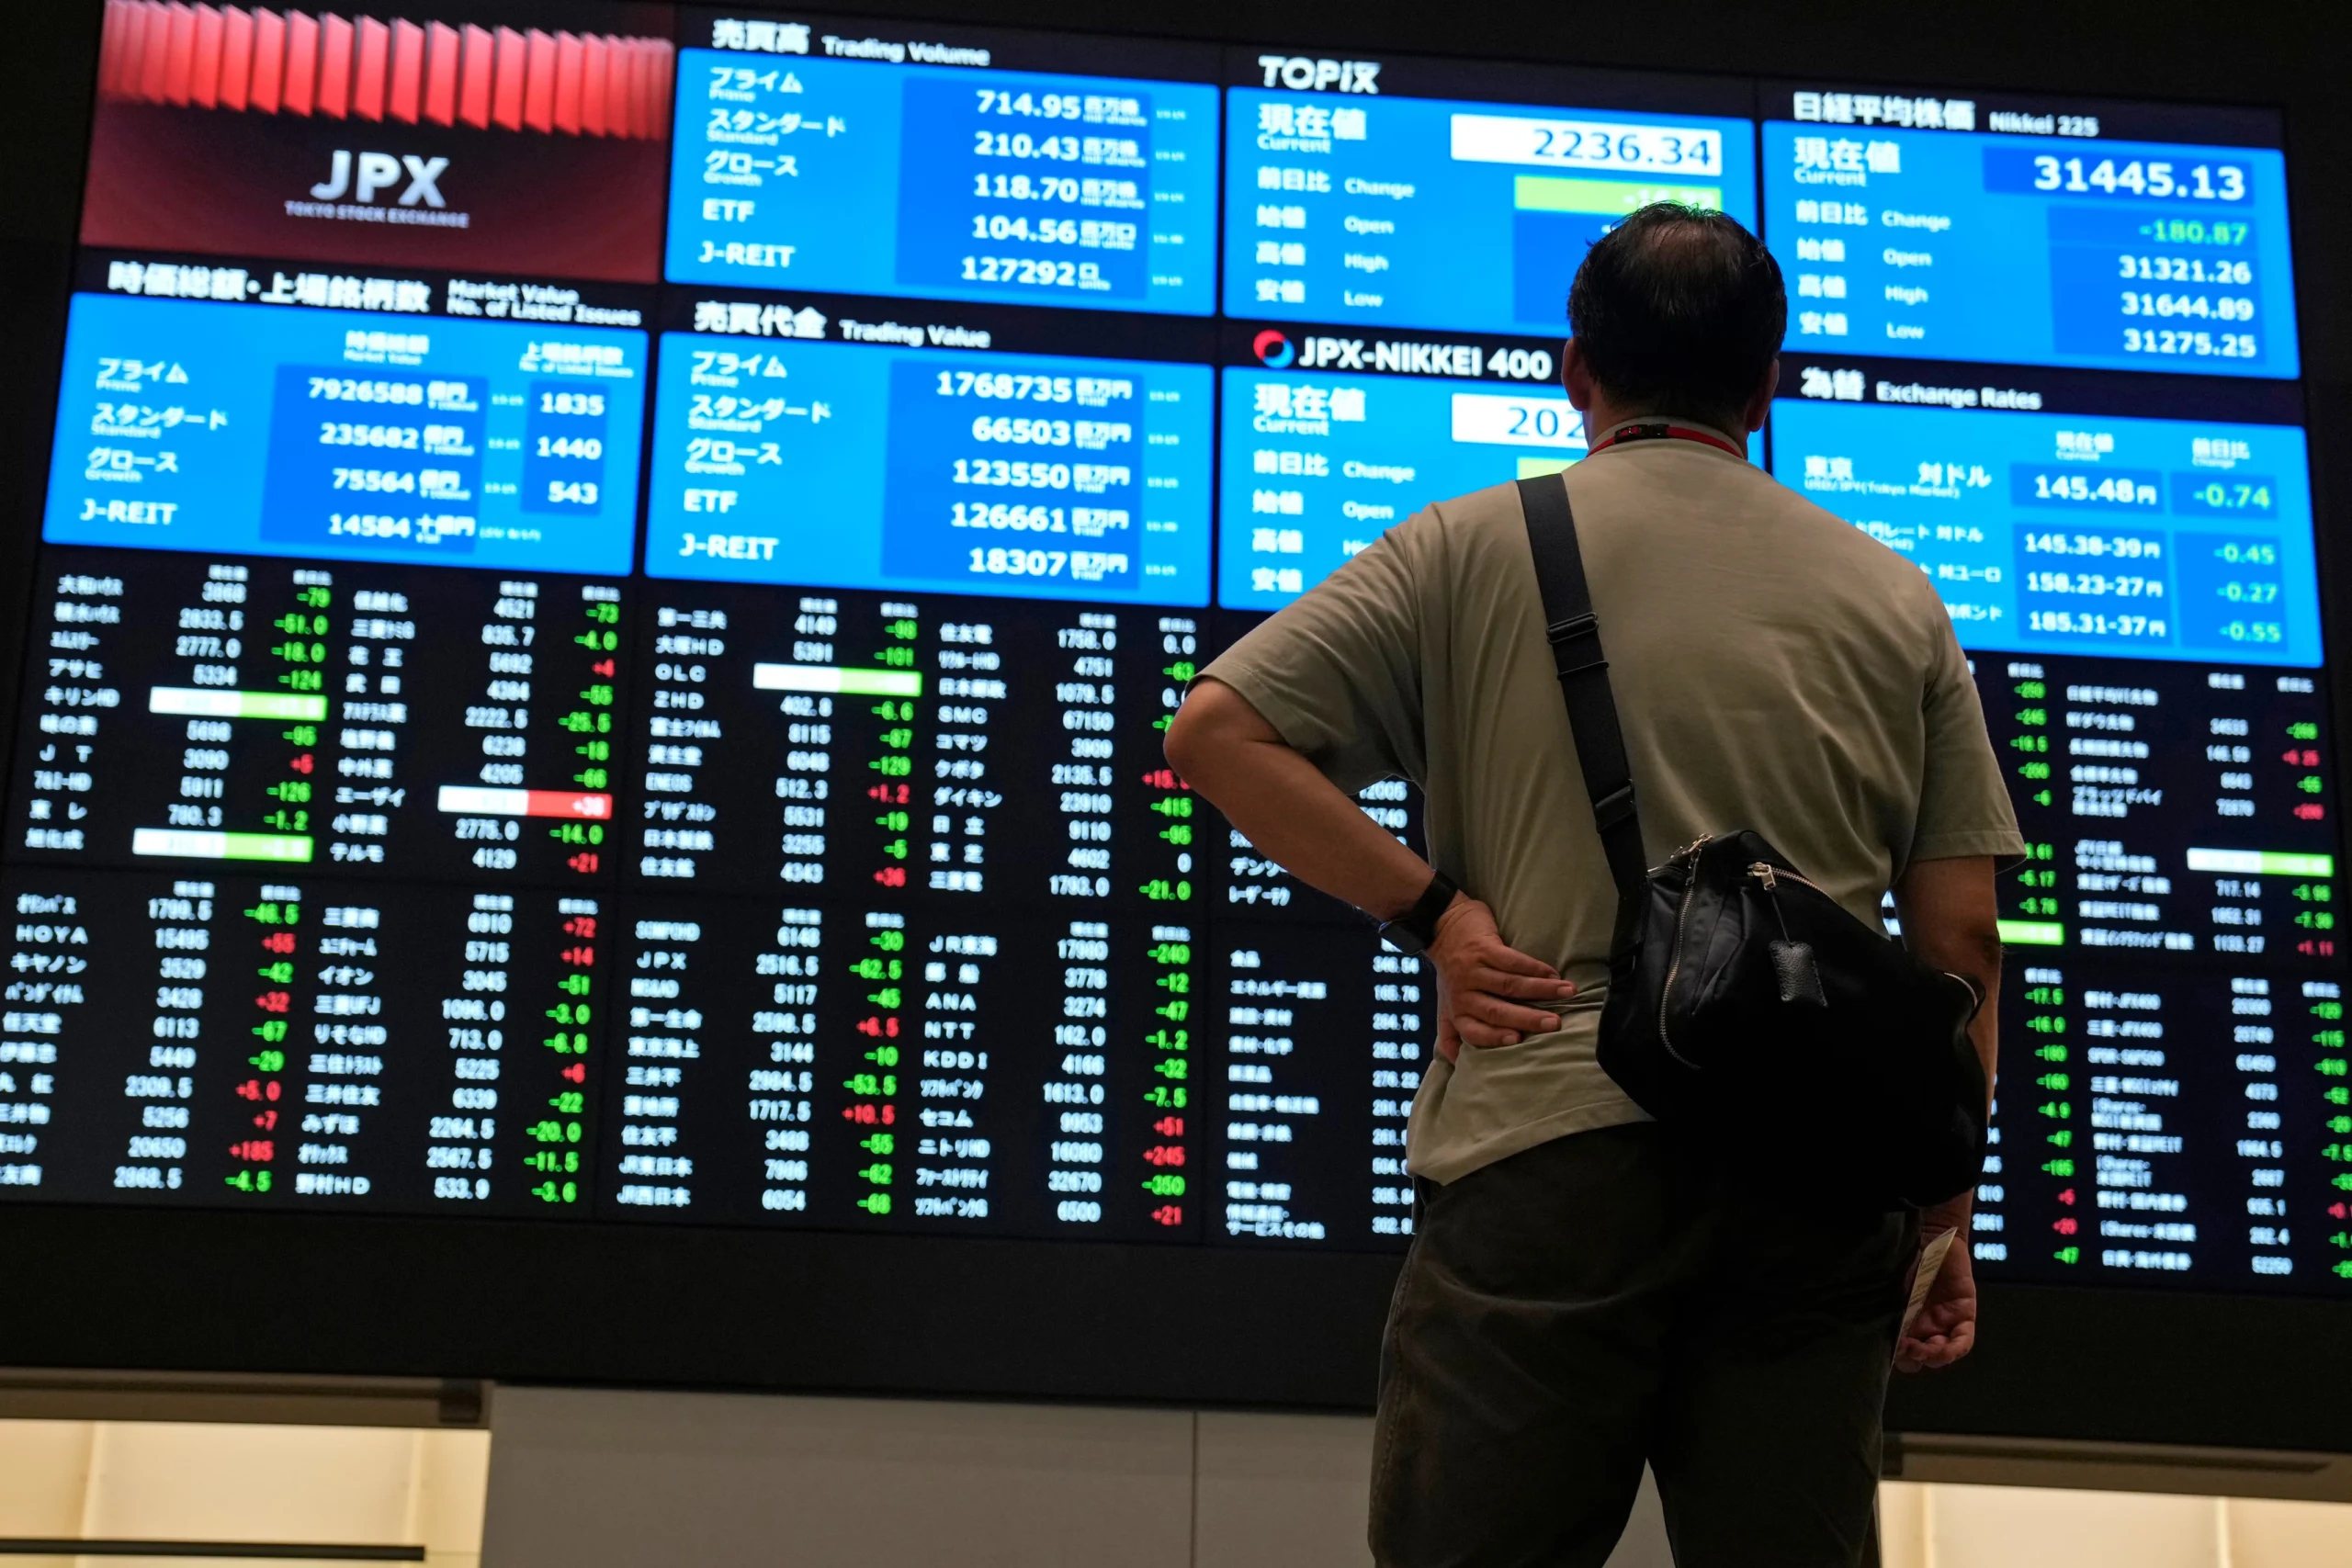
Most of them are, but for very different reasons. Japan’s Nikkei 225 is trading at levels roughly 44% higher than a year ago on continued AI-linked technology strength; China’s benchmark indices climbed to multi-year highs at the start of the year on AI optimism and signs of economic recovery; and Pakistan’s KSE-100 has been one of the most volatile large gainers globally, crossing record highs early in the year before enduring sharp single-session pullbacks in September. Understanding each market separately matters more than treating “Asia” as one trade.
Japan: A 15-Year-Plus Bull Run Meets a Hawkish Central Bank
The Nikkei 225 closed at 65,018.95 on September 18, 2026, gaining 1.38% on the session and sitting 44.34% above where it stood a year earlier, according to data compiled by Trading Economics. That move came even as the Bank of Japan raised its policy rate by 25 basis points to 1.25% — a widely expected but still consequential tightening step, as policymakers balance elevated inflation and wage growth against pressure from U.S. Treasury Secretary Scott Bessent for currency and trade cooperation. Japan’s annual inflation rate held at 1.9% in August, with core inflation at 1.7% — below the Bank of Japan’s 2% target for a seventh straight month, suggesting the central bank still has room to normalize policy gradually rather than aggressively.
Technology and AI-related names have led Japan’s rally, with chip-equipment and materials names such as Advantest and Lasertec posting some of the sharpest single-day gains, echoing similar advances on Wall Street. That correlation is a theme across the region: Asian equity performance in 2026 has tracked the U.S. AI-capex story almost as closely as it has tracked domestic fundamentals.
China: AI Optimism Meets an Overheating Warning
China’s equity markets opened 2026 on a tear. The benchmark CSI 300 Index advanced 1.6% to close at its highest level in four years on January 6, while the Shanghai Composite rose 1.5% to its strongest level since July 2015, fueled by sustained optimism over the country’s AI advances and early signs of broader economic recovery, according to Bloomberg. Materials and technology shares led the advance, and the rally coincided with a robust pipeline of onshore AI-related IPOs.
That said, the rally showed early signs of overheating even in January: the 14-day relative strength index on the Shanghai Composite climbed above 75 — firmly into technical overbought territory — a level it had not touched since the previous September. Momentum has been uneven since; by late July, the Shanghai Composite had pulled back to a 16-week low on the CSI 300 gauge even as the broader index posted modest daily gains, reflecting a market still working through the tension between AI-driven optimism and valuation discipline. On the macro side, the IMF’s own China growth revisions this year have tracked a similar push-pull, with earlier 2025 forecasts putting Chinese growth near 4.8% before moderating toward roughly 4.2% as trade and property-sector headwinds persist.
Malaysia and Singapore: Steady Gains, Regional Correlation
Malaysia’s FTSE Bursa Malaysia KLCI has spent much of 2026 grinding toward multi-year highs rather than posting dramatic single-day swings. The index touched a more-than-six-year high near 1,686 points in early January, according to New Straits Times, and by early September had climbed further to around 1,714–1,715 points, per Bursa Malaysia futures data reported by Bernama, Malaysia’s state news agency. Analysts at Rakuten Trade have described the index as being in a healthy uptrend across both short- and long-term timeframes, with pullbacks read as consolidation rather than a change in trend.
Singapore’s Straits Times Index has moved in tandem with regional sentiment through the year, trading in the high-3,900-point range during mid-2026 sessions alongside comparable moves in Hong Kong’s Hang Seng and South Korea’s Kospi — a reminder that Southeast Asian and Northeast Asian benchmarks remain tightly correlated on any given trading day, even when their underlying economic drivers differ.
Pakistan: The Region’s Most Volatile Outperformer
Featured Snippet Target: Pakistan’s KSE-100 Index began 2026 at a record high above 176,000 points, climbed further past 186,000 and 188,000 in the following days on institutional buying and expectations of a policy rate cut, but has since seen sharp single-session pullbacks — including a 3,078-point, 1.79% drop on September 10 — underscoring how the world’s best-performing frontier market in early 2026 has also been among its most volatile.
The Pakistan Stock Exchange’s rally traces back to a shift in domestic asset allocation: brokerage house Topline Securities described the move from fixed-income instruments into equities — driven by falling returns on traditional savings vehicles — as the primary fuel behind sustained liquidity and elevated valuations, according to coverage from Aaj News. Banking names including United Bank Limited, Habib Bank, and MCB, alongside energy majors like Oil and Gas Development Company, have repeatedly featured among the index’s top contributors on both up and down days.
By early September, the picture had turned choppier. The KSE-100 gained 399 points on September 4 to close at 175,328, per ARY News, before dropping over 3,000 points just days later on September 10 — a reminder that Pakistan’s rally, while historic in percentage terms, remains far more sensitive to single-session sentiment shifts than its larger regional peers.
The Cross-Market Pattern
Three threads tie these otherwise disconnected markets together in 2026. First, AI-linked capital spending is now a genuine cross-border driver — Japanese and Chinese tech names have both rallied on echoes of the same U.S. hyperscaler capex story. Second, central bank policy divergence is widening: Japan is tightening from historically ultra-loose settings, while Pakistan has been cutting rates to support a still-fragile broader economy. Third, frontier and emerging markets — Pakistan chief among them — are delivering far larger percentage swings, in both directions, than developed Asian benchmarks, rewarding investors who can tolerate volatility but punishing those who chase momentum without hedging for pullbacks.
The Bottom Line
Asia’s 2026 story is not one market but five distinct ones moving on different clocks — Japan’s AI-and-rate-hike rally, China’s optimism-versus-overheating tension, Malaysia and Singapore’s steadier regional drift, and Pakistan’s high-beta swings around a genuine structural re-rating. Anyone allocating across the region needs a market-by-market view rather than a single “Asia” thesis.
Next step: Track Bank of Japan policy meetings, China’s Politburo economic guidance sessions, and Pakistan’s State Bank Monetary Policy Committee decisions together — the three events, spaced through the remainder of 2026, are the clearest near-term catalysts for each market’s next move.
Discover more from The Economy
Subscribe to get the latest posts sent to your email.

The World Bank’s June 2026 assessment carries a phrase that should stop any investor mid-scroll: a “lost decade” of development for many emerging markets.
Global growth is projected to slow from 2.9% in 2025 to 2.5% in 2026 — the lowest rate since the COVID-19 pandemic — amid weaker prospects for energy-importing economies and those directly affected by hostilities.
Within that aggregate, Asia is splitting into two distinct groups. Understanding which side an economy falls on is now the primary emerging-market allocation decision.
Key Takeaways
- Global growth: 2.5% in 2026, firming in 2027–28 as energy supplies recover and trade strengthens.
- The revision was brutal. January 2026 projected 2.6% with an upward revision; June cut it.
- India remains the outlier. FY2026-27 growth of 6.6%, rebounding to 7.2% in FY2027-28.
- China decelerates. Growth slowing to 4.4% in 2026 from 4.9%.
- The 2020s are on track to be the weakest decade for global growth since the 1960s.
The Two Reports That Define 2026
The World Bank publishes Global Economic Prospects twice a year, and the gap between the January and June 2026 editions is the story.
January: Cautious Optimism
The January report described a global economy proving more resilient than anticipated despite persistent trade tensions and policy uncertainty, with growth easing to 2.6% in 2026 before rising to 2.7% in 2027 — an upward revision from the previous June forecast.
About two-thirds of that upgrade came from the United States alone.
June: The Energy Shock
By June, the Middle East conflict had driven sharp energy price increases and the projection fell to 2.5%, with emerging market and developing economies facing the weakest per capita income growth since the pandemic.
The Bank explicitly notes that the conflict’s impact on global trade has been partly offset by robust AI-related investment, while consensus inflation expectations picked up notably following the energy price surge. Local-currency bond yields and external bond spreads remained higher in commodity importers.
That last sentence is the whole emerging-market thesis in one line: commodity importers are paying more to borrow at exactly the moment they need to borrow more.
Asia’s Two Tiers
| Economy | Projection | Position |
|---|---|---|
| India | 6.6% FY26-27, 7.2% FY27-28 | Domestic-demand-led, upgraded |
| China | 4.4% in 2026 (from 4.9%) | Export-supported, stimulus-dependent |
| EMDEs (all) | 4.0% in 2026 (from 4.2%) | Slowing |
| EMDEs excl. China | 3.7% in 2026 | Flat versus 2025 |
| United States | 2.2% in 2026 | Tax-incentive supported |
The EMDE-excluding-China figure of 3.7%, unchanged from 2025, is the number that matters most and gets quoted least. Strip out China, and the developing world is not slowing — it simply is not accelerating. Stagnation at a level too low to close income gaps.
The India Case
India stands apart in the June projections. Growth is projected to moderate to 6.6% in FY2026-27 — a 0.1 percentage point upgrade relative to January — before rebounding to 7.2% in FY2027-28, a 0.6 point upgrade.
The moderation reflects private demand cooling under input cost pressures. The rebound reflects structural factors:
- Trade agreements. Implementation of major FTAs with the EU, UK and Australia is described as crucial to offsetting cooling merchandise demand from traditional Western markets.
- FDI sustainability. Trade agreements and structural business reforms are expected to sustainably support inflows across the forecast horizon.
- Fiscal trade-offs. Lower fuel taxes and GST reforms temporarily erode the revenue base, requiring a shift toward slower public capex growth and current spending cuts to avoid deficit spikes.
That last point is the underappreciated risk. India’s growth upgrade is partly financed by revenue concessions that must eventually be reversed or absorbed.
The China Case
China’s projected slowdown to 4.4% in 2026 came with an upward revision of four-tenths of a percentage point from the previous June forecast, attributed to fiscal stimulus and increased exports to non-US markets.
That revision has since been validated by trade data. The question for 2027 is whether export strength can persist if global demand slows to the 2.5% pace the Bank projects.
China’s position is structurally different from India’s: externally driven where India is domestically driven, stimulus-dependent where India is reform-dependent.
What the “Lost Decade” Framing Actually Means
The World Bank’s language is deliberately stark. If current forecasts hold, the 2020s are on track to be the weakest decade for global growth since the 1960s and too low to avert stagnation and joblessness in emerging market and developing countries.
The distributional evidence is concrete: at the end of 2025, nearly all advanced economies enjoyed per capita incomes exceeding their 2019 levels, but about one in four developing economies had lower per capita incomes than before the pandemic.
Chief Economist Indermit Gill framed the underlying tension precisely: the global economy has become less capable of generating growth while appearing more resilient to policy uncertainty — a divergence he warned cannot persist without fracturing public finance and credit markets.
Investment Implications by Tier
Tier 1 — Energy importers in the technology value chain. India, Vietnam, Malaysia, Taiwan, Korea. AI-related export revenues offset higher energy costs. Currency and equity performance has held up.
Tier 2 — Energy exporters outside the conflict zone. Gulf states excluding those directly affected, parts of Africa and Latin America. Favourable terms of trade, fiscal space expanding.
Tier 3 — Energy importers outside the technology chain. Pakistan, Bangladesh, Sri Lanka, Kenya, much of Sub-Saharan Africa. Higher import bills, higher borrowing costs, no offsetting export windfall.
Tier 3 is where sovereign stress concentrates. Higher local-currency bond yields and wider external spreads in commodity importers mean refinancing costs rise as fiscal positions deteriorate.
What This Means for the Global Market in 2027
The 2027 recovery is conditional on two assumptions. Activity is expected to firm in 2027–28 as energy supplies recover and trade strengthens. Both require the conflict to de-escalate. Neither is guaranteed.
AI adoption is the identified upside. The Bank names artificial intelligence adoption, clean energy investment and regional trade agreements as potential long-term recovery catalysts. Only the first is currently delivering at scale.
Sovereign debt is the accumulating risk. Elevated yields in commodity importers compound every year they persist. A 2027 refinancing wave at current spreads would strain multiple frontier sovereigns simultaneously.
Regional trade agreements are the underrated policy lever. India’s FTA implementation is the clearest test case. If it delivers the projected FDI and export offset, it becomes a template for the rest of emerging Asia.
Compare the IMF and World Bank carefully. The Fund projects 3.0% for 2026; the Bank projects 2.5%. The difference is methodological — PPP versus market exchange rate weighting — not a disagreement about the world.
Frequently Asked Questions
What is the World Bank’s global growth forecast for 2026?
The June 2026 Global Economic Prospects projects global growth slowing to 2.5% in 2026, down from 2.9% in 2025 — the lowest rate since the pandemic.
What is India’s projected GDP growth?
India is projected to grow 6.6% in FY2026-27 before rebounding to 7.2% in FY2027-28, both upgrades relative to January 2026 projections.
Why are World Bank and IMF forecasts different?
The World Bank weights using market exchange rates while the IMF uses purchasing-power-parity weights, which gives more weight to faster-growing emerging economies.
What does “lost decade” mean for emerging markets?
The Bank warns the 2020s could be the weakest decade for global growth since the 1960s, with roughly one in four developing economies having lower per capita incomes at end-2025 than in 2019.
Discover more from The Economy
Subscribe to get the latest posts sent to your email.

Stock Market Crash in 2026? Warning Signs, Scenarios and a Calm Investor Checklist

Peso Mexicano vs Dólar Estadounidense: A Practical USD/MXN Guide for October 2026

Is the Stock Market Open on Columbus Day 2026? NYSE, Nasdaq and Bonds Explained

Concert Ticket Prices in 2026: Dynamic Pricing, Fees and How to Buy Safely

High-Yield Savings Accounts in 2026: How to Compare APY Without Chasing a Headline

EU-China Trade Deal 2026: How Beijing and Brussels Avoided a Trade War—and Who Wins

Social Security 2027 COLA Announcement: Date, Formula and What Retirees Should Check

China’s AI Microdrama Boom: How Beijing Is Reshaping Global Media

Q3 2026 Earnings Preview: Can Record Profit Expectations Keep Wall Street’s Rally Alive?

Russia Diesel Deal 2026: Oil Prices and Inflation Risks

Fed Rates 2026: Treasury Yields, Bonds and SGOV Explained

S&P 500 Market Breadth 2026: Weak Rally or Rotation?

The AI Capex Boom: Data Centers Reshaping Growth

Palantir Stock in 2026: Extraordinary AI Growth

PSX Forecast 2026: KSE-100, IMF Reviews & Geopolitics

Middle East War Economics 2026: Oil Prices & Energy Markets

China Stocks Today: Are Big Economies in Asia Nearing a Market Bottom?

Crypto Daily Outlook: Bitcoin, Altcoins, and the Future of Decentralized Finance

Global Pension Systems Ranked: The World’s Best and Worst Retirement Frameworks

World’s Largest Economies: Ranking the Top Global Powers

Elon Musk’s Next Moves: Disrupting the 2026 Global Economy

Pakistan Economy 2026: Inside the SBP’s Balancing Act

GasBuddy Market Insights: How Crude Price Shifts Impact Local Fuel Cost Averages

World Bank & IMF Reports 2026: Why the “3% Growth” Consensus Is Actually a Debate

Crude Oil & Petroleum Market Analysis: OPEC+ Decisions and Price Forecasts

Global Equity Market Divergence: US Tech vs. European Dividend Stocks vs. Asian Growth

IMF & World Bank Global Economic Outlook: Growth Forecasts Across Europe and Asia

Silver Price Today: Why the Xi-Trump AI Standoff Is Fueling a Safe-Haven Rally
-

 Markets & Finance9 months ago
Top 15 Stocks for Investment in 2026 in PSX: Your Complete Guide to Pakistan’s Best Investment Opportunities
-

 Analysis8 months ago
Johor’s Investment Boom: The Hidden Costs Behind Malaysia’s Most Ambitious Economic Surge
-

 Analysis8 months ago
Top 10 Stocks for Investment in PSX for Quick Returns in 2026
-

 Banks9 months ago
Best Investments in Pakistan 2026: Top 10 Low-Price Shares and Long-Term Picks for the PSX
-

 Analysis8 months ago
Brazil’s Rare Earth Race: US, EU, and China Compete for Critical Minerals as Tensions Rise
-

 Investment9 months ago
Top 10 Mutual Fund Managers in Pakistan for Investment in 2026: A Comprehensive Guide for Optimal Returns
-

 Global Economy10 months ago
15 Most Lucrative Sectors for Investment in Pakistan: A 2025 Data-Driven Analysis
-

 Global Economy10 months ago
Pakistan’s Export Goldmine: 10 Game-Changing Markets Where Pakistani Businesses Are Winning Big in 2025