
China Economy
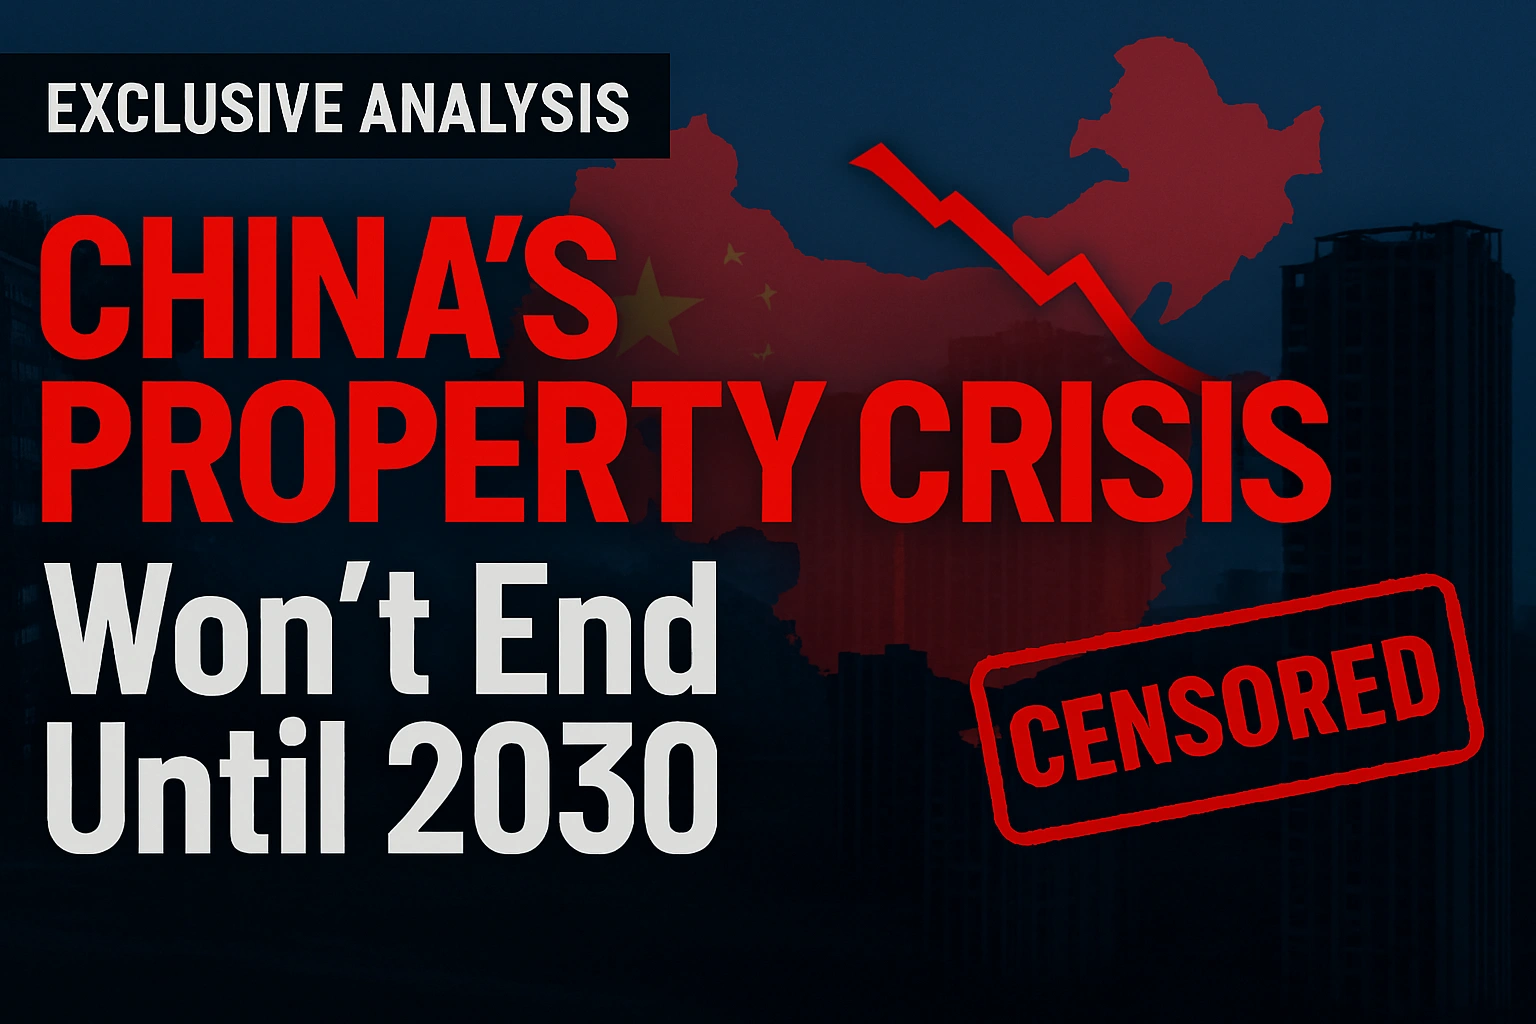
China’s Property Woes Could Last Until 2030—Despite Beijing’s Best Censorship Efforts
The world’s second-largest economy faces a reckoning that no amount of information control can erase
The construction cranes stand frozen against Shanghai’s skyline like monuments to excess. In Guangzhou, half-finished apartment towers cast long shadows over streets where homebuyers once lined up with cash deposits. Across China’s tier-two and tier-three cities, the evidence is impossible to ignore: new home prices dropped 2.4% year-on-year in November 2025, marking the 29th consecutive month of price declines.
This isn’t just another market correction. It’s the unraveling of a $60 trillion real estate ecosystem that powered four decades of unprecedented growth—and here’s what keeps global economists awake at night: despite aggressive government intervention and increasingly sophisticated censorship machinery, this crisis won’t bottom out until 2030.
The Staggering Scale of China’s Property Collapse
Numbers tell stories that social media censors can’t delete. The Index of Selected Residential Property Prices registered a 6.40% year-on-year contraction in Q2 2025, but the human cost cuts deeper. Zhang Wei, 34, has dutifully paid mortgage installments for two years on an apartment in Chongqing that remains a concrete skeleton, unfinished and uninhabitable. His story echoes across hundreds of cities.
The developer collapses read like a who’s who of China’s corporate giants. China Evergrande Group, with over $300 billion in debt, received a liquidation order in January 2024 and was delisted from the Hong Kong Stock Exchange in August 2025. But Evergrande wasn’t alone. China Vanke Co. reported a record 49.5 billion yuan ($6.8 billion) annual loss for 2024, sending shockwaves through a sector that believed state-backed developers were immune to failure.
Country Garden, once China’s largest private developer with 3,000 projects nationwide, defaulted on international bonds in October 2023 after missing payments within a 30-day grace period. Investment in real estate development declined by 14.7% in the first ten months of 2025, with sales of new homes projecting an 8% decrease for the full year, marking the fifth consecutive year of negative growth.
The construction sector tells an equally grim story. The total area of residential projects started declined by 22.55% year-on-year to 536.6 million square meters, while completed residential units fell by 25.81% to 537 million square meters. Construction workers remain unpaid, suppliers face bankruptcy, and the entire supply chain—from cement manufacturers to elevator installers—struggles to survive.
Why This Isn’t Just Another Downturn: The Structural Trap
Understanding why recovery will take until 2030 requires examining the unique architecture of China’s economy. Unlike typical real estate downturns, this crisis strikes at the foundational model that has powered Chinese growth since the 1990s.
The Property-Dependency Problem
Real estate and related industries accounted for approximately 25% of China’s GDP in 2024, despite the ongoing decline. This isn’t simply about construction—it’s about land sales, furniture manufacturing, home appliances, property management, legal services, and financial products all built around housing.
Housing prices have fallen 20% or more since they peaked in 2021, and with 70% of household wealth tied to property, falling home prices directly erode family balance sheets. This creates a vicious cycle: declining wealth leads to reduced consumption, which slows economic growth, which further pressures property values.
The Local Government Fiscal Catastrophe
Here’s where the crisis becomes truly intractable. Revenue from land sales by China’s local governments dropped 16% in 2024 compared with the previous year, after a 13.2% decline in 2023. But land sales aren’t just one revenue stream among many—they’ve been the primary funding mechanism for local governments since the 1990s.
Local Government Financing Vehicles (LGFVs), the shadow banking entities that local officials created to circumvent borrowing restrictions, are now drowning. Total debt raised directly by local governments and via their financing vehicles now stands at around 134 trillion yuan, equal to roughly $19 trillion.
These LGFVs were designed with a simple assumption: land values would continue rising, providing both collateral for new loans and revenue from sales to service existing debt. That assumption has catastrophically failed. The call for LGFVs to buy land to create revenue for local governments made matters worse, turning land from a key source of revenue into a source of new debt.
The Inventory Overhang
The inventory turnover ratio in China shortened by five months from its peak of 25.9 months in April 2025, but at the current pace, it may take another year and a half for the clearance cycle to reach 12-18 months—a relatively healthy range. That’s optimistic. In many tier-three and tier-four cities, years’ worth of unsold inventory sits vacant, with no clear demand in sight.
The math is unforgiving. Even if sales stabilize tomorrow, clearing existing inventory while developers and local governments simultaneously restructure trillions in debt requires time measured in years, not quarters.
Censorship vs. Economic Reality: When Propaganda Meets Balance Sheets
Beijing has deployed its formidable censorship apparatus with surgical precision. In less than three weeks, social media platforms Xiaohongshu and Bilibili removed more than 40,000 posts under a “special campaign” to regulate online real estate content. The Shanghai branch of the Cyberspace Administration led efforts to scrub negative sentiment about housing markets from social media.
The censorship strategy extends beyond simple post deletion. After authorities urged platforms to clean up material containing problems such as “provoking extreme opposition, fabricating false information, promoting vulgarity, and advocating bad culture,” the Cyberspace Administration of China announced in early 2025 that platforms had removed more than a million pieces of content.
This represents a coordinated campaign to control the narrative around the property crisis. Posts discussing falling home values, developer defaults, or economic pessimism are systematically removed. Even discussions of the Zhuhai vehicular attack in November 2024 were censored, part of a broader effort to suppress anything that might undermine social stability.
But here’s the fundamental problem with censoring an economic crisis: you can delete social media posts, but you can’t delete non-performing loans. You can remove hashtags about Evergrande’s default, but you can’t remove the actual debt from bank balance sheets. You can silence influencers discussing property values, but you can’t force buyers into a market where confidence has evaporated.
The contrast between official statements and ground-level reality grows starker by the month. State media emphasizes “stability” and “gradual recovery,” while sales of the top 100 developers plunged 36% in terms of value in November 2025 from a year earlier. Beijing announces stimulus packages, yet investment in fixed assets, which includes property, contracted 2.6% over the January through November period compared with a year earlier.
The 2030 Timeline: Breaking Down the Recovery Math
Why 2030? The projection isn’t arbitrary—it’s based on the time required to work through structural imbalances that took decades to build.
Inventory Clearance: 3-4 Years Minimum
Even optimistic scenarios require 2027-2028 to clear excess housing inventory in major cities, and potentially 2029-2030 for tier-three and tier-four cities. This assumes sales don’t deteriorate further—an assumption that grows shakier as demographic headwinds intensify.
Developer Balance Sheet Repair: 4-6 Years
Dozens of Chinese developers have been approved for debt restructuring plans since the start of 2025, clearing more than 1.2 trillion yuan ($167 billion) in liabilities. But this represents a fraction of total developer debt. The restructuring process—negotiating with creditors, selling assets, and gradually rebuilding financial viability—typically requires multiple years even in the best circumstances.
Local Government Fiscal Restructuring: 5-7 Years
This is the longest and most complex component. Beijing authorized 10 trillion yuan in local debt issuance—to be disbursed over five years—to address hidden obligations in 2024. But this merely refinances existing debt at lower interest rates; it doesn’t create new revenue sources.
The fundamental problem remains: local governments structured their finances around continuously rising land values. Rebuilding fiscal sustainability requires either dramatically cutting expenditures (politically painful and economically damaging) or finding alternative revenue sources (difficult and slow to implement).
Demographic Drag: Permanent Headwind
China’s working-age population is shrinking, and urbanization—the force that drove housing demand for three decades—has plateaued. These aren’t cyclical issues that resolve with stimulus; they’re structural realities that reduce baseline housing demand permanently.
Historical Parallels: Lessons from Japan’s Lost Decades
The comparison to Japan’s 1990s property bubble isn’t perfect, but it’s instructive. By 2004, prime “A” properties in Tokyo’s financial districts had slumped to less than 1 percent of their peak, and Tokyo’s residential homes were less than a tenth of their peak. It took until 2007—16 years after the bubble burst—for property prices to begin rising again.
From 1991 to 2003, the Japanese economy grew only 1.14% annually, while the average real growth rate between 2000 and 2010 was about 1%. What was initially called the “Lost Decade” became the “Lost Two Decades,” and many economists now reference “Lost Three Decades.”
Japan’s experience demonstrates several sobering realities:
Balance sheet recessions take years to resolve. Even with aggressive monetary easing (Japan pioneered zero-interest-rate policy in the late 1990s) and massive fiscal stimulus, deleveraging proceeds slowly. Households and corporations prioritize debt repayment over spending and investment.
Zombie companies drain economic vitality. Banks kept injecting funds into unprofitable firms that were too big to fail, preventing capital reallocation to productive uses. China faces a similar risk with its state-owned enterprises and developers.
Property-driven wealth effects create powerful negative feedback loops. As Japanese real estate values declined, household wealth evaporated, consumption stagnated, and deflation became entrenched. China’s even greater concentration of household wealth in property suggests potentially worse wealth effects.
The key difference: China’s crisis is arguably more structurally complex. Japan’s property bubble was primarily driven by speculative excess and loose monetary policy. China’s bubble involved speculation plus local government fiscal dependency plus shadow banking plus a fundamental economic model built around property development. Unwinding this requires more than monetary and fiscal tools—it requires redesigning the growth model itself.
Global Ripple Effects: No Crisis Is an Island
China’s property troubles send shockwaves far beyond its borders. Australia and Brazil, major commodity exporters, already face reduced demand for iron ore, copper, and other construction materials. European luxury brands that catered to China’s affluent property developers and homebuyers report softening sales.
The exposure runs deeper than trade flows. Foreign investors hold portions of Chinese developer bonds, though many have already taken massive losses. More concerning are the indirect linkages: Chinese state-owned companies with overseas investments potentially scaling back as domestic pressures mount, Chinese tourists and students spending less abroad as household wealth declines, and geopolitical implications of a economically stressed superpower.
Financial contagion risks remain contained for now—China’s capital controls and state banking sector provide insulation. But the growth drag is unavoidable. China’s housing market correction continues as an ongoing headwind, with KKR’s chief economist for Greater China estimating a 1.5 percentage point dent on China’s gross domestic product in 2025, compared with 2.5 percentage points in 2022.
What Tier-1 Companies Should Do Now
For multinational corporations and investors, the 2030 timeline requires strategic adjustments:
Diversify China exposure. Companies heavily dependent on Chinese property-related demand should accelerate diversification into other Asian markets or sectors. The “China-only” growth strategy needs fundamental reevaluation.
Watch local government creditworthiness. Companies with receivables from Chinese local governments or infrastructure projects face rising payment risks. Credit insurance and careful monitoring of local fiscal conditions are essential.
Reconsider real estate collateral. Lenders and investors using Chinese property as collateral should reassess valuations aggressively. The assumption that property values provide a floor has proven catastrophically wrong.
Monitor consumer wealth effects. Consumer-facing businesses should prepare for years of constrained spending as household wealth remains depressed. The Chinese consumer, long expected to drive global growth, faces significant headwinds.
Prepare for policy volatility. Beijing will likely cycle through various stimulus measures, creating temporary market movements. Distinguishing genuine structural improvements from short-term liquidity injections is critical.
The Painful Path Forward
Beijing recognizes that the core issue lies in reducing local governments’ dependence on LGFVs, with Premier Li Qiang underscoring the need to “remove government financing functions from local financing platforms and press ahead with market-oriented transformation”. This is the right diagnosis, but the treatment will be painful and prolonged.
“China’s property crisis represents more than a cyclical downturn—it’s the unwinding of a growth model that took 30 years to build. Recovery to sustainable equilibrium requires 5-7 years minimum, with 2030 representing the earliest realistic bottom under optimistic scenarios. Censorship can control information but cannot alter the underlying economics.“
China needs to rebuild its entire fiscal architecture. This means new tax structures, revised central-local government responsibilities, transparent budget constraints, and allowing insolvent entities to actually fail rather than propping them up indefinitely. Each of these reforms faces powerful resistance from vested interests.
The alternative—continuing to refinance bad debts, prop up zombie developers, and hope for a return to property-driven growth—merely extends the crisis. It’s Japan’s playbook from the 1990s, and the results speak for themselves.
Conclusion: When Censorship Meets Economic Gravity
Beijing’s censors can scrub social media clean of negative sentiment. They can delete posts, suspend accounts, and create the digital appearance of stability. What they cannot do is delete the structural imbalances in China’s economy, rewrite the math of debt-to-GDP ratios, or manufacture demand in a demographically declining society with excess housing supply.
The 2030 timeline isn’t pessimism—it’s arithmetic. Clearing inventory, restructuring debt, rebuilding local government finances, and allowing new economic models to emerge requires time measured in years, not quarters. Japan’s experience, with similar structural challenges but arguably simpler economics, took more than a decade even with aggressive policy responses.
For global businesses, investors, and policymakers, the implications are profound. The Chinese growth engine that powered the global economy for three decades is fundamentally transforming. The property-driven model is over, and what replaces it remains uncertain.
The censors can control the narrative on Weibo. They cannot control economic reality. And economic reality suggests that 2030 marks not the beginning of recovery, but merely the year when China might finally hit bottom—if, and only if, Beijing pursues genuine structural reforms rather than continued extend-and-pretend tactics.
For hundreds of millions of Chinese families like Zhang Wei’s, still paying mortgages on unfinished apartments, that timeline offers cold comfort. But it offers something perhaps more valuable: honesty about the scale of the challenge ahead. No amount of censorship can change what the numbers tell us—this is a crisis that will define China’s next decade.
Data Sources :
This analysis draws from National Bureau of Statistics of China, International Monetary Fund reports, Bloomberg Intelligence, Goldman Sachs research, and major property developer financial statements through December 2025. Statistical projections are based on historical recovery timelines from comparable property crises, adjusted for China-specific structural factors.
Discover more from The Economy
Subscribe to get the latest posts sent to your email.


China Economy
China’s Growth Slips to a Four-Year Low: Why Beijing Still Won’t Pull the Stimulus Trigger

Introduction
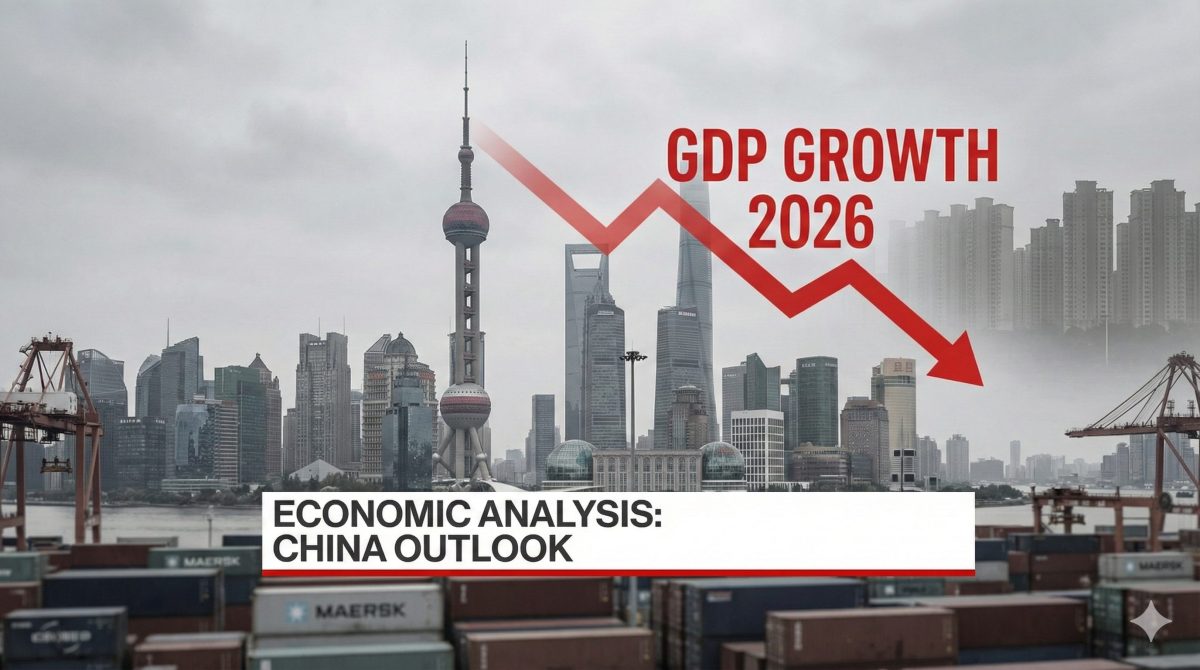
China’s economy expanded just 4.3% in the second quarter of 2026, the weakest quarterly pace since late 2022, missing economists’ 4.5% consensus forecast and slowing sharply from 5% growth in the first quarter (CNBC). The reading came in below Beijing’s own full-year target range of 4.5% to 5% — already the least ambitious growth goal China has set in decades — and has intensified calls for fresh stimulus even as policymakers show little appetite for aggressive intervention (CNBC).
What’s Actually Slowing
The slowdown is being driven by an accelerating slide in investment and stubbornly subdued consumption, even as exports have remained comparatively resilient — helped, paradoxically, by a global oil shock that boosted demand for Chinese goods in some categories even as it squeezed household budgets in others (WHBL/Reuters). Reuters’ polling of analysts projects growth will edge up slightly to 4.6% in the third quarter before easing to 4.5% in the fourth, putting full-year 2026 growth at roughly 4.6%, down from 5.0% in 2025 and expected to slow further to 4.4% in 2027 (WHBL/Reuters).
Notably, one bright spot within the investment slump is technology: surging tech-related imports point to a deepening domestic AI infrastructure buildout, with autos and consumer electronics adding further momentum even as broader fixed-asset investment weakens (CNBC).
The Deflation Problem Beijing Can’t Shake
Underlying the growth numbers is a more persistent structural issue: China’s producer prices have now fallen for roughly three years running, undercutting corporate profitability and discouraging the kind of household spending that would normally pull the economy out of a slowdown (FXStreet). When prices fail to rise, consumers have less incentive to spend “today,” a dynamic that suppresses GDP and forces the central bank to actively target positive inflation rather than simply react to it (FXStreet). Analysts at FxPro describe China as a continued “net exporter of deflation” to the rest of the world — as its own overcapacity pushes discounted goods into global markets, applying disinflationary pressure well beyond its borders (FXStreet).
Why Beijing Is Holding Back on Stimulus
Despite the weak headline numbers, most analysts expect no aggressive stimulus action from the late-July Politburo meeting unless growth deteriorates more sharply. The reasoning is twofold: exports have remained resilient, and policymakers remain more focused on curbing excess factory capacity to fight deflation than on further juicing demand, which risks worsening the overcapacity problem that is driving deflation in the first place (WHBL/Reuters).
That said, fiscal policy is expected to accelerate through the second half of the year. Beijing has set a budget deficit of around 4% of GDP for 2026 and lined up heavy government bond issuance specifically to shore up growth after early-year support was front-loaded and then faded (WHBL/Reuters). Capital Economics expects growth to pick up over the second half as this fiscal support ramps up, while cautioning that domestic overcapacity will remain entrenched — meaning China’s economy stays structurally reliant on exports for growth rather than a genuine consumption rebound (WHBL/Reuters). Analysts polled by Reuters expect the People’s Bank of China to hold its key seven-day reverse repo rate unchanged for the remainder of 2026, signaling that Beijing sees this as a fiscal problem rather than a purely monetary one (WHBL/Reuters).
The Trade War Backdrop
The slowdown is unfolding against continued tensions with trade partners, including the United States, which have weighed on export growth even as it has held up better than domestic demand (CNBC). U.S. tariffs specifically are cited as a factor exacerbating China’s domestic deflationary trend by reducing demand for Chinese goods abroad, compounding the overcapacity problem at home (FXStreet). Analysts note that a meaningful reversal of China’s deflationary spiral would likely require either a Federal Reserve rate cut that eases global financial conditions, or a easing of the tariff regime directly — neither of which is fully within Beijing’s control (FXStreet).
What to Watch Next
- The late-July Politburo meeting: the clearest near-term signal of whether Beijing shifts from measured fiscal support to a more aggressive stimulus posture.
- Producer price index trends: continued multi-year declines would reinforce the deflation narrative and pressure corporate margins further.
- Bond issuance pace: heavy issuance against a 4%-of-GDP deficit target will be a key gauge of how quickly fiscal support actually reaches the real economy.
- U.S.-China trade signals: any easing of tariffs would provide more relief to Chinese exporters than domestic policy alone is currently offering.
Key Takeaways
- China’s Q2 2026 GDP growth of 4.3% was its weakest since late 2022, missing forecasts and falling below Beijing’s own full-year target range.
- Producer prices have declined for roughly three years, cementing China’s role as a net exporter of global deflation.
- Beijing is prioritizing capacity reduction over demand-side stimulus, betting that fiscal spending — not rate cuts — will carry the second-half recovery.
- Full-year 2026 growth is forecast at around 4.6%, cooling further to 4.4% in 2027 as structural export-reliance persists.
- A genuine reversal of China’s deflation trend likely depends on external factors — Fed policy or US tariff relief — as much as domestic stimulus.
Sources: CNBC, WHBL/Reuters, FXStreet
Discover more from The Economy
Subscribe to get the latest posts sent to your email.
China’s economy has just delivered its weakest quarterly result since the depths of the pandemic recovery, and the number that matters most isn’t the headline growth figure — it’s what Beijing does, or doesn’t do, about it.
The Numbers Behind the Miss
Gross domestic product expanded 4.3 percent in the April-to-June period, according to the National Bureau of Statistics, missing economists’ forecast of 4.5 percent and slowing sharply from 5 percent in the first quarter. Crucially, that print came in below Beijing’s own full-year target range of 4.5 to 5 percent — described by CNN as the least ambitious goal Beijing has set in decades — and represents a rare public admission of economic weakness for a government that has long leaned on infrastructure investment and exports to mask domestic softness.
An accelerating slide in fixed investment, alongside subdued consumption, is doing most of the damage. Reuters polling ahead of the release had already flagged that weak domestic demand was offsetting the boost from resilient exports during the global oil shock triggered by the Iran conflict.
The Export Paradox
Here is the twist most coverage has undersold: China’s exports haven’t collapsed — in some categories they’ve been the standout performer. Higher energy costs stemming from the war in Iran have actually helped pull China out of one of its longest deflationary stretches on record, as global buyers seeking to reduce fossil-fuel exposure have turned to Chinese batteries, electric vehicles and clean-energy technology.
Macquarie analysts found that chips, computer parts and power equipment accounted for roughly half of China’s export growth in the first half of 2026, underscoring how intertwined China’s growth engine has become with global AI infrastructure spending — even as its domestic property and consumption engines continue to sputter.
Will Beijing Blink on Stimulus?
All eyes now turn to the Politburo’s expected late-July meeting. The consensus among analysts is caution rather than a bazooka. Capital Economics expects growth to pick up in the second half as fiscal support ramps up, but warns that entrenched domestic overcapacity means China’s economy will remain structurally reliant on exports rather than consumption for growth. UOB economist Woei Chen Ho told CNN that a large-scale stimulus package appears unlikely, with selective, targeted measures instead more probable to stabilise investment and consumption.
Beijing has already set a budget deficit of roughly 4 percent of GDP for 2026 and lined up heavy bond issuance, with GDP growth forecast to edge up modestly to 4.6 percent in the third quarter before easing again in the fourth, according to Reuters’ economist poll.
Deflation Still the Deeper Problem
Even with the export-led relief, China’s deflationary pressure has not disappeared. Producer prices have now fallen for well over two years running, with July’s year-on-year decline running at roughly 3.6 percent even as consumer inflation hovers near zero. Analysts note this dynamic effectively exports deflation to trading partners already grappling with tariff-driven cost pressures — complicating monetary policy from Washington to Jakarta.
Why It Matters for Southeast Asia and the Gulf
China remains the dominant trading partner for much of Southeast Asia and a major source of imports for Pakistan. A structurally slower, export-dependent China means continued downward pressure on regional manufacturing prices, but also sustained demand for the commodities and components that feed its clean-energy export machine — a dynamic ASEAN economies from Malaysia to Indonesia are positioning to capture, as detailed in our companion coverage of the region’s investment inflows.
Discover more from The Economy
Subscribe to get the latest posts sent to your email.

China’s National Bureau of Statistics reported second-quarter GDP growth of 4.3%, missing analyst forecasts of 4.5% and falling below Beijing’s own 4.5–5% annual target — the lowest target range the country has set since it began publishing such figures in 1991 (CNN; NPR). It is the weakest quarterly print since the pandemic-disrupted final quarter of 2022, and it lands at the mid-point of a year already reshaped by the Iran war’s oil shock.
Two Economies, One Government
Economists including Natixis’s Alicia Garcia-Herrero describe an increasingly pronounced “two-track economy”: a thriving export engine — car exports topped one million units for the first time in June and semiconductor and computer-part shipments surged — running alongside a domestic consumption base still weighed down by a property slump and cautious households (CNN). Retail sales rose just 1% year-over-year in June, while fixed asset and property investment continued to contract, with property investment down roughly 18% (Reuters via WTAQ).
The Uncovered Angle: A Widening Surplus Meets a Fragile World
China’s trade surplus widened to $125.6 billion in June even as crude oil imports fell to near decade lows — evidence that Beijing is managing the Hormuz-driven energy shock better than most importers, while simultaneously exporting the industrial overcapacity problem to trading partners. That widening surplus is already straining relations with the European Union, and it has direct implications for manufacturing competitors across Southeast Asia and South Asia, including Pakistan’s textile and Malaysia’s electronics sectors, which now compete more directly with subsidised Chinese EV, battery and solar exports flooding third markets (CNN; IndexBox).
What Happens Next: The Politburo’s July Decision
Convera’s APAC strategist Shier Lee Lim frames the miss as strengthening the case for additional stimulus at the July Politburo meeting, potentially through faster special local government bond issuance or new policy financing tools rather than a formal budget revision (WTAQ). The IMF has already nudged its 2026 China growth forecast up slightly to 4.6%, while projecting a further slowdown to 4.1% in 2027 as the AI and robotics-led export boom fails to translate into broad-based job creation (IndexBox).
Why Cross-Border Investors Should Care
For Pakistan, whose CPEC-linked trade and infrastructure financing remains closely tied to Chinese capital flows, and for Malaysia and Singapore, whose electronics and semiconductor sectors sit downstream of Chinese supply chains, the composition of any Beijing stimulus matters more than the headline growth number. A consumption-focused package would support Southeast Asian consumer and tourism exports; an infrastructure-heavy package would deepen the commodity and industrial-goods relationship that already dominates trade with Indonesia and Malaysia.
The Bottom Line
China’s growth model is becoming structurally unbalanced in a way that a single quarter of stimulus cannot fix. Cornell economist Eswar Prasad’s assessment — that heavy state and private investment in frontier technology is running well ahead of job-creating sectors — points to a slow-burn risk for global trade partners that goes well beyond this quarter’s data print (IndexBox).
Discover more from The Economy
Subscribe to get the latest posts sent to your email.

Pakistan Gulf Investment Outflows 2026: Peace Deal Stakes Explained

Canada Trade Diversification 2026: China, Indonesia, UAE Deals Explained

US Forced-Labour Tariffs on 60 Countries: The Hidden Trade Shock of 2026

Global Central Banks 2026: Fed, BoE and BoJ Decisions Could Reshape Markets

Gulf Capital Retreat From Pakistan 2026: UAE Loan Freeze & What It Means

Pakistan’s Most Reliable Export Is Its People: Remittances Hit $41.6 Billion, Overtaking Total Exports

Indonesia’s Confidence Problem: Record Investment, a Sinking Rupiah, and a Widening Credibility Gap

Down But Not Out: Inside the Slow Sinking of Russia’s War Economy

China’s Growth Slips to a Four-Year Low: Why Beijing Still Won’t Pull the Stimulus Trigger

The Johor-Singapore Corridor: How Malaysia Became Southeast Asia’s AI Infrastructure Powerhouse

Canada’s Economy ‘On Pause’: Inside the CUSMA Deadline That Passed Without a Deal

Dubai’s Millionaire Magnet: How the UAE Turned Middle East Turmoil Into a Capital Safe-Haven Boom

Britain’s Sixth Prime Minister in a Decade: What Starmer’s Exit Means for Gilts, Sterling and Your Portfolio

Anthropic Offers Up to $600,000 Salary for Critical IPO Role as AI Giant Prepares for Wall Street Debut

Carry Trade Unwind 2026: How the Yen’s Snapback Triggered a Global Margin Call

AI Bubble Warning 2026: Why BIS, IMF and Bank of England Fear a Market Crash

BRICS De‑Dollarization Strategy Takes Shape with $15 Billion Local‑Currency Push

The AI Super Bubble Is Ready to Burst

Russia Bans Diesel Exports 2026: Global Fuel Market Impact Explained

Strait of Hormuz Blockade 2026: Oil Prices Surge 9% as US-Iran Conflict Reignites

Private Credit Warning: Most BDCs Turn Unprofitable in 2026, Reuters Finds

IMF Cuts Pakistan Growth Forecast, Raises Inflation to 8.4%

Bitcoin $150k Milestone Achieved as US Sovereign Crypto Pivot Looms
Gulf Capital Retreat From Pakistan 2026: UAE Loan Freeze & What It Means

India Economic Rise 2026: How the Subcontinent Toppled Japan

Strait of Hormuz 2026: Why Markets Still Don’t Trust It’s Open

China Housing Market Turnaround: White‑List Model Stabilises Prices

Chipmakers Just Lost 6.7% in Two Days: Inside the Great AI Trade Rotation
-

 Markets & Finance7 months ago
Top 15 Stocks for Investment in 2026 in PSX: Your Complete Guide to Pakistan’s Best Investment Opportunities
-

 Analysis5 months ago
Johor’s Investment Boom: The Hidden Costs Behind Malaysia’s Most Ambitious Economic Surge
-

 Analysis5 months ago
Top 10 Stocks for Investment in PSX for Quick Returns in 2026
-

 Analysis6 months ago
Brazil’s Rare Earth Race: US, EU, and China Compete for Critical Minerals as Tensions Rise
-

 Banks6 months ago
Best Investments in Pakistan 2026: Top 10 Low-Price Shares and Long-Term Picks for the PSX
-

 Investment7 months ago
Top 10 Mutual Fund Managers in Pakistan for Investment in 2026: A Comprehensive Guide for Optimal Returns
-

 Global Economy7 months ago
15 Most Lucrative Sectors for Investment in Pakistan: A 2025 Data-Driven Analysis
-

 Global Economy7 months ago
Pakistan’s Export Goldmine: 10 Game-Changing Markets Where Pakistani Businesses Are Winning Big in 2025