
China Economy
China’s Property Woes Could Last Until 2030—Despite Beijing’s Best Censorship Efforts
The world’s second-largest economy faces a reckoning that no amount of information control can erase
The construction cranes stand frozen against Shanghai’s skyline like monuments to excess. In Guangzhou, half-finished apartment towers cast long shadows over streets where homebuyers once lined up with cash deposits. Across China’s tier-two and tier-three cities, the evidence is impossible to ignore: new home prices dropped 2.4% year-on-year in November 2025, marking the 29th consecutive month of price declines.
This isn’t just another market correction. It’s the unraveling of a $60 trillion real estate ecosystem that powered four decades of unprecedented growth—and here’s what keeps global economists awake at night: despite aggressive government intervention and increasingly sophisticated censorship machinery, this crisis won’t bottom out until 2030.
The Staggering Scale of China’s Property Collapse
Numbers tell stories that social media censors can’t delete. The Index of Selected Residential Property Prices registered a 6.40% year-on-year contraction in Q2 2025, but the human cost cuts deeper. Zhang Wei, 34, has dutifully paid mortgage installments for two years on an apartment in Chongqing that remains a concrete skeleton, unfinished and uninhabitable. His story echoes across hundreds of cities.
The developer collapses read like a who’s who of China’s corporate giants. China Evergrande Group, with over $300 billion in debt, received a liquidation order in January 2024 and was delisted from the Hong Kong Stock Exchange in August 2025. But Evergrande wasn’t alone. China Vanke Co. reported a record 49.5 billion yuan ($6.8 billion) annual loss for 2024, sending shockwaves through a sector that believed state-backed developers were immune to failure.
Country Garden, once China’s largest private developer with 3,000 projects nationwide, defaulted on international bonds in October 2023 after missing payments within a 30-day grace period. Investment in real estate development declined by 14.7% in the first ten months of 2025, with sales of new homes projecting an 8% decrease for the full year, marking the fifth consecutive year of negative growth.
The construction sector tells an equally grim story. The total area of residential projects started declined by 22.55% year-on-year to 536.6 million square meters, while completed residential units fell by 25.81% to 537 million square meters. Construction workers remain unpaid, suppliers face bankruptcy, and the entire supply chain—from cement manufacturers to elevator installers—struggles to survive.
Why This Isn’t Just Another Downturn: The Structural Trap
Understanding why recovery will take until 2030 requires examining the unique architecture of China’s economy. Unlike typical real estate downturns, this crisis strikes at the foundational model that has powered Chinese growth since the 1990s.
The Property-Dependency Problem
Real estate and related industries accounted for approximately 25% of China’s GDP in 2024, despite the ongoing decline. This isn’t simply about construction—it’s about land sales, furniture manufacturing, home appliances, property management, legal services, and financial products all built around housing.
Housing prices have fallen 20% or more since they peaked in 2021, and with 70% of household wealth tied to property, falling home prices directly erode family balance sheets. This creates a vicious cycle: declining wealth leads to reduced consumption, which slows economic growth, which further pressures property values.
The Local Government Fiscal Catastrophe
Here’s where the crisis becomes truly intractable. Revenue from land sales by China’s local governments dropped 16% in 2024 compared with the previous year, after a 13.2% decline in 2023. But land sales aren’t just one revenue stream among many—they’ve been the primary funding mechanism for local governments since the 1990s.
Local Government Financing Vehicles (LGFVs), the shadow banking entities that local officials created to circumvent borrowing restrictions, are now drowning. Total debt raised directly by local governments and via their financing vehicles now stands at around 134 trillion yuan, equal to roughly $19 trillion.
These LGFVs were designed with a simple assumption: land values would continue rising, providing both collateral for new loans and revenue from sales to service existing debt. That assumption has catastrophically failed. The call for LGFVs to buy land to create revenue for local governments made matters worse, turning land from a key source of revenue into a source of new debt.
The Inventory Overhang
The inventory turnover ratio in China shortened by five months from its peak of 25.9 months in April 2025, but at the current pace, it may take another year and a half for the clearance cycle to reach 12-18 months—a relatively healthy range. That’s optimistic. In many tier-three and tier-four cities, years’ worth of unsold inventory sits vacant, with no clear demand in sight.
The math is unforgiving. Even if sales stabilize tomorrow, clearing existing inventory while developers and local governments simultaneously restructure trillions in debt requires time measured in years, not quarters.
Censorship vs. Economic Reality: When Propaganda Meets Balance Sheets
Beijing has deployed its formidable censorship apparatus with surgical precision. In less than three weeks, social media platforms Xiaohongshu and Bilibili removed more than 40,000 posts under a “special campaign” to regulate online real estate content. The Shanghai branch of the Cyberspace Administration led efforts to scrub negative sentiment about housing markets from social media.
The censorship strategy extends beyond simple post deletion. After authorities urged platforms to clean up material containing problems such as “provoking extreme opposition, fabricating false information, promoting vulgarity, and advocating bad culture,” the Cyberspace Administration of China announced in early 2025 that platforms had removed more than a million pieces of content.
This represents a coordinated campaign to control the narrative around the property crisis. Posts discussing falling home values, developer defaults, or economic pessimism are systematically removed. Even discussions of the Zhuhai vehicular attack in November 2024 were censored, part of a broader effort to suppress anything that might undermine social stability.
But here’s the fundamental problem with censoring an economic crisis: you can delete social media posts, but you can’t delete non-performing loans. You can remove hashtags about Evergrande’s default, but you can’t remove the actual debt from bank balance sheets. You can silence influencers discussing property values, but you can’t force buyers into a market where confidence has evaporated.
The contrast between official statements and ground-level reality grows starker by the month. State media emphasizes “stability” and “gradual recovery,” while sales of the top 100 developers plunged 36% in terms of value in November 2025 from a year earlier. Beijing announces stimulus packages, yet investment in fixed assets, which includes property, contracted 2.6% over the January through November period compared with a year earlier.
The 2030 Timeline: Breaking Down the Recovery Math
Why 2030? The projection isn’t arbitrary—it’s based on the time required to work through structural imbalances that took decades to build.
Inventory Clearance: 3-4 Years Minimum
Even optimistic scenarios require 2027-2028 to clear excess housing inventory in major cities, and potentially 2029-2030 for tier-three and tier-four cities. This assumes sales don’t deteriorate further—an assumption that grows shakier as demographic headwinds intensify.
Developer Balance Sheet Repair: 4-6 Years
Dozens of Chinese developers have been approved for debt restructuring plans since the start of 2025, clearing more than 1.2 trillion yuan ($167 billion) in liabilities. But this represents a fraction of total developer debt. The restructuring process—negotiating with creditors, selling assets, and gradually rebuilding financial viability—typically requires multiple years even in the best circumstances.
Local Government Fiscal Restructuring: 5-7 Years
This is the longest and most complex component. Beijing authorized 10 trillion yuan in local debt issuance—to be disbursed over five years—to address hidden obligations in 2024. But this merely refinances existing debt at lower interest rates; it doesn’t create new revenue sources.
The fundamental problem remains: local governments structured their finances around continuously rising land values. Rebuilding fiscal sustainability requires either dramatically cutting expenditures (politically painful and economically damaging) or finding alternative revenue sources (difficult and slow to implement).
Demographic Drag: Permanent Headwind
China’s working-age population is shrinking, and urbanization—the force that drove housing demand for three decades—has plateaued. These aren’t cyclical issues that resolve with stimulus; they’re structural realities that reduce baseline housing demand permanently.
Historical Parallels: Lessons from Japan’s Lost Decades
The comparison to Japan’s 1990s property bubble isn’t perfect, but it’s instructive. By 2004, prime “A” properties in Tokyo’s financial districts had slumped to less than 1 percent of their peak, and Tokyo’s residential homes were less than a tenth of their peak. It took until 2007—16 years after the bubble burst—for property prices to begin rising again.
From 1991 to 2003, the Japanese economy grew only 1.14% annually, while the average real growth rate between 2000 and 2010 was about 1%. What was initially called the “Lost Decade” became the “Lost Two Decades,” and many economists now reference “Lost Three Decades.”
Japan’s experience demonstrates several sobering realities:
Balance sheet recessions take years to resolve. Even with aggressive monetary easing (Japan pioneered zero-interest-rate policy in the late 1990s) and massive fiscal stimulus, deleveraging proceeds slowly. Households and corporations prioritize debt repayment over spending and investment.
Zombie companies drain economic vitality. Banks kept injecting funds into unprofitable firms that were too big to fail, preventing capital reallocation to productive uses. China faces a similar risk with its state-owned enterprises and developers.
Property-driven wealth effects create powerful negative feedback loops. As Japanese real estate values declined, household wealth evaporated, consumption stagnated, and deflation became entrenched. China’s even greater concentration of household wealth in property suggests potentially worse wealth effects.
The key difference: China’s crisis is arguably more structurally complex. Japan’s property bubble was primarily driven by speculative excess and loose monetary policy. China’s bubble involved speculation plus local government fiscal dependency plus shadow banking plus a fundamental economic model built around property development. Unwinding this requires more than monetary and fiscal tools—it requires redesigning the growth model itself.
Global Ripple Effects: No Crisis Is an Island
China’s property troubles send shockwaves far beyond its borders. Australia and Brazil, major commodity exporters, already face reduced demand for iron ore, copper, and other construction materials. European luxury brands that catered to China’s affluent property developers and homebuyers report softening sales.
The exposure runs deeper than trade flows. Foreign investors hold portions of Chinese developer bonds, though many have already taken massive losses. More concerning are the indirect linkages: Chinese state-owned companies with overseas investments potentially scaling back as domestic pressures mount, Chinese tourists and students spending less abroad as household wealth declines, and geopolitical implications of a economically stressed superpower.
Financial contagion risks remain contained for now—China’s capital controls and state banking sector provide insulation. But the growth drag is unavoidable. China’s housing market correction continues as an ongoing headwind, with KKR’s chief economist for Greater China estimating a 1.5 percentage point dent on China’s gross domestic product in 2025, compared with 2.5 percentage points in 2022.
What Tier-1 Companies Should Do Now
For multinational corporations and investors, the 2030 timeline requires strategic adjustments:
Diversify China exposure. Companies heavily dependent on Chinese property-related demand should accelerate diversification into other Asian markets or sectors. The “China-only” growth strategy needs fundamental reevaluation.
Watch local government creditworthiness. Companies with receivables from Chinese local governments or infrastructure projects face rising payment risks. Credit insurance and careful monitoring of local fiscal conditions are essential.
Reconsider real estate collateral. Lenders and investors using Chinese property as collateral should reassess valuations aggressively. The assumption that property values provide a floor has proven catastrophically wrong.
Monitor consumer wealth effects. Consumer-facing businesses should prepare for years of constrained spending as household wealth remains depressed. The Chinese consumer, long expected to drive global growth, faces significant headwinds.
Prepare for policy volatility. Beijing will likely cycle through various stimulus measures, creating temporary market movements. Distinguishing genuine structural improvements from short-term liquidity injections is critical.
The Painful Path Forward
Beijing recognizes that the core issue lies in reducing local governments’ dependence on LGFVs, with Premier Li Qiang underscoring the need to “remove government financing functions from local financing platforms and press ahead with market-oriented transformation”. This is the right diagnosis, but the treatment will be painful and prolonged.
“China’s property crisis represents more than a cyclical downturn—it’s the unwinding of a growth model that took 30 years to build. Recovery to sustainable equilibrium requires 5-7 years minimum, with 2030 representing the earliest realistic bottom under optimistic scenarios. Censorship can control information but cannot alter the underlying economics.“
China needs to rebuild its entire fiscal architecture. This means new tax structures, revised central-local government responsibilities, transparent budget constraints, and allowing insolvent entities to actually fail rather than propping them up indefinitely. Each of these reforms faces powerful resistance from vested interests.
The alternative—continuing to refinance bad debts, prop up zombie developers, and hope for a return to property-driven growth—merely extends the crisis. It’s Japan’s playbook from the 1990s, and the results speak for themselves.
Conclusion: When Censorship Meets Economic Gravity
Beijing’s censors can scrub social media clean of negative sentiment. They can delete posts, suspend accounts, and create the digital appearance of stability. What they cannot do is delete the structural imbalances in China’s economy, rewrite the math of debt-to-GDP ratios, or manufacture demand in a demographically declining society with excess housing supply.
The 2030 timeline isn’t pessimism—it’s arithmetic. Clearing inventory, restructuring debt, rebuilding local government finances, and allowing new economic models to emerge requires time measured in years, not quarters. Japan’s experience, with similar structural challenges but arguably simpler economics, took more than a decade even with aggressive policy responses.
For global businesses, investors, and policymakers, the implications are profound. The Chinese growth engine that powered the global economy for three decades is fundamentally transforming. The property-driven model is over, and what replaces it remains uncertain.
The censors can control the narrative on Weibo. They cannot control economic reality. And economic reality suggests that 2030 marks not the beginning of recovery, but merely the year when China might finally hit bottom—if, and only if, Beijing pursues genuine structural reforms rather than continued extend-and-pretend tactics.
For hundreds of millions of Chinese families like Zhang Wei’s, still paying mortgages on unfinished apartments, that timeline offers cold comfort. But it offers something perhaps more valuable: honesty about the scale of the challenge ahead. No amount of censorship can change what the numbers tell us—this is a crisis that will define China’s next decade.
Data Sources :
This analysis draws from National Bureau of Statistics of China, International Monetary Fund reports, Bloomberg Intelligence, Goldman Sachs research, and major property developer financial statements through December 2025. Statistical projections are based on historical recovery timelines from comparable property crises, adjusted for China-specific structural factors.
Discover more from The Economy
Subscribe to get the latest posts sent to your email.


China’s exports surged 19.6% in May 2026, with semiconductor shipments up 110% year over year. But behind the headline growth lies a collapsing property market, falling consumer spending, and a looming Japan-style deflationary trap. Here is the full analysis.
The Paradox at the Heart of China’s Economy
China in 2026 presents one of the most striking paradoxes in modern economic history. On the surface, the data looks impressive: exports were up 19.6% from a year earlier in May 2026 — the second biggest increase since January 2022. Exports of semiconductors soared 110% year over year, while mobile phones rose 44% and automatic data-processing machines jumped 66%. The manufacturing engine is roaring.
Beneath the surface, a different China is visible — one where property values are collapsing, households are saving rather than spending, youth unemployment remains elevated at 16.9%, and consumer price inflation has been near zero for years. China’s GDP stands at $20.8 trillion in 2026, but deflation has persisted for a tenth consecutive quarter and property investment has collapsed 50–80% from peak.
The paradox resolves when you understand the structure: China is growing because of exports and government investment, not because its people are getting richer and spending more. That is an inherently fragile foundation.
The Export Surge: AI Demand Driving China’s Manufacturing Machine
The headline numbers on China’s export performance are extraordinary. Semiconductor exports rising 110% year over year reflect two intersecting forces: booming global AI infrastructure demand sucking in chips and electronics components, and Chinese manufacturers stockpiling inventories ahead of anticipated further disruptions to global supply chains from the Iran conflict.
China holds a dominant position in many semiconductor supply chain stages below the most advanced chips — packaging, substrates, legacy node chips — and these have been in extreme demand from AI data center builders worldwide. The AI economy is, perhaps inadvertently, providing a significant lifeline to China’s export sector at precisely the moment when domestic demand remains depressed.
The Property Collapse: A Crisis Now in Its Fifth Year
While the export engine hums, China’s property sector — for decades the central pillar of household wealth and economic growth — continues its multi-year implosion. Property investment fell 16.2% year over year in the first five months of 2026 — the steepest decline in fixed-asset investment since May 2020.
Secondary home prices have declined for 44 consecutive months, and rents have fallen for 23 months. For a country where residential property constitutes approximately 70% of urban household assets, this sustained decline has had a devastating effect on consumer psychology. Falling housing prices have made people feel poorer. As a result, people choose to spend less and save more. In the past five years, household deposits in Chinese banks have almost doubled.
The property downturn is estimated to have reduced annual real GDP growth by about 2 percentage points per annum in 2024 and 2025, according to Goldman Sachs. Though this drag is expected to narrow, it has fundamentally altered the trajectory of the world’s second-largest economy.
The Japan Comparison: Is China Walking Into a Deflationary Trap?
The comparison that haunts Chinese policymakers — and that has been referenced repeatedly by leading economists including Harvard’s Kenneth Rogoff — is Japan’s “Lost Decade” that followed the burst of its property and equity bubble in 1990.
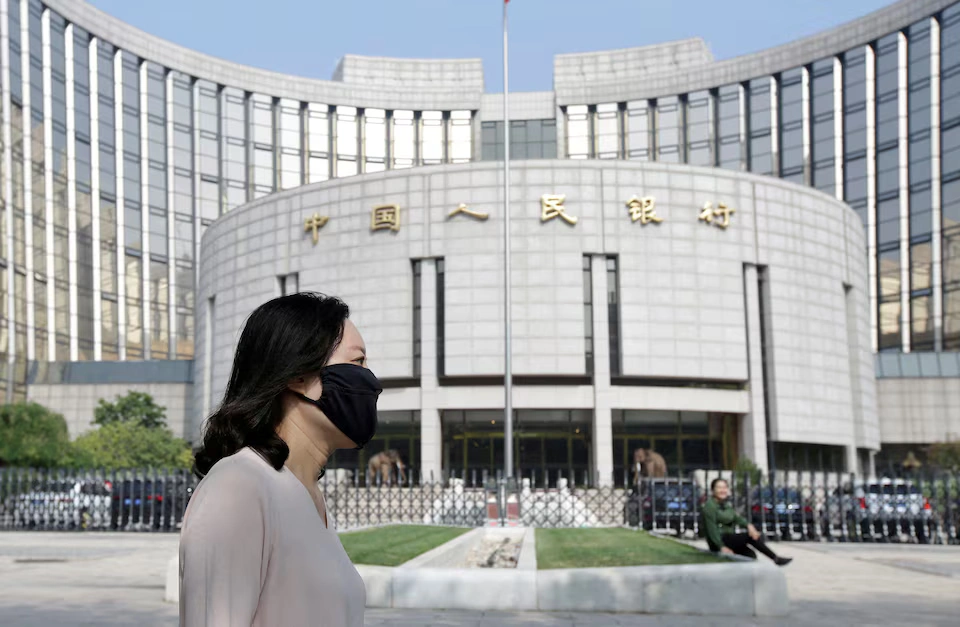
China’s policymakers are acutely aware of this risk. The PBOC has announced a series of financial sector measures including steps to increase the use of overnight reverse repo operations and support the offshore use of the renminbi. But these measures did not appear to represent a major broad-based monetary stimulus package — suggesting Beijing is still reluctant to unleash the scale of fiscal intervention that might break the deflationary psychology.
The Global Implications
China’s export surge, paradoxically, creates pressure for its trading partners. A country growing primarily through exports necessarily runs trade surpluses — which creates political friction with trade partners, particularly the United States and the European Union, who already face domestic pressure on trade deficits with China.
Meanwhile, China’s weak domestic demand is deflationary for the global goods sector — exporting low prices to the world at a time when services inflation remains stubbornly elevated in most developed economies. This creates a complex environment for central banks: cheap goods from China pushing inflation down, expensive services keeping it up.
For investors, China in 2026 presents an asymmetric opportunity clouded by structural uncertainty. The export machine is delivering, but the domestic recovery remains elusive.
FREQUENTLY ASKED QUESTIONS (FAQs)
Q: Why are China’s semiconductor exports up 110%? AI infrastructure buildout worldwide is driving massive demand for chips and electronic components. China holds significant market share in many semiconductor supply chain stages, and AI data center builders are a major buyer of these products. Additionally, anticipation of further supply chain disruptions is driving inventory stockpiling.
Q: Is China’s economy in a recession? No — GDP growth remains positive, projected around 4–5% in 2026. However, deflation has persisted for over two years, property investment is collapsing, and consumer spending growth is far below historical norms. Economists describe it as “growth without demand.”
Q: How severe is China’s property crisis? Property investment in the first five months of 2026 fell 16.2% year over year, the steepest decline since May 2020. Secondary home prices have fallen for 44 consecutive months. The property sector, which at its peak accounted for nearly 30% of China’s GDP including related industries, has shrunk dramatically.
Discover more from The Economy
Subscribe to get the latest posts sent to your email.
In a supermarket in Fuyang this past February, shoppers pushed carts past red lanterns and “Golden Horse Welcoming Spring” banners during China’s longest Lunar New Year holiday on record. Rail networks carried more than 18.7 million passengers in a single day, and Hainan’s duty-free counters rang up 30.8% more sales than a year earlier. For a few weeks, it looked like Beijing’s demand stimulus push might finally be taking hold. The relief didn’t last. By May, retail sales had fallen 0.6% year-on-year — the first monthly decline in more than three years. Xi Jinping has spent eighteen months promising to make households, not factories, the engine of Chinese growth. The data keep saying otherwise.
That gap between rhetoric and reality sits at the centre of China’s economic story heading into the first year of the 15th Five-Year Plan. For two decades, growth has leaned on investment and exports — a model the IMF’s chief economist, Pierre-Olivier Gourinchas, has said needs to “pivot to a more domestically-driven engine of growth.” The IMF now projects China’s GDP growth will slow to 4.5% in 2026, down from 5% in 2025, with private domestic demand described as lackluster even as headline inflation averaged zero percent last year. The World Bank reaches a similar conclusion: households kept funnelling savings into bank deposits through 2025 despite real interest rates that were flat or negative, while local government revenue stayed squeezed by a continued slide in land-lease income. Beijing has answered with trade-in subsidies, interest-rate cuts and a 48-measure consumption action plan. None of it has shifted the basic arithmetic: China still saves more, and spends less, than almost any economy its size.
China’s Demand Stimulus Keeps Hitting the Same Wall
The headline number from May was stark. China’s National Bureau of Statistics reported retail sales fell 0.6% year-on-year, the first such drop since December 2022, reversing April’s 0.2% gain and missing even the most pessimistic forecasts in a Reuters poll. Home appliance and audiovisual equipment sales plunged 15.6%; auto sales tumbled 16.1%, extending an eighth consecutive month of decline in the world’s largest car market. Only services kept the picture from looking worse: spending on catering, travel and entertainment grew 5.4%, outpacing goods retail by 4.2 percentage points, according to Caixin Global.
Beijing’s response was immediate but modest. The government injected a fresh 62.5 billion yuan ($9.2 billion) into the consumer trade-in scheme by the end of June, even as it quietly scaled the 2026 program back to 250 billion yuan from 300 billion yuan in 2025, narrowing eligibility to cars, appliances and smart glasses. Nine government departments also rolled out a joint action plan built around 48 separate measures, spanning:
- Subsidised dining and catering vouchers in lower-tier cities
- Expanded reimbursement for elder-care and healthcare services
- Relaxed visa rules to draw foreign tourist spending
- Additional tax-refund points at border crossings for inbound shoppers
It’s a familiar pattern. The Ministry of Commerce says the broader trade-in program has driven 4.16 trillion yuan in cumulative sales since launch — real money, by any measure. Yet the same dataset shows why the lift keeps fading: full-year 2025 retail sales growth came in at 3.7%, trailing industrial output’s 5.9% expansion and the economy’s overall 5% growth rate, Reuters reported. Growth bottomed at 0.9% year-on-year in December, recovered to 2.8% in early 2026, then slipped to 1.7% by March as the subsidy cycle turned, in the words of analysts at ING, “from a tailwind to a headwind.” Auto sales fell 9.1% in the first quarter even as China’s passenger-car exports jumped 60.6% — a sign that excess domestic production is increasingly finding buyers abroad rather than at home.
Monetary policy moved alongside the fiscal support. The People’s Bank of China entered 2026 promising a “moderately loose” stance and in January cut interest rates on several structural lending tools by 0.25 percentage points, lowering the one-year central bank lending facility rate from 1.5% to 1.25%. Governor Pan Gongsheng has signalled more is coming, telling Xinhua there is “still room for further RRR and interest rate cuts this year.” New refinancing tools are now earmarked specifically for services consumption and elder care — a quiet admission that goods subsidies alone weren’t going to do the job. Consumer prices briefly perked up too: CPI rose 1.3% year-on-year in February, the fastest pace in three years, before easing to 1.0% in March as core inflation slipped from 1.8% back to 1.1%. Producer prices, meanwhile, are still falling, extending a fourth straight year of factory-gate deflation.
There’s also a self-inflicted wound. Beijing’s “anti-involution” campaign, aimed at curbing cut-throat price wars among manufacturers of everything from solar panels to electric vehicles, is meant to fix a supply-side problem. But the IMF’s Article IV report warns that continued industrial-policy support for priority sectors risks perpetuating the very overcapacity it’s trying to cure, adding to deflationary pressure rather than easing it. Subsidise demand with one hand and subsidise supply with the other, and the price level barely moves.
Why China’s Household Savings Rate Won’t Budge
Subsidies treat a symptom. The disease is precautionary saving, and it’s structural rather than cyclical. A December 2025 IMF working paper by economists Yizhi Xu, Fan Zhang, Rongyu Cui and Ding Hua traces China’s stubbornly high household savings rate to three forces that reinforce one another: thin social spending in rural areas, the hukou household-registration system that denies many migrant workers full access to urban healthcare, schooling and pensions, and a property-market correction that has eroded the wealth of homeowners, who make up more than 90% of Chinese households.
Why Is China’s Domestic Demand Still Weak?
China’s domestic demand stays weak because three forces compound: a property slump that erased household wealth, thin social safety nets that force precautionary saving, and a hukou system denying migrant workers full urban benefits. Subsidies lift spending briefly, but they don’t fix why households save first.
The mechanics matter. The IMF researchers find that falling housing wealth pushes homeowners to save more, not less, as they try to rebuild lost equity — an effect that has held steady since the property correction began in 2021. More than 50 Chinese developers have defaulted since then; Country Garden, once the country’s largest, saw contracted sales fall by 70% to 6.91 billion yuan in a single December after an October debt default. What’s shifted is the other side of the ledger: would-be buyers, once forced to save aggressively for a down payment, are increasingly just postponing the purchase altogether amid uncertainty over future prices — which means the old “save to buy” motive is weakening even as the “save because I lost equity” motive intensifies.
Hukou reform has made real, if uneven, progress. Beijing has eased registration restrictions in dozens of cities since 2024, and the National Development and Reform Commission has continued chipping away at residency limits in smaller cities. But the IMF’s modelling suggests reform alone won’t be enough. Pair stronger social safety nets with hukou liberalisation and a smoother property-market transition, the paper argues, and Beijing could meaningfully cut precautionary saving. Pursue trade-in subsidies in isolation, and the savings rate barely moves — which is more or less what’s happened since 2024.
The Second-Order Costs of a Spending Gap That Won’t Close
The consequences extend well past China’s borders. With factory-gate prices still falling, manufacturers facing weak domestic orders are doing what they’ve always done: exporting the surplus. That’s part of why passenger-car exports surged even as domestic auto sales fell, and a similar pattern is playing out across solar panels, batteries and steel. Trading partners in Europe and Southeast Asia have noticed, and China’s trillion-dollar annual trade surplus keeps surfacing as a flashpoint in talks with Washington and Brussels alike.
Inside China, the strain shows up in local-government finances and in investment data that are now flashing red alongside consumption. Fixed-asset investment fell 4.1% in the first five months of 2026, and property investment extended its slide, dropping 16.2% over the same period — a sharper fall than January-April’s 13.7% decline, Reuters reported. NBS spokesperson Fu Linghui attributed part of the slowdown to extreme summer heat and heavy rain in some regions, along with the broader transition from old growth drivers to new ones. Land-lease revenue, once a primary funding source for cities, kept contracting through 2025, and the World Bank found consolidated fiscal revenue growth barely turned positive — just 0.2% year-on-year through October. That squeezes precisely the public services, healthcare, pensions, childcare subsidies, that economists say would do the most to unlock household spending in the first place.
Underneath the headline weakness, consumer behaviour is shifting in ways the subsidy programs weren’t built to capture. Chinese travellers are spending less overseas and more at home — a swing Bloomberg Intelligence estimates could redirect roughly $27 billion in outbound tourism spending back into the domestic market, while relaxed visa rules and a softer yuan are expected to draw in an additional $15 billion from inbound visitors. That’s a genuine bright spot, but it’s also a reminder of what’s actually growing: travel and experiences, not the durable-goods spending the trade-in subsidies were built to support.
Then there’s demography, which makes the 2026–2030 window unusually urgent. China’s population could shrink by close to 60 million people between 2026 and 2035, according to projections from the China-focused research firm Rhodium Group, as annual deaths climb toward 15 million a year while births keep falling — the ratio of new births to total population dropped to just 0.563% in 2025, down from 1.199% a decade earlier. Beijing’s 15th Five-Year Plan includes, for the first time, an entire chapter devoted to population policy. The retirement-age increase passed in 2024, to 63 for men and 58 for white-collar women, is expected to add roughly 0.2 percentage points to annual growth through 2030, the IMF estimates, but it does nothing to fix the underlying birth-rate collapse. For small and mid-sized exporters squeezed between soft domestic orders and rising trade friction, the math keeps getting harder, not easier.
Not Everyone Thinks the Strategy Is Failing
Not every economist reads the data this way. Standard Chartered’s Liao Wei points to China’s rising total factor productivity, climbing since 2021, as evidence the export engine can keep absorbing domestic slack without derailing growth, particularly as global appetite for AI-related hardware lifts demand for technology-intensive Chinese exports, she told China Daily. Tao Chuan, chief economist at Guolian Minsheng Securities, goes further, forecasting 2026 growth “no lower than 5%” and describing a shift toward what he calls an export-consumption equilibrium, in which subsidy-driven spending gradually gives way to sustainable services growth.
Beijing’s own assessment, delivered through the Central Economic Work Conference and echoed in Caixin’s opinion pages, holds that the economy’s fundamental trend remains positive and that 2025’s growth, officially 5%, in line with target, proves the model is working, just more slowly than critics would like.
That said, the gap between official confidence and independent estimates is wide enough to give pause. Rhodium Group’s analysts calculate that China’s real 2025 GDP growth likely landed between 2.5% and 3%, roughly half the 5.2% pace the National Bureau of Statistics reported through the first three quarters, with the biggest divergence concentrated in investment figures rather than consumption. If that estimate is closer to the mark, the resilience Beijing points to owes more to production and exports than to any genuine pickup in household spending. The picture is more complicated than either side’s headline number suggests.
A Pivot Beijing Can Postpone But Not Avoid
Strip away the subsidy cycles and the trade data, and the tension is simple: Xi Jinping wants Chinese households to spend like an advanced economy’s consumers while the state still taxes, spends and insures like a developing one. Trade-in vouchers can pull a few months of auto and appliance sales forward. They can’t replace a pension system, fix a broken property market, or convince a young professional in Chengdu that her job is secure enough to stop saving for the worst. The IMF’s own modelling suggests a serious reform package, stronger safety nets, faster hukou liberalisation, a real housing-market transition, could lift consumption’s share of GDP by roughly four percentage points over five years. That’s the size of the prize. It’s also the size of the political and fiscal commitment Beijing has so far avoided making. Until that changes, the trade-in subsidies will keep buying time rather than buying confidence, and the gap between Xi’s ambition and his households’ bank balances will keep showing up in the data, one weak month at a time.
Discover more from The Economy
Subscribe to get the latest posts sent to your email.

Zhou Wei, a 42-year-old software entrepreneur from Shenzhen, stood at the head of a queue snaking outside a retail bank branch in Hong Kong’s Central district. He wasn’t there to buy retail equities or shop for luxury goods. Instead, he carried a briefcase containing meticulous proof of a residential address in Guangdong, three years of tax receipts, and a business registration document. Zhou is part of a quiet, massive migration of private capital. As domestic economic anxieties deepen north of the border, thousands of affluent citizens are attempting to move their wealth into safer waters before the gate shuts permanently.
This capital movement occurs against a backdrop of historic structural shifts within the broader Chinese macroeconomy. Over the last two years, the domestic property market has failed to stabilize, wiping out nearly $5 trillion in household wealth across tier-one and tier-two cities. At the same time, the yuan has faced continuous downward pressure against the US dollar, making domestic, yuan-denominated assets increasingly unattractive to wealth-preservationists. According to a recent Bloomberg macro economic report, capital outflows from China reached a five-year high in the early months of 2026, driven by a profound lack of domestic investment alternatives. For decades, the property market served as the primary engine for middle-class wealth accumulation, but that engine has sputtered out. Consequently, private capital is aggressively seeking offshore alternatives. The nearest, most legally coherent refuge is Hong Kong, which operates under a separate legal system and maintains an unpegged, freely convertible currency linked directly to the greenback.
Demand for Hong Kong Bank Accounts for Mainland Residents
The sudden spike in demand for Hong Kong bank accounts for mainland residents marks a critical turning point in cross-border capital dynamics. Opening these accounts has transformed from a luxury convenience for high-net-worth individuals into a defensive necessity for the upper-middle class. Retail banks across Hong Kong, including major institutions like HSBC and Bank of China Hong Kong, have reported unprecedented volumes of account applications from mainland walk-in clients. To manage the influx, several branches have extended their operating hours to seven days a week, a phenomenon not seen since the pre-pandemic era. Data compiled by the Hong Kong Monetary Authority indicates that non-resident deposit growth grew by 14% in the first quarter of 2026 alone, a surge directly correlated with tightening domestic regulatory environments.
What drives this current rush is a pervasive fear that regulatory windows are closing fast. Mainland citizens face a strict statutory limit of $50,000 in foreign exchange per year. Yet, investors have long used various gray-market mechanisms—ranging from cross-border insurance policies to over-the-counter money changers—to move larger sums. A recent investigation by Reuters financial intelligence revealed that regulatory compliance teams in Shenzhen and Shanghai have begun auditing personal bank transfers that show patterns of consistent, small-scale cross-border movement. This heightened scrutiny has created a profound sense of urgency among mainland savers. They realize that holding an active, fully compliant offshore bank account is the most critical prerequisite for long-term wealth preservation. Without it, even if they manage to convert their currency, they have no secure venue to store it outside the reach of domestic capital controls.
Furthermore, the process of securing these accounts has become dramatically more arduous. Bankers now demand rigorous documentation regarding the source of funds, requiring applicants to prove that their money does not stem from unregistered corporate earnings or hidden property transactions. On June 2, 2026, regulatory guidelines in Hong Kong were quietly tightened to mandate deeper background checks on mainland applicants. This change has triggered a secondary industry of cross-border agencies charging up to $2,000 just to secure guaranteed appointment slots at retail bank branches. For investors like Zhou, this cost is a negligible premium to pay for an economic exit ramp.
The Analytical Layer: How Beijing Financial Regulation Crackdown Drives Capital Flight
Moving beyond the immediate daily news cycle reveals a deeper structural reality. This current capital migration is not a random market fluctuation; it’s a direct reaction to an aggressive Beijing financial regulation crackdown aimed at restructuring domestic private wealth. The central government has systematically closed loopholes that previously allowed private citizens to shield their earnings from state surveillance. From tighter oversight on local wealth management products to aggressive audits of high-earning tech executives, the state is prioritizing fiscal control over private market expansion.
Why are Chinese investors opening bank accounts in Hong Kong?
Chinese investors are opening bank accounts in Hong Kong to protect their wealth from domestic regulatory crackdowns and currency depreciation. By transferring assets to Hong Kong, mainland residents gain access to global investment instruments, US-dollar-pegged stability, and a legal system separate from Beijing’s direct capital controls.
This specific regulatory pressure explains why traditional asset classes within China are losing their appeal. When the state limits private corporate profits and forces state-backed interventions into private enterprises, capital naturally seeks environments governed by predictable common law. The picture is more complicated than a simple search for higher yields. In fact, many mainland depositors are willing to accept lower interest rates on their offshore deposits compared to domestic bonds, provided those offshore assets are denominated in foreign currency and held outside the immediate jurisdiction of mainland courts.
The structural tension is obvious. Beijing needs domestic capital to stay within its borders to fund its transition toward high-tech manufacturing and state-directed infrastructure. When private wealth flees into Hong Kong, it undermines this macro policy goal. Still, the unique administrative status of Hong Kong creates an ironic structural contradiction. The city is technically part of China, yet its financial system serves as the primary conduit for capital trying to escape mainland jurisdiction. This duality turns Hong Kong into both an essential economic asset for the country and a persistent systemic risk for central planners who demand absolute financial oversight. Consequently, every account opened acts as a tiny, cumulative vote of no confidence in the domestic regulatory trajectory, forcing a delicate balancing act between local branch managers and central party officials.
Strategic Shifts in Offshore Wealth Diversification
The downstream consequences of this capital flight are reshaping the financial landscape across Asia. As billions of yuan flow southward, the demand for sophisticated offshore wealth diversification products has outpaced traditional banking services. Hong Kong’s insurance sector has become an unexpected beneficiary, with mainland visitors purchasing dollar-denominated savings policies at a clip not seen in a decade. These insurance structures serve as highly effective wealth stores because they can be easily pledged as collateral for low-interest bank loans, effectively unlocking liquidity in a global currency.
This shift is forcing global asset managers based in the territory to reallocate their resources. Instead of pitch-decking speculative global equities to ultra-high-net-worth individuals, firms are designing conservative, fixed-income vehicles tailored for middle-class mainland depositors who prioritize safety over aggressive growth. According to data published by the Financial Times research unit, investment inflows into Hong Kong-domiciled mutual funds surged by $18 billion during the first four months of 2026, with over 60% of that capital originating from mainland retail investors.
What follows, however, is a direct challenge to Hong Kong’s domestic economy. While the banking sector is flush with liquidity, this capital is highly transactional. It sits in liquid deposits or short-term instruments rather than finding its way into local equities or real estate, both of which remain deeply depressed. The city’s banks are earning substantial fee income from account openings and wealth management consultations, yet they face rising compliance costs as they attempt to vet thousands of new accounts daily.
The long-term risk is that Hong Kong becomes a gilded parking lot for anxious capital—highly liquid, heavily monitored, and intensely vulnerable to sudden policy reversals from the central government in Beijing. If policymakers north of the border decide that the drain on domestic liquidity has crossed a critical threshold, they could halt the Hong Kong wealth management connect pathways overnight, stranding billions in mid-transit. This leaves institutions operating in a state of permanent contingency, knowing their current profitability depends entirely on a regulatory blind spot that could vanish with a single decree from Beijing.
The Counterargument: A Managed Valve for Capital Control
While mainstream analysis positions this asset migration as a chaotic breach in China’s financial defenses, a more rigorous counterargument suggests that Beijing is intentionally permitting this controlled capital movement. From a state planning perspective, a complete closure of all capital exit ramps could trigger severe domestic panic, collapsing consumer confidence and driving the underground banking system completely out of sight. By allowing a regulated, predictable volume of wealth to transition through official channels like the wealth connect schemes, the central government creates a necessary release valve for economic anxiety.
Furthermore, this movement serves an important geopolitical purpose for China’s long-term strategy. Capital that flows into Hong Kong remains technically within the wider financial orbit of the Chinese state, reinforcing the city’s position as an international financial center. If that capital were to flee entirely to Singapore, London, or New York, Beijing would lose all residual leverage over those assets. Analysts at the Institute of International Finance note that keeping wealthy citizens bound to a dollar-denominated hub under ultimate Chinese sovereignty is far preferable to watching that capital vanish into Western jurisdictions.
By maintaining strict outward controls but leaving the Hong Kong door slightly ajar, Beijing balances its domestic need for liquidity with its strategic requirement to maintain confidence among its corporate elite. This reality suggests that the current rush is not an outright defeat for regulators, but a calculated compromise where both the state and the investor accept a highly managed level of risk. Ultimately, a controlled leak within family bounds is far safer for the party than a structural explosion that shatters investor trust entirely.
The Balancing Act of Cross-Border Wealth
The modern race for financial security across the Taiwan Strait exposes a classic economic dilemma. Private capital always chases security and autonomy, while centralized states consistently prioritize control and collective stability. For mainland citizens who have spent the last two decades building substantial private estates, the current regulatory climate makes holding all their assets under a single domestic jurisdiction an unacceptable concentration of risk.
Hong Kong remains their indispensable bridge to the global financial system, providing a rare legal framework that respects private property while remaining geographically and culturally connected to the mainland. Yet, this bridge exists entirely at the pleasure of the sovereign authority in Beijing. As lines continue to form outside the glass towers of Central, every new account opened represents both a personal triumph of wealth preservation and a quiet testament to the enduring friction between private market desires and state-directed economic realities. The ultimate fate of these billions depends not on market mechanics, but on how long the state decides that this financial safety valve remains useful to its own survival.
Discover more from The Economy
Subscribe to get the latest posts sent to your email.

Indonesia vs. MSCI, Greenspan’s Legacy vs. Warsh’s Revolution, Micron vs. the Memory Shortage: A Global Finance Scorecard for Mid-2026

The End of Visa and Mastercard’s Monopoly? Rise of Alternatives

AI’s Energy Hunger Is Rewriting Global Power Markets: Reshaping the World Economy

UK Political and Economic Turmoil: Rachel Reeves’ Fall, Britain’s Fiscal Crisis

China’s Export Miracle Masks a Property Disaster: Growing Without Its People

Indonesia’s $1.5 Trillion Economy on the Edge: chances of MSCI Downgrade

Oil Falls to $70 as US-Iran Peace Talks Advance: Global Energy Markets

Micron’s $41.5 Billion Quarter: How AI’s Insatiable Memory Hunger Is Reshaping the Semiconductor Industry

Alan Greenspan Dead at 100: The Rise, Reign, and his Complicated Legacy

Top 20 PSX Stocks for Investment in 2027: Your Complete Guide to Pakistan’s Best Investment Opportunities

AI Power Without Governance: Geopolitical Race for Artificial Intelligence Is Outrunning the World

Turkey’s Bid for Middle East Leadership: How Ankara Is Filling the Vacuum Left by Iran’s Weakening

US Household Debt Hits $18.8 Trillion as Student Loan Defaults Surge

UK in Political and Economic Flux: Reeves Faces Demotion, OBR Gets New Chair, EG Group Eyes US Listing

China Overhauls the World’s Biggest Surveillance Network with Advanced AI

KPMG Australia CEO Resigns After Whistleblower Claims Exposed Investigation Failures

PwC China Partner Payouts Cut Amid Evergrande Audit Fraud

Broadcom Market Value Loss: Revenue Forecast Disappoints

Pakistan Budget FY 2026-27: Relief, Prospects, and the Tightrope Walk

Investors Pile Into Bullish Dollar Bets as ‘US Exceptionalism’ Trade Returns

Here’s How Much It’ll Cost You to Be Part of SpaceX’s Record-Breaking $75 Billion IPO

Nasdaq Tumbles 4% as Chip and Memory Stocks Sink: A $1.2 Trillion Wipeout

Japanese Mid-Sized Firms Flock to Southeast Asia for Growth

Smash Capital Leads $200M Funding for Allen Control Systems

How to Fix Pakistan’s Debt Economy: A Structural Blueprint

New Investment Super-Cycle: AI, Green Energy & Re-Shoring

Democrats Draw a Red Line Around Military AI — And the Pentagon Is Already Pushing Back

Chip Stocks Race Toward Biggest Gains Since Dotcom Era on AI Demand
-

 Markets & Finance6 months ago
Top 15 Stocks for Investment in 2026 in PSX: Your Complete Guide to Pakistan’s Best Investment Opportunities
-

 Analysis4 months ago
Top 10 Stocks for Investment in PSX for Quick Returns in 2026
-

 Analysis5 months ago
Brazil’s Rare Earth Race: US, EU, and China Compete for Critical Minerals as Tensions Rise
-

 Analysis4 months ago
Johor’s Investment Boom: The Hidden Costs Behind Malaysia’s Most Ambitious Economic Surge
-

 Banks5 months ago
Best Investments in Pakistan 2026: Top 10 Low-Price Shares and Long-Term Picks for the PSX
-

 Investment6 months ago
Top 10 Mutual Fund Managers in Pakistan for Investment in 2026: A Comprehensive Guide for Optimal Returns
-

 Global Economy6 months ago
15 Most Lucrative Sectors for Investment in Pakistan: A 2025 Data-Driven Analysis
-

 Global Economy6 months ago
Pakistan’s Export Goldmine: 10 Game-Changing Markets Where Pakistani Businesses Are Winning Big in 2025