
Energy Economy
Wind Farm Economics in 2026: What Determines Whether a Project Pays?


Wind power is expanding globally, yet the economics of an individual wind farm remain highly sensitive to where it is built, how much energy it delivers and how cheaply that energy can reach customers. Rising installation totals cannot by themselves establish that every project will make money.
According to the International Energy Agency’s Global Energy Review 2026, annual wind capacity additions reached roughly 160 gigawatts after a rapid increase. The Global Wind Energy Council projects substantial additional installations through 2030. These are measures of industry momentum, not uniform project returns.
Revenue begins with the capacity factor
A turbine’s rated power describes its maximum output under suitable conditions. Its annual generation depends on actual wind speeds, air density, maintenance downtime and curtailment. The capacity factor expresses real generation as a share of what continuous nameplate output would have produced. Because turbine construction costs are largely incurred upfront, a modest difference in annual output can change the entire financial model.
Developers therefore spend years measuring wind resources and considering wake effects, where an upstream turbine reduces wind available to one behind it. Taller towers, larger rotors and better forecasting can improve performance, but they also affect permitting, transport and maintenance costs.
The price of power matters as much as the amount
A project with excellent wind conditions can still struggle if electricity prices are low when it produces, if the grid cannot accept its output, or if its power-purchase agreement has unfavorable terms. Merchant projects face price volatility directly; contracted projects exchange some upside for revenue visibility. Both need credible assumptions about future congestion, transmission access and local demand.
Investors should ask whether headline tariffs or contract prices include grid connection costs, balancing responsibilities and curtailment provisions. Comparisons between two wind farms are meaningful only if financing, generation, currency and contractual risk are measured on the same basis.
Why interest rates change the equation
Wind farms are capital-intensive. A large fraction of lifetime costs is committed before the first unit of electricity is sold. This makes the cost of capital crucial: higher borrowing rates and required equity returns raise the price at which the project must sell electricity to remain viable.
Inflation affects steel, concrete, installation ships, labor and electrical components. Offshore farms in particular can face expensive marine construction, specialized vessels and difficult repairs. Onshore projects generally avoid some marine costs but still contend with land rights, transmission queues and community concerns.
Grid availability is not optional
Building turbines without transmission capacity can produce a stranded asset. Interconnection studies, new substations and upgrades to neighboring networks may determine the commercial timeline. Generation also varies by season and hour, so grids need flexible demand, storage, interconnections or other resources to balance supply.
The IEA’s Electricity 2026 supply analysis expects strong growth in wind generation over the forecast horizon. That makes network planning and system flexibility an economic priority rather than a minor engineering footnote.
Communities have legitimate questions
Local approval frequently turns on land payments, noise, visual effects, wildlife considerations and tax revenues. A serious project proposal should be specific about setback rules, environmental surveys, decommissioning guarantees and who receives the financial benefits. Developers improve outcomes when they publish operational evidence and avoid presenting every concern as ignorance or obstruction.
The bottom line: wind farm profitability is a project-level conclusion, built from generation forecasts, contracts, financing and grid access. Global growth provides an opportunity, not a substitute for due diligence.
How a developer models a hypothetical project
Consider a proposed 100-megawatt wind farm. At a hypothetical 35% capacity factor, output would be roughly 306,600 megawatt-hours per year before other losses. At a hypothetical realized sale price of $60 per megawatt-hour, gross electricity revenue would be about $18.4 million annually. Neither figure is a real-world offer or estimate for a named site. From that revenue, developers must pay operations and maintenance, land rents, balancing costs, insurance, financing and eventual decommissioning. Curtailment, lower wind speeds or an unfavorable contract can quickly change the result. A project-level article should show the assumptions and stress-test them rather than publishing a single payback period as a universal fact.
Frequently asked questions
Are wind farms profitable in 2026?
Some are; others face unfavorable financing, connection or construction economics. Profitability cannot be inferred from national capacity additions.
Is offshore wind better than onshore wind?
Neither is universally superior. Offshore resources can be strong, but marine construction and maintenance typically introduce different costs and risks.
What should a community ask a developer?
Request clear estimates for local tax receipts, land arrangements, environmental monitoring, decommissioning funding and transmission works.
Discover more from The Economy
Subscribe to get the latest posts sent to your email.


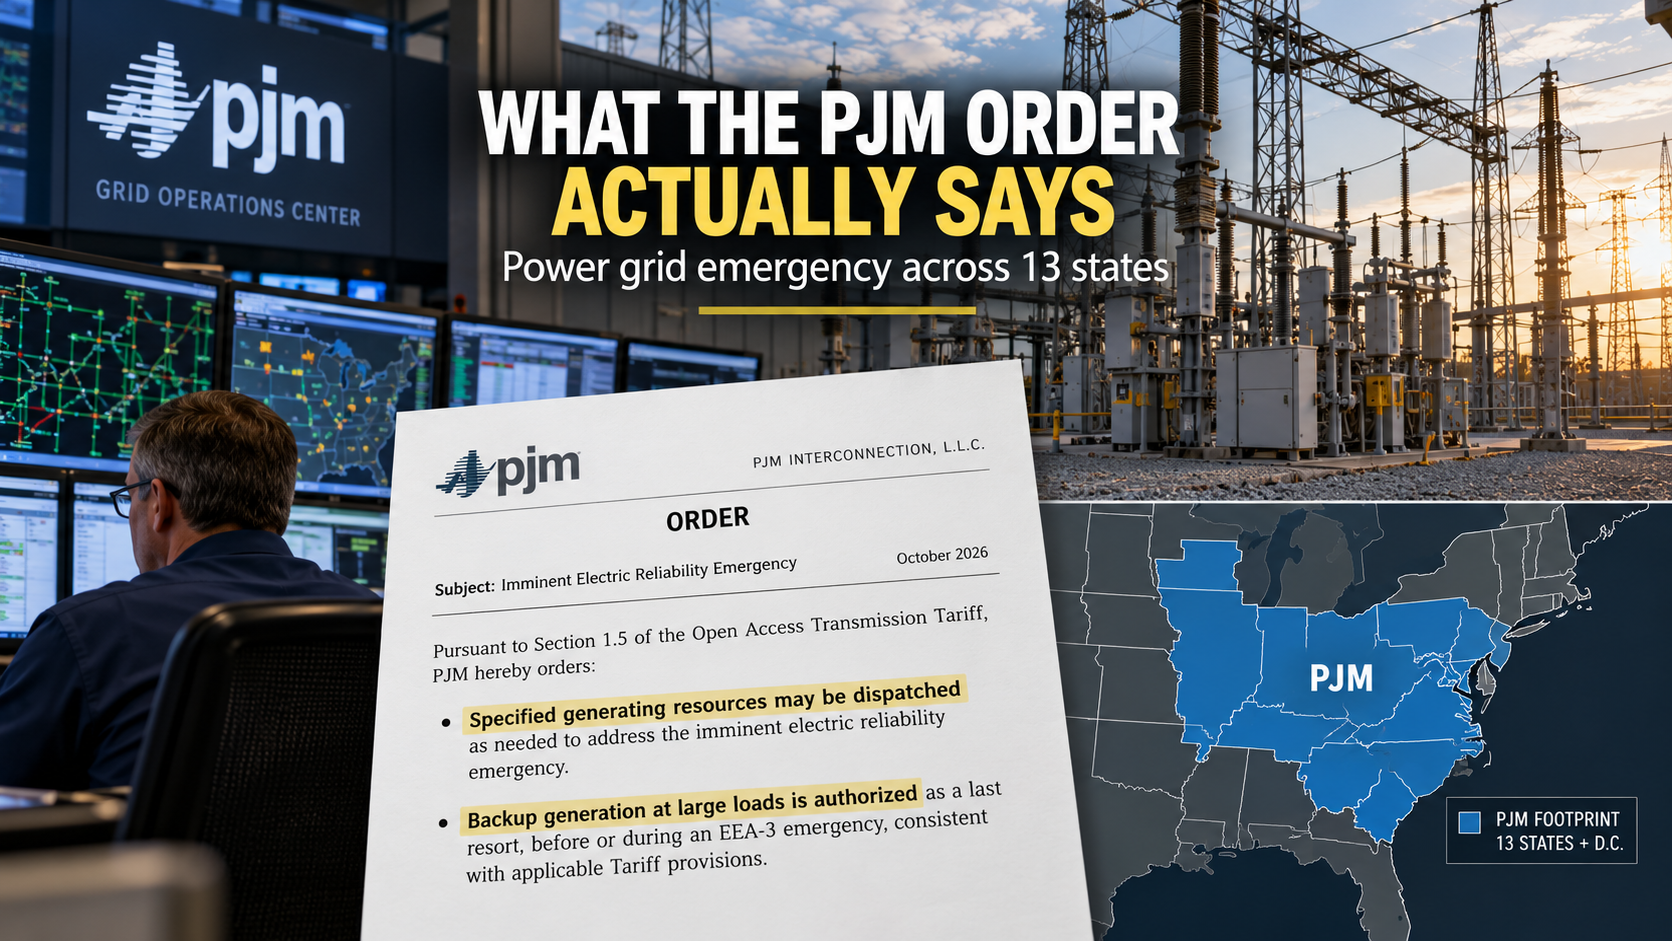
A federal emergency power order affecting the PJM electricity region has triggered searches about a “13-state power-grid emergency.” The Department of Energy’s 202(c) order, issued October 12 and effective October 13–16, gives PJM additional authority to dispatch specified generation resources to support reliability.
The essential answer
A federal emergency power order affecting the PJM electricity region has triggered searches about a “13-state power-grid emergency.” The Department of Energy’s 202(c) order, issued October 12 and effective October 13–16, gives PJM additional authority to dispatch specified generation resources to support reliability. Crucially, the presence of an emergency order does not establish that all homes across 13 states have lost power, nor does it imply every jurisdiction faces the same immediate conditions. Readers need to understand the grid operator, the legal authority, the dates and what reliable local outage information actually shows. For primary-source background, consult DOE 2026 emergency orders; PJM Interconnection; US Energy Information Administration. In a fast-moving topic, publication time and information cutoff matter: subsequent events may require updating the figures or legal status, not merely changing the date in the footer.
What the Department of Energy ordered
The DOE lists Order No. 202-26-50 as issued October 12, effective October 13 through October 16, pursuant to section 202(c) of the Federal Power Act. It authorizes PJM to direct specified generating units to operate as needed for reliability, and backup resources under defined emergency conditions. These are operational instructions within a regional system—not a declaration that each customer is experiencing a blackout. The precise order language, affected facilities and reporting requirements should be read in the DOE order listing. Avoid confusing the issue date with its effective date.
What PJM does and how regional power flows work
PJM is a regional transmission organization coordinating wholesale electricity and high-voltage transmission across a multistate footprint. Electricity crosses state borders within interconnected systems, so a regional reliability challenge is not neatly contained by state boundaries. PJM can respond using dispatch instructions, imports, reserves and demand-side measures. The actions differ from the local distribution utility’s job of restoring a downed neighborhood power line. A headline that counts states in the operator’s footprint is a geographic description, not a census of customers without electricity.
Reliability orders versus rolling blackouts
Power-system terminology is precise. A reliability alert or emergency order may be preventive, designed to preserve margin before a more serious shortage. A formal energy emergency alert is not equivalent to every utility carrying out customer disconnections. Rolling blackouts occur only under particular operational conditions and should be verified through utilities and grid-operator statements. A local outage can also be caused by storms, equipment damage or a vehicle striking a pole, unrelated to the PJM-wide instruction. Reporters should state what has actually happened and avoid sensationalizing a contingency measure.
The reasons emergency flexibility can matter
Unexpected generating-unit outages, unusually high demand, constrained fuel supply and transmission limits can put pressure on available reserves. Dispatching a resource that normally would not be run can make a difference during a narrow period. However, that flexibility may carry extra cost, emissions or operating constraints, making the legal basis and duration important. It is not a permanent answer to every electricity system challenge. Long-run reliability requires sufficient generation, transmission investment, maintenance, fuel planning and realistic forecasts of demand from data centers, industries and households.
What residents and businesses should actually do
Check your own utility’s outage dashboard for local conditions, and subscribe to official emergency alerts rather than forwarding unsourced statewide warnings. Households relying on powered medical equipment should follow prearranged contingency instructions from care providers and local emergency authorities. Businesses can review backup-power readiness, facility cooling requirements and safe shutdown procedures. Do not run portable generators indoors or near open windows because of carbon-monoxide risk. Most importantly, make decisions based on local alerts and utility notices—not the existence of a regional legal order alone.
Worked example: how to interpret a difficult headline
A Pennsylvania resident sees a headline referring to 13 states but finds no outage at home. A separate community may experience a distribution fault after a storm. Both situations can coexist with the PJM order, because the federal dispatch authorization, regional resource balance and local service status are three different things. The correct reporting should describe these layers rather than merging them into one dramatic claim. This is a deliberately illustrative comparison unless explicit documented numbers are identified. It should not be mistaken for a real person’s financial circumstances, an unverified event, or a guaranteed forecast. Its purpose is to show how a reader can apply the underlying principle and identify which information still needs to be checked.
Three concepts that are often confused
| Concept | What it actually establishes |
|---|---|
| DOE emergency order | Federal reliability authority with stated dates and conditions. |
| PJM alert or dispatch | Regional operational decision about resources. |
| Local outage report | Utility information about affected customers and restoration. |
These distinctions are more than technical niceties. They change the answer to the reader’s question. An estimate does not carry the same evidentiary weight as a final rule; an announcement does not have the same practical consequence as a completed transaction; and a provisional interpretation should not be presented as a confirmed event. Wherever a live source supplies a new fact, the editor should check whether the old text still describes the right stage of the process.
A reader’s verification workflow
Start by recording the precise claim and the date it was allegedly true. Open the primary announcement or filing rather than a social-media screenshot. Ask whether the source has an incentive to present only the most favorable interpretation, and corroborate material facts with reputable independent reporting where available. For numerical claims, note the denominator, timeframe and whether the number is a stock, a flow, a forecast or a realized result. For legal claims, note the court, agency, stage of proceedings and exact published document.
Next, separate information useful for immediate decisions from context that merely explains the headline. A person may need to act on a deadline even when the long-run political debate remains unresolved. Someone evaluating a security may need financing details, while a customer comparing technology products needs a tested specification and local warranty terms. The same headline can matter for different reasons; the article should therefore provide an actionable answer without implying that every reader faces the same circumstances.
Indicators and developments worth monitoring
- Expiration or extension of DOE Order 202-26-50.
- PJM-issued operational and emergency-alert statements.
- Utility outage maps and local emergency notices.
- Any official review of costs or environmental conditions.
Avoid treating these signals as a checklist that mechanically predicts the future. Some are leading indications and others are lagging measurements. A change becomes significant only after its magnitude, source and comparison period are understood. If two reputable sources disagree, explain the source of the difference—definitions, timing, jurisdiction, measurement or uncertainty—instead of selecting whichever number makes the strongest headline. That practice strengthens both reader trust and the article’s usefulness in search features that surface isolated paragraphs.
The specific information advantage of this article
The emotional headline suggests widespread darkness; the official document authorizes regional operating flexibility. Explaining the relationship between federal emergency power, PJM dispatch and the local utility outage map prevents a materially misleading inference about households across the region.
Frequently asked questions
Are 13 states completely without power?
The federal order does not establish that; check utility outage reports for actual affected customers. For individual decisions, consult the primary institution or product provider, and use the exact relevant date.
What is PJM?
A regional electricity transmission and wholesale-market operator serving a multistate region. For individual decisions, consult the primary institution or product provider, and use the exact relevant date.
When does the order run?
The DOE lists October 13–16, 2026, as the effective period. For individual decisions, consult the primary institution or product provider, and use the exact relevant date.
Where should I check my address?
Your electricity utility and local emergency management office provide the most relevant service and safety updates. For individual decisions, consult the primary institution or product provider, and use the exact relevant date.
Bottom line
A federal emergency power order affecting the PJM electricity region has triggered searches about a “13-state power-grid emergency.” The Department of Energy’s 202(c) order, issued October 12 and effective October 13–16, gives PJM additional authority to dispatch specified generation resources to support reliability. Crucially, the presence of an emergency order does not establish that all homes across 13 states have lost power, nor does it imply every jurisdiction faces the same immediate conditions. Readers need to understand the grid operator, the legal authority, the dates and what reliable local outage information actually shows. The best next step is to identify which of the monitored developments could change this answer and use a current, authenticated record before acting. Clear distinctions between confirmed facts, estimates, proposals and contested claims are more valuable than dramatic certainty.
Discover more from The Economy
Subscribe to get the latest posts sent to your email.
Markets & Finance
Southeast Asia’s LNG Dilemma: Navigating Price Volatility, Infrastructure Gaps, and Energy Security

Southeast Asia’s accelerating industrial growth and rapid depletion of domestic gas fields have transformed the region into a critical frontier for global Liquefied Natural Gas (LNG) demand. However, this transition exposes emerging Asian economies to severe spot-market price volatility, geopolitical supply chain disruptions, and critical regasification infrastructure deficits. Balancing near-term power stability with long-term decarbonization pledges requires a strategic recalibration of LNG procurement, terminal development, and regional pipeline connectivity.
The Macro Demand Shift: Depleting Reserves & Domestic Shortfalls
For decades, countries like Thailand, Malaysia, and Indonesia relied on domestic natural gas to power grid expansion and industrial development. Today, maturing legacy fields are experiencing steep natural decline rates. According to analysis from the International Energy Agency (IEA), Southeast Asia’s net energy trade deficit is projected to widen significantly as indigenous production drops below domestic demand thresholds.
To prevent acute power shortages, regional utilities are turning to imported LNG as a bridge fuel to phase out coal-fired generation. Yet, substituting domestic piped gas with imported LNG exposes power markets directly to international supply-demand shocks:
- Supply Chokepoint Vulnerabilities: Maritime trade routes remain highly sensitive to geopolitical tensions, particularly across critical transit corridors like the Strait of Hormuz and the Malacca Strait, as reported by Reuters.
- Fiscal Exposure: Price spikes directly impact state-subsidized utility markets, straining national budgets in price-sensitive developing economies such as Vietnam and the Philippines.
- Contractual Mismatches: Many regional buyers remain over-indexed on short-term spot markets rather than long-term Sale and Purchase Agreements (SPAs), leaving them vulnerable to market squeezes during peak winter heating cycles in North Asia and Europe.
Infrastructure Bottlenecks Across the ASEAN Energy Landscape
Importing LNG requires capital-intensive midstream infrastructure—including onshore regasification terminals, Floating Storage Regasification Units (FSRUs), break-bulk distribution facilities, and high-pressure transmission pipelines. Infrastructure deployment across the region remains fragmented:
1. Archipelagic Geography & Storage Limits
The island geography of the Philippines and Indonesia severely complicates central grid distribution. Small-scale LNG distribution requires specialized shallow-draft carriers and modular FSRUs, which carry higher capital expenditure per unit of energy delivered compared to centralized world-scale onshore terminals.
2. Grid Interconnection & Pipeline Gaps
While the proposed Trans-ASEAN Gas Pipeline (TAGP) aims to interlink regional gas grids, progress remains stymied by regulatory mismatches, cross-border tariff disputes, and physical infrastructure deficits. Without interconnectivity, surplus regasification capacity in one nation cannot cushion supply deficits in another.
3. Terminal Offtake Financing Hurdles
Financial institutions evaluating midstream gas projects require bankable, long-term power purchase agreements (PPAs). Uncertainty surrounding electricity tariff reform and currency fluctuation delays Final Investment Decisions (FIDs) for major regasification projects, according to market intelligence from S&P Global Energy.
Country-by-Country LNG Infrastructure & Import Trajectory
The operational realities, regasification capacities, and procurement strategies differ substantially across key Southeast Asian markets:
| Country | Key Demand Drivers | Active/Planned Regas Capacity | Primary Procurement Strategy | Major Infrastructure Challenge |
| Singapore | 95% gas-fired power generation; industrial bunkering hub | ~10 MTPA (SLNG expansion underway) | Long-term SPAs + Portfolio Hedging | Land constraints for large-scale onshore storage expansion |
| Thailand | Depleting Gulf of Thailand gas fields; power generation | ~19 MTPA (Map Ta Phut Phase 1 & 2) | Mixed long-term contracts & spot purchases | High exposure to spot JKM price spikes during summer cooling peaks |
| Vietnam | Transitioning from coal; industrial power demand | ~1–3 MTPA (Thi Vai terminal live; Son My planned) | High spot-market dependency | Absence of cost-reflective retail power tariffs for gas-to-power projects |
| Philippines | Depletion of Malampaya gas field | ~5 MTPA (Batangas FSRUs operational) | Short-to-medium term contracts | Archipelagic gas transport; lack of cross-island pipeline links |
| Malaysia | Regional LNG exporter transitioning to domestic importer in Peninsular West | ~7.3 MTPA (Pengerang & Melaka terminals) | Internal portfolio balancing via Petronas | Internal geographical demand split between Sabah/Sarawak and Peninsular Malaysia |
Strategic Framework: De-Risking Southeast Asia’s Gas Transition
To mitigate price volatility and bridge infrastructure deficits, regional energy planners and corporate buyers must adopt a multi-tiered procurement and structural framework:
+-----------------------------------------------------------------------------------+
|                        REGIONAL LNG RISK MITIGATION FRAMEWORK                     |
+------------------------------------+----------------------------------------------+
| 1. Contract Portfolio Optimization | Balance 70-80% Long-Term SPAs with Spot JKM  |
+------------------------------------+----------------------------------------------+
| 2. Midstream Agility               | Deploy Modular FSRUs to shorten FID timelines |
+------------------------------------+----------------------------------------------+
| 3. Regional Pricing Benchmarks    | Develop an ASEAN Gas Index to decouple oil   |
+------------------------------------+----------------------------------------------+
| 4. Hybrid Grid Integration         | Pair Gas-to-Power with Solar/Energy Storage  |
+------------------------------------+----------------------------------------------+
1. Rebalancing Contract Portfolios
Energy buyers must shift away from pure spot exposure. Securing long-term SPAs indexed to Henry Hub or Brent crude provides price stability, while retaining a 15–20% spot allotment maintains operational flexibility. Market outlooks published by Shell Global emphasize that long-term contracting remains the primary shield against geopolitical price shocks.
2. Accelerated Deployment of Modular Infrastructure
FSRU technology offers a significantly shorter lead time (18–24 months) compared to onshore terminals (4–5 years). Developing nations can leverage leased FSRUs to initiate import capabilities while onshore pipeline networks are built out.
3. Constructing an ASEAN LNG Pricing Hub
Establishing localized regional trading hubs (such as Singapore’s SLNG expansion) enables the creation of an ASEAN-specific price benchmark. This reduces over-reliance on the North Asian Japan Korea Marker (JKM) and better reflects local market dynamics, a strategy actively analyzed by the U.S. Department of Energy.
4. Co-Optimization with Renewable Energy
Gas-to-power infrastructure should not be viewed in isolation. Gas turbines must be deployed as flexible, quick-start balancing units alongside expanding solar and wind capacity, ensuring system reliability without locking utilities into unmanageable fossil fuel import bills.
Outlook: The Balancing Act Ahead
Southeast Asia’s demand for LNG is structural and unavoidable over the coming decade. However, transforming LNG from a volatile financial burden into a secure transition fuel requires disciplined infrastructure planning, tariff reforms, and sophisticated procurement strategies. Without regional coordination and strategic long-term contracting, ASEAN power markets remain exposed to global market dynamics beyond their control.
Discover more from The Economy
Subscribe to get the latest posts sent to your email.
Key Takeaways
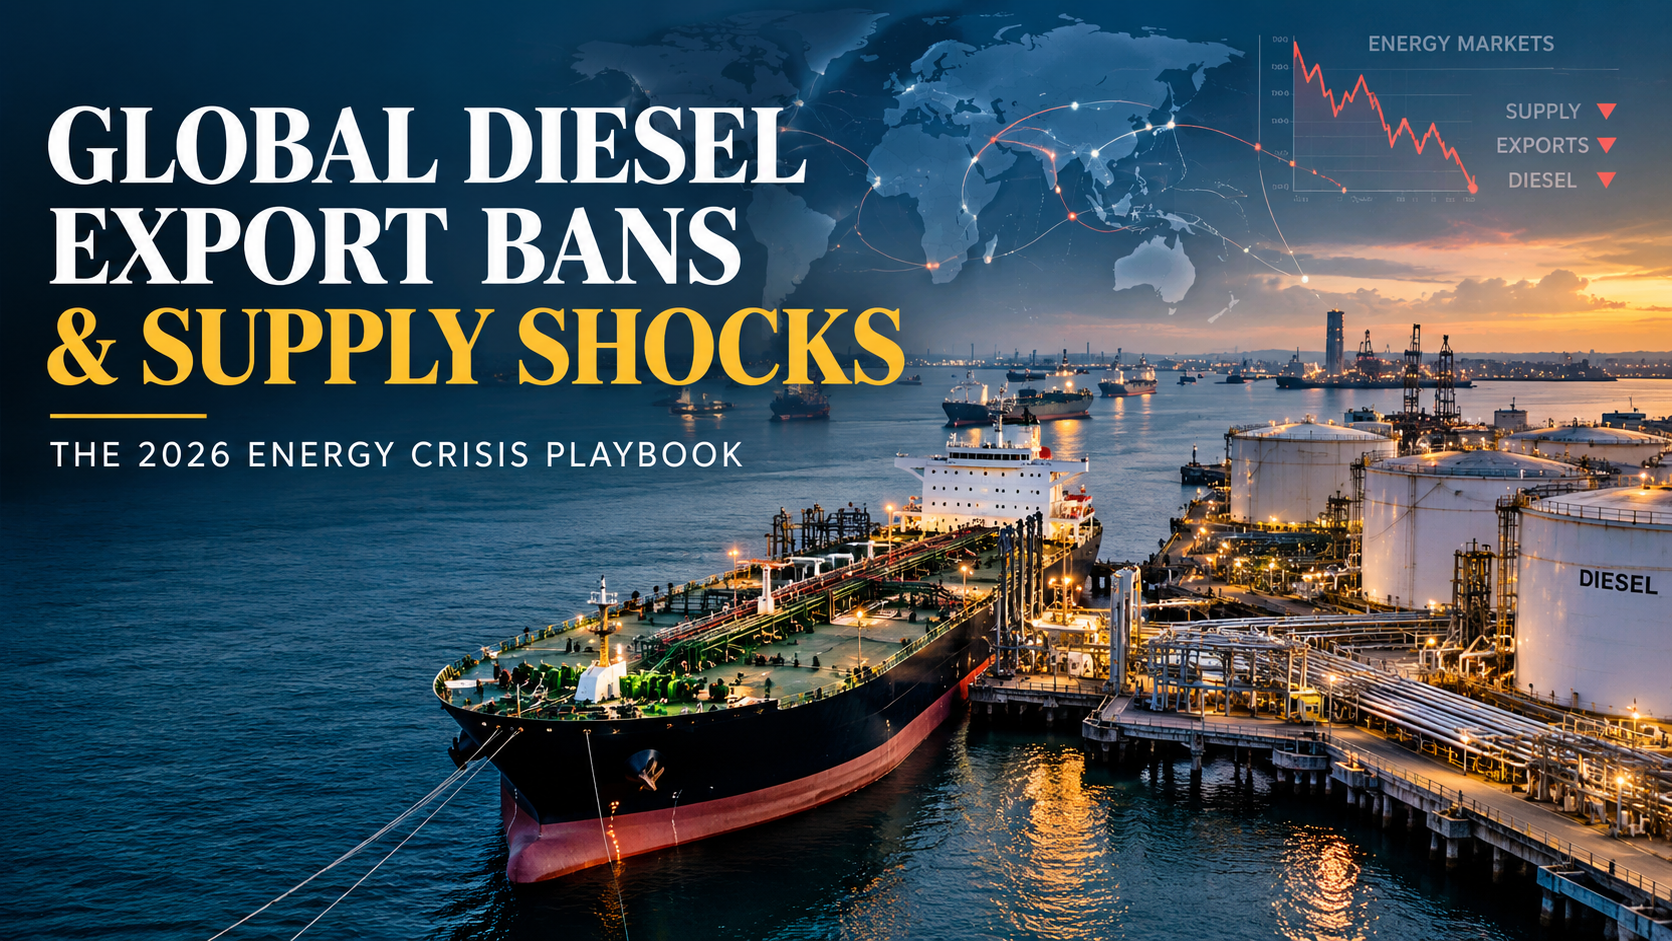
- Supply Crunch: Discussions regarding potential US diesel export bans have amplified global energy deficits as refiners struggle to meet middle distillate demand.
- Maritime Transit Bottlenecks: Escalating geopolitical tensions surrounding the Strait of Hormuz have constrained crude oil transport and raised marine shipping insurance premiums.
- Refining Spread Explosion: The diesel “crack spread”—the profit margin refiners earn converting crude into diesel—has expanded to near-record highs.
- Logistics Inflation: Transportation, trucking, and agricultural industries face immediate operational cost surges, directly impacting downstream consumer prices.
The Middle Distillate Deficit: Why Diesel Rules the Global Economy
While headlines frequently focus on crude oil benchmark prices, diesel and gasoil (middle distillates) serve as the actual blood stream of global commerce. Industrial manufacturing, commercial trucking, maritime shipping, and agricultural machinery rely almost entirely on diesel fuel engines.
Supply chain research from McKinsey & Company demonstrates that middle distillate shortages exert a far more immediate inflationary impact on logistics costs than gas station petrol fluctuations.$$\text{Refining Crack Spread} = \text{Refined Diesel Market Price} – \text{Raw Crude Oil Cost}$$
When refiners face crude supply constraints due to Middle Eastern transit blockades, the price of refined diesel decouples from standard crude benchmarks, causing the crack spread to widen dramatically.
               Global Supply Chain Diesel Price Impact Loop

  [Strait of Hormuz Disruptions] + [Proposed US Export Bans]
                              |
                              v
             [Middle Distillate Inventory Depletion]
                              |
                              v
             [Diesel Crack Spread Expands Past $45/bbl]
                              |
                              v
  [Freight Surcharges Rise] ---> [Consumer Goods Inflation Spikes]
Geopolitical Chokepoints: The Strait of Hormuz Crisis
The vulnerabilities in global energy supply chains are heavily concentrated around key maritime bottlenecks. The Strait of Hormuz, through which roughly 20% of global petroleum liquids flow daily, is experiencing severe transit risk reductions.
As reported by commodity analysts at S&P Global, marine insurance underwriters have raised war-risk premiums for oil tankers transiting the Persian Gulf by over 300%, forcing major shipping lines to reroute vessels around the Cape of Good Hope.
Global Supply Chain Transmission Factors:
- Increased Transit Duration: Rerouting tankers adds 10 to 14 days to voyage times between Gulf suppliers and European/North American refineries.
- Capital Lockup: Millions of barrels of middle distillate fuel remain trapped in floating transit for longer durations, compounding domestic regional deficits.
- Refinery Configuration Mismatches: Heavy complex refiners in North America and Asia face challenges adjusting secondary unit inputs when crude slates shift abruptly.
Commercial Impact Metrics across Key Industrial Sectors
Real-time commodity data verified by Reuters outlines how the supply crunch is impacting critical economic sectors.
Sector-by-Sector Impact Analysis
| Industry Sector | Cost Exposure Level | Primary Risk Mechanism | Projected Consumer Price Impact |
| Commercial Trucking | Extreme | Immediate fuel surcharge add-ons | $+4.5\% – 7.2\%$ on retail goods |
| Agricultural Farming | High | Planting & harvesting equipment fuel costs | Elevated food commodity futures |
| Maritime Shipping | High | Very Low Sulfur Fuel Oil (VLSFO) spikes | Surcharges per TEU container |
| Aviation & Travel | Critical | Jet fuel refining competition | $+25\% – 30\%$ on long-haul airfares |
Corporate Playbook: Mitigating Energy Supply Disruptions
To navigate the ongoing energy market volatility, supply chain directors and corporate risk executives are implementing defensive hedging models:
- Fuel Hedging Derivatives: Securing long-term diesel swap contracts and call options to cap maximum operational fuel expenditures.
- Dual-Fuel Logistics Fleets: Accelerating the deployment of compressed natural gas (CNG) and electric commercial fleets for last-mile delivery operations.
- Strategic Fuel Reserve Buffers: Expanding local on-site fuel storage reserves from 14-day supply minimums to 45-day operational safety buffers.
Frequently Asked Questions (FAQ)
What happens if the US implements a total diesel export ban?
If the US restricts diesel exports, domestic fuel inventories within the United States would rise, lowering domestic prices temporarily. However, global fuel markets—especially in Europe and Latin America—would face immediate severe deficits, driving international prices and global supply chain costs dramatically higher.
Why is diesel price inflation more dangerous for the economy than gasoline price spikes?
Gasoline primarily impacts consumer personal travel. Diesel powers commercial transportation, including freight trucks, delivery vans, cargo ships, trains, and agricultural tractors. When diesel prices rise, the cost to transport every consumer product rises, driving broad inflation.
How does the Strait of Hormuz impact global refined fuel supply?
The Strait of Hormuz is the world’s most critical energy maritime chokepoint. A significant portion of global crude oil exports pass through it to reach global refineries. Any transit blockades reduce raw crude supplies to refiners, directly shrinking global diesel and jet fuel production.
Discover more from The Economy
Subscribe to get the latest posts sent to your email.

Wind Farm Economics in 2026: What Determines Whether a Project Pays?

Boomers vs Young Adults: Why the Net Worth Gap Is More Complicated Than It Looks

Is the AI Bubble Bursting in 2026? Five Tests Investors Should Watch

Germany–France ‘Made in Europe’ Deal Could Reshape China’s EV Ambitions

Treasury Yields and Inflation 2026: What Bond Moves Mean for Borrowers

Social Security COLA 2027 Is 3.6%: Payments, Examples and Dates

Ukraine’s Oil Strike Strategy: Can It Break Russia’s War Economy?

Power Grid Emergency Across 13 States? What the October 2026 PJM Order Actually Says

Oil Prices October 2026: Iran Conflict, Shipping and Inflation Risks

TSMC Stock in October 2026: AI Chip Demand, Earnings and Valuation Risks

Stock Market Crash 2026: What the Inflation and AI Selloff Means

Student Loans and the 2026 Midterms: SAVE Plan Deadlines and Borrower Choices

KOSPI Crash October 2026: What Korea’s Chip Selloff Reveals

CoreWeave Stock 2026: CRWV, AI Infrastructure Debt and the Selloff Explained

World’s Largest Economies: Ranking the Top Global Powers

Crude Oil & Petroleum Market Analysis: OPEC+ Decisions and Price Forecasts

Global Pension Systems Ranked: The World’s Best and Worst Retirement Frameworks

Pakistan Economy 2026: Inside the SBP’s Balancing Act

Bitcoin Price Forecast 2026–2027: Will the 4-Year Cycle Hold?

Silver Price Today: Why the Xi-Trump AI Standoff Is Fueling a Safe-Haven Rally

Asian Stock Markets 2026: Japan, China, Pakistan & More

SpaceX IPO: How Aerospace Is Reshaping Tech Startup News

SpaceX IPO 2026: History’s Biggest Stock Debut?

Oil Prices 2026: Inside the Hormuz Crisis That Won’t End

Algorithmic Dogfights: Why the U.S. and China Must Establish Rules of Engagement for Autonomous Air Power

IMF Reports 2026: What the Latest Data Means for the Global Economy

Business Insurance: What Coverage You Actually Need and What It Costs in 2026

Top US Convenience Store Chains: Store Counts, EV Charging, and Sales Trends
-

 Markets & Finance9 months ago
Top 15 Stocks for Investment in 2026 in PSX: Your Complete Guide to Pakistan’s Best Investment Opportunities
-

 Analysis8 months ago
Johor’s Investment Boom: The Hidden Costs Behind Malaysia’s Most Ambitious Economic Surge
-

 Analysis8 months ago
Top 10 Stocks for Investment in PSX for Quick Returns in 2026
-

 Banks9 months ago
Best Investments in Pakistan 2026: Top 10 Low-Price Shares and Long-Term Picks for the PSX
-

 Analysis8 months ago
Brazil’s Rare Earth Race: US, EU, and China Compete for Critical Minerals as Tensions Rise
-

 Investment9 months ago
Top 10 Mutual Fund Managers in Pakistan for Investment in 2026: A Comprehensive Guide for Optimal Returns
-

 Global Economy10 months ago
15 Most Lucrative Sectors for Investment in Pakistan: A 2025 Data-Driven Analysis
-

 Global Economy10 months ago
Pakistan’s Export Goldmine: 10 Game-Changing Markets Where Pakistani Businesses Are Winning Big in 2025