
Opinion
US Economy to Ride Tax Cut Tailwind—But Tariff Turbulence Complicates the Flight Path
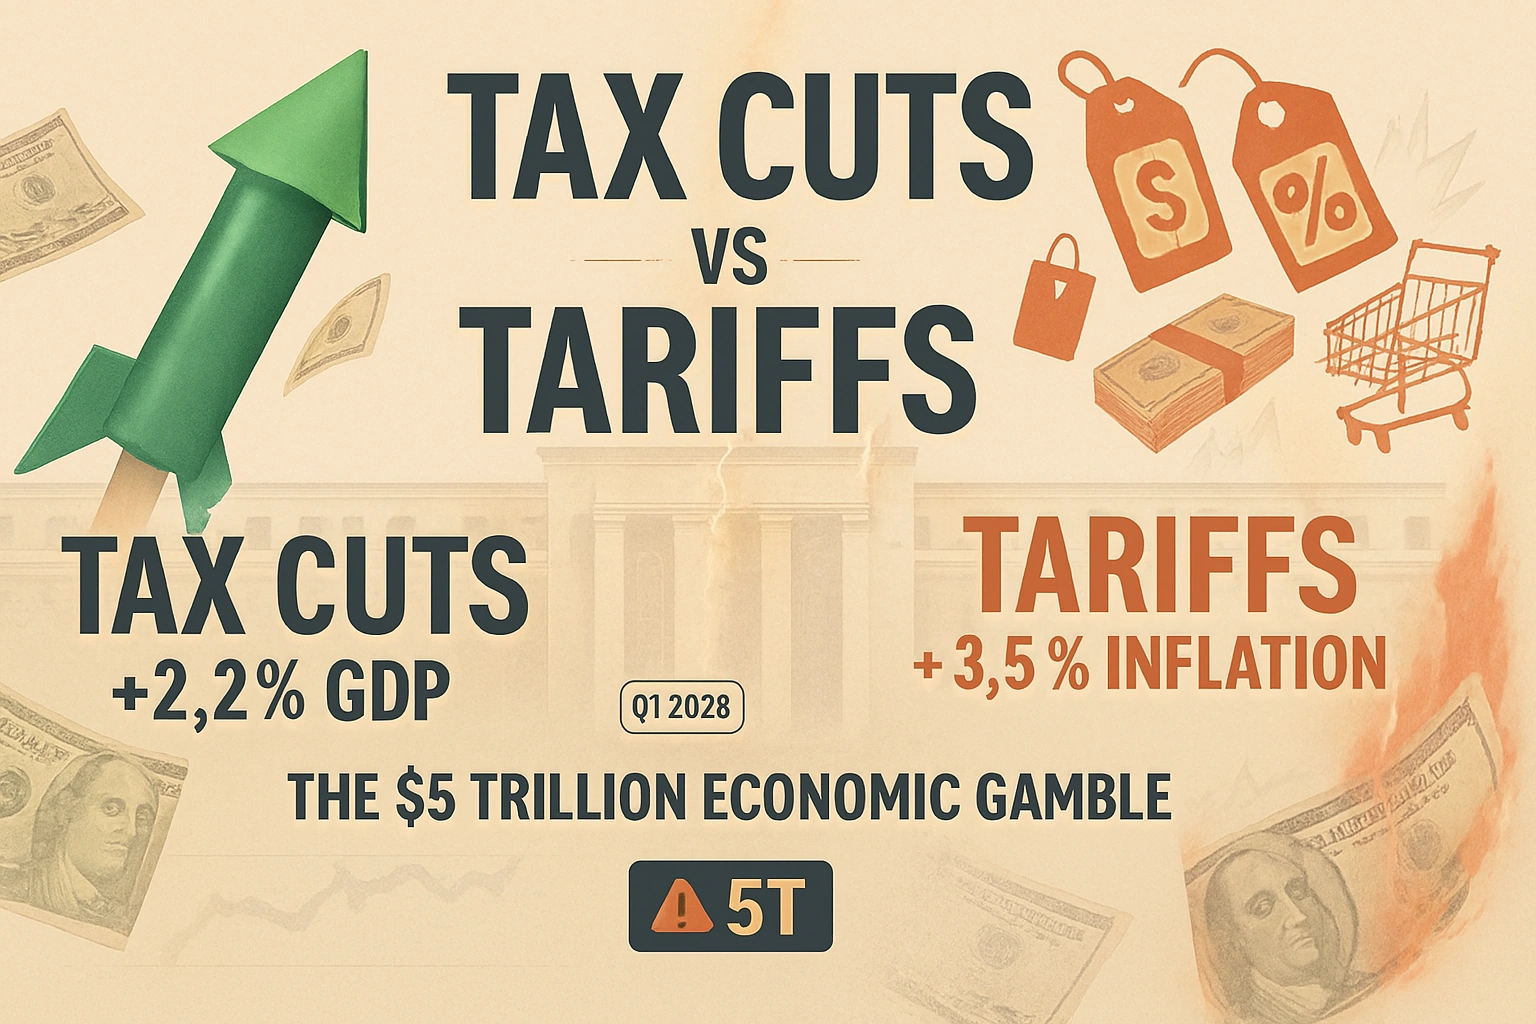
The impact of Trump’s tariffs on prices is projected to peak in the first half of the year, but the $5 trillion tax stimulus may propel growth despite short-term inflationary pressures
When Sarah Chen opened the invoice for her Chicago manufacturing firm’s imported steel components in March 2025, the numbers told a story playing out across American boardrooms: a 15% tariff-induced price increase that would squeeze margins through the spring. But when her accountant calculated the company’s 2025 tax liability in July—after the One Big Beautiful Bill Act became law—she discovered her effective tax rate had dropped by 2.3 percentage points, freeing up capital for the equipment investment she’d postponed for two years.
Chen’s experience captures the dual economic forces shaping 2025 and beyond: historic tax cuts colliding with the most aggressive tariff regime since the 1930s. The Congressional Budget Office projects real GDP growth of 1.4 percent in 2025 and 2.2 percent in 2026, reflecting a near-term drag from trade barriers followed by a tax-fueled acceleration. But beneath these headline numbers lies a more complex reality—one where the timing, magnitude, and distribution of benefits and costs will determine whether America’s economy enters 2027 on strengthened footing or stumbles under the weight of elevated borrowing costs and persistent inflation.
The Tax Cut Engine: $5 Trillion in Fuel
On July 4, 2025, President Trump signed the One Big Beautiful Bill Act, the most sweeping fiscal legislation of his second term. According to the Tax Foundation, the major tax provisions would reduce federal tax revenue by $5 trillion between 2025 and 2034 on a conventional basis. When accounting for economic growth effects, the dynamic score falls to $4 trillion, meaning economic growth pays for about 19 percent of the major tax cuts.
The legislation extends and expands the 2017 Tax Cuts and Jobs Act provisions that were scheduled to expire. For individual filers, the standard deduction will jump by $750 to $16,100 for single filers in 2026. The seven individual income tax brackets remain at their reduced rates, preventing what would have been an automatic tax increase for millions of Americans.
But the law goes further with targeted provisions that benefit specific constituencies. Workers receiving tips can now deduct up to $25,000 of tip income from their taxable income, a provision Trump campaigned on extensively. The child tax credit increased from $2,000 to $2,200 per child for 2025, while parents of children born between 2025 and early 2029 gain access to government-seeded savings accounts with an initial $1,000 deposit.
For businesses, the impact is substantial. The legislation makes permanent the 20% deduction for pass-through entities like partnerships and sole proprietorships, alongside 100% bonus depreciation for equipment investments. These provisions address long-standing complaints from the business community about the uncertainty created by temporary tax code provisions.
The Penn Wharton Budget Model estimates that before economic effects, these proposals would reduce revenues by $6.8 trillion over the 2025-2034 budget window. The discrepancy between various estimates reflects different assumptions about behavioral responses and the scope of provisions modeled.
“J.P. Morgan estimates the announced measures could boost Personal Consumption Expenditures prices by 1–1.5% this year, and the inflationary effects would mostly be realized in the middle quarters of the year. Fed Chair Jerome Powell emphasized that inflation from goods should peak in the first quarter or so, effectively a one-time shift in the price level rather than an ongoing inflation problem.”
How this translates into economic growth depends on several transmission mechanisms. Lower marginal tax rates increase the after-tax return to work, potentially boosting labor supply. Reduced corporate taxation raises the after-tax return on investment, encouraging capital formation. And households with more disposable income tend to increase consumption, stimulating aggregate demand.
The Tax Foundation projects the One Big Beautiful Bill Act would increase long-run GDP by 1.2 percent—a meaningful but not transformative boost. Historical precedent from the 2017 tax cuts offers a reality check. Research found that the corporate tax cut reduced corporate tax revenue by 40 percent and increased corporate investment by 11 percent, while the tax cut increased economic growth and wages by less than advertised by the Act’s proponents.
The Tariff Headwind: Inflation’s Spring Surge
If tax cuts represent the economy’s accelerator, tariffs function as a brake—one applied with increasing force through early 2025. President Trump invoked emergency economic powers to implement what J.P. Morgan chief U.S. economist Michael Feroli describes as a dramatic escalation: This takes the average effective tariff rate from around 10% to just over 23%.
The architecture is complex. A baseline 10% universal tariff applies to nearly all trading partners, with significantly higher rates targeting specific countries and products. The effects ripple through the economy in ways that are only partially visible in real-time data.
Federal Reserve Bank of St. Louis researchers quantified the impact using personal consumption expenditures data. They found that over the June-August 2025 period, tariffs explain roughly 0.5 percentage points of headline PCE annualized inflation and around 0.4 percentage points of core PCE inflation. This represents a meaningful but not catastrophic contribution to inflation running above the Federal Reserve’s 2% target.
The Tax Foundation calculates that the tariffs amount to an average tax increase of $1,200 per US household in 2025 and $1,400 in 2026—a hidden levy that falls disproportionately on lower-income households who spend a larger share of their budgets on goods.
Harvard Business School’s Pricing Lab documented the differential impact across product categories. Between March and September 2025, the price of imported goods rose about 4.0 percent while domestic goods rose 2.0 percent. Categories showing especially steep increases include clothing accessories, jewelry, and household tools—items that feature prominently in household budgets.
How will Trump’s tax cuts affect the economy?
The Tax Foundation projects Trump’s One Big Beautiful Bill Act will reduce federal revenue by $5 trillion between 2025-2034, increasing long-run GDP by 1.2 percent. The Congressional Budget Office forecasts real GDP growth of 1.4% in 2025, rising to 2.2% in 2026 as tax provisions that reduce effective marginal rates on labor income boost work incentives and business investment accelerates.
The inflation impact exhibits a distinct timeline. J.P. Morgan estimates the announced measures could boost Personal Consumption Expenditures prices by 1–1.5% this year, and the inflationary effects would mostly be realized in the middle quarters of the year. This timing reflects the lag between tariff implementation and the pass-through to consumer prices as businesses work through existing inventories and negotiate new supply arrangements.
Fed Chair Jerome Powell emphasized this temporal dimension in his December press conference, noting that inflation from goods should peak in the first quarter or so assuming no major new tariff announcements. He characterized tariffs as likely to be relatively short lived, effectively a one time shift in the price level rather than an ongoing inflation problem.
This distinction—between a one-time price level increase and sustained inflation—matters profoundly for monetary policy. If Powell’s assessment proves correct, the tariff shock will fade from year-over-year inflation calculations by late 2026, allowing price pressures to normalize. But if tariffs trigger second-round effects through wage increases or inflation expectations becoming unanchored, the problem becomes more persistent.
The Federal Reserve’s Impossible Calculus
Perhaps no institution faces a more difficult navigation challenge than the Federal Reserve, which confronts simultaneous threats to both sides of its dual mandate: maximum employment and stable prices.
In December 2025, the Federal Open Market Committee lowered its key overnight borrowing rate by a quarter percentage point, putting it in a range between 3.5%-3.75%. But the decision was anything but unanimous—three members dissented, the highest number since September 2019. Governor Stephen Miran favored a larger half-point cut to support the weakening labor market, while Kansas City Fed President Jeffrey Schmid and Chicago Fed President Austan Goolsbee preferred holding rates steady out of inflation concerns.
This division reflects genuine uncertainty about the economy’s trajectory. The Congressional Budget Office projects the unemployment rate will rise from 4.1 percent at the end of 2024 to 4.5 percent by the end of 2025 and then fall to 4.2 percent by the end of 2026 as tax cut provisions that reduce effective marginal tax rates on labor income increase work incentives.
Powell acknowledged the bind directly: There’s no risk-free path for policy as we navigate this tension between our employment and inflation goals. If the Fed maintains elevated rates to combat tariff-induced inflation, it risks deepening labor market weakness. But if it cuts rates aggressively to support employment, it could validate higher inflation expectations and lose credibility.
The Committee’s latest economic projections show the committee continues to expect inflation to hold above its 2% target until 2028, a sobering assessment that reflects both tariff impacts and the stimulative effects of tax cuts on aggregate demand. For 2026, the Fed penciled in just one additional rate cut—a stark contrast with market expectations earlier in the year for more aggressive easing.
Powell repeatedly blamed tariffs for the inflation overshoot, stating that it is really tariffs that are causing most of the inflation overshoot. But he also stressed the Fed’s commitment to its mandate: Everyone should understand that we are committed to 2% inflation, and we will deliver 2% inflation.
The Fed finds itself in the uncomfortable position of having to look through supply-side price increases caused by tariffs while remaining vigilant that these don’t morph into broader inflation. Historical precedent from the 1970s oil shocks—when the Fed initially accommodated supply-driven inflation, only to face a far more painful disinflation later—weighs heavily on policymakers’ minds.
Net Economic Impact: Reading the Scorecard Through 2027
Synthesizing these opposing forces requires examining consensus forecasts from institutions with different methodological approaches. The picture that emerges shows near-term weakness giving way to moderate acceleration, but with considerable uncertainty bands.
The Congressional Budget Office, in projections released in September 2025, shows real GDP growth decreasing from 2.5% in 2024 to 1.4% this year. The downgrade from its January forecast reflects the negative effects on output stemming from new tariffs and lower net immigration more than offset the positive effects of provisions of the reconciliation act this year.
But 2026 tells a different story. CBO projects real GDP growth rises to 2.2 percent, reflecting the reconciliation act’s boost to consumption, private investment, and federal purchases and the diminishing effects of uncertainty about tariffs. The Federal Reserve Bank of Philadelphia’s Survey of Professional Forecasters, polling 33 economists, found consensus expectations of real GDP to grow at an annual rate of 1.9 percent in 2025 and 1.8 percent in 2026.
Goldman Sachs takes a more optimistic view in its 2026 outlook, forecasting 2.6% GDP growth driven by three factors: fading tariff impacts, tax cut stimulus (including an estimated $100 billion in additional tax refunds), and more favorable financial conditions from Fed rate cuts and deregulation initiatives.
On employment, the outlook remains mixed. The unemployment rate has drifted higher through 2025 as businesses navigate policy uncertainty around trade, immigration, and government downsizing. While the tax cuts’ labor supply incentives should support employment growth, the adjustment process takes time.
Real wage growth—nominal wage increases adjusted for inflation—represents perhaps the most important metric for household welfare. The CBO expects nominal wage growth to moderate but remain positive, while inflation gradually declines toward target. This implies modest real wage gains for workers, though the distribution varies significantly by income level and industry exposure to tariffs.
Corporate earnings present a sector-specific picture. Companies with primarily domestic operations and low import dependency benefit from both lower tax rates and reduced competition from foreign producers. The S&P 500 reached new highs in late 2025, reflecting optimism about tax-enhanced profitability. But retailers, manufacturers dependent on imported components, and export-oriented firms face margin compression from tariffs and potential foreign retaliation.
Winners, Losers, and the Distribution Question
No fiscal policy of this magnitude affects all Americans equally. The distributional consequences reveal important equity considerations that transcend partisan debates.
The Urban-Brookings Tax Policy Center analyzed the original 2017 tax cuts and found that the top 5% of earners would get 45% of the benefits if extended. While the 2025 legislation adds provisions like tip income deductions that benefit lower earners, the basic structure remains tilted toward higher-income households who pay the lion’s share of income taxes.
Consider the math for different household types. A single parent earning $45,000 annually receives modest benefit from the slightly higher standard deduction and child tax credit—perhaps $300-500 in reduced tax liability. A married couple earning $250,000 sees benefits exceeding $5,000 from bracket relief alone, before accounting for other provisions.
Meanwhile, tariff costs fall regressively. Lower-income households spend a larger share of their budgets on goods subject to tariffs—clothing, household items, electronics. The Tax Foundation’s estimate of $1,200-1,400 in average household costs masks wide variation: a $35,000 household loses 3-4% of purchasing power, while a $150,000 household loses 0.8-1%.
Industry and occupational groups face divergent fortunes. Domestic manufacturers without import dependencies—particularly in industries protected by tariffs—gain on multiple fronts: lower taxes, reduced foreign competition, and potentially higher prices. Construction workers benefit from permanent full expensing provisions that encourage building investment. Financial services firms profit from increased lending as businesses deploy tax savings.
Conversely, retailers dependent on imported goods face a squeeze. Major companies including Walmart and Dollar General have announced price increases as they pass costs to consumers. Consumer goods companies like Procter & Gamble, Kraft Heinz, and Conagra have announced they are raising prices as a result of tariff costs.
Geographic distribution matters too. High-tax states like New York, California, and New Jersey see residents benefit from the increased SALT deduction cap, raising the deduction to $40,000 from $10,000. But these states also contain concentrations of import-dependent businesses and price-sensitive consumers.
Global Ripples: Trade Partners React
America’s fiscal choices reverberate globally through multiple channels. The tariff regime has already triggered retaliatory measures from major trading partners. China, the EU, and others have implemented countermeasures targeting U.S. exports, with agriculture particularly vulnerable.
The Peterson Institute for International Economics models suggest the combined effect of U.S. tariffs and foreign retaliation could offset more than two-thirds of the long-run economic benefit of Trump’s proposed tax cuts. This underscores how trade policy can substantially erode the gains from pro-growth tax reform.
Currency markets have responded to the shifting policy mix. The dollar initially strengthened on expectations of higher growth and interest rates, but then by May 10, it had depreciated by 5 percent relative to most major currencies, reflecting concerns about fiscal sustainability and potential capital outflows.
For Europe, the impact manifests through reduced export demand and investment uncertainty. J.P. Morgan’s Raphael Brun-Aguerre noted that activity has been running at an annualized rate of 0.9% in the first half of 2025, and we expect activity to moderate in the second half of the year with a negative direct and indirect impact from tariffs.
Supply chain realignment represents perhaps the most significant long-term effect. Businesses are reassessing their global footprints, with many considering nearshoring to Mexico or friendshoring to allied nations. This restructuring involves substantial costs and takes years to fully implement, creating ongoing uncertainty that weighs on investment decisions.
Scenarios: Base, Bull, and Bear Cases
Given the interplay of tax cuts, tariffs, monetary policy, and unpredictable factors like geopolitical developments, economic forecasting requires scenario analysis with assigned probabilities.
Base Case (55% probability): Tax cuts drive GDP growth to 2.0-2.3% in 2026 after a sluggish 1.4-1.5% in 2025. Tariff inflation peaks in Q1 2026 around 3.5% (core PCE) before moderating to 2.4-2.6% by year-end. The Federal Reserve cuts rates modestly—two quarter-point reductions in 2026—while maintaining a cautious stance. Unemployment stabilizes around 4.3-4.5% as labor market adjusts. The combined deficit impact reaches approximately $3.4 trillion over a decade after accounting for tariff revenues and economic growth effects. Stock markets continue gradual appreciation on earnings growth, though volatility persists around policy announcements.
Bull Case (25% probability): Trade negotiations produce meaningful tariff rollbacks by mid-2026, reducing inflation pressures faster than expected. Tax cut stimulus exceeds consensus forecasts as business investment responds strongly to full expensing provisions. GDP growth reaches 2.6-2.8% in 2026, unemployment falls to 4.1%, and inflation returns to near-target by late 2026. The Fed cuts rates more aggressively—four reductions through 2026—as dual mandate tensions ease. Productivity gains from AI and technology adoption begin materializing. Fiscal costs come in lower than projected as dynamic revenue effects prove stronger. Markets rally 12-15% in 2026 on improving fundamentals.
Bear Case (20% probability): Tariffs escalate further with major retaliation from trading partners, pushing peak inflation to 4.5-5% in early 2026. Tax cuts fail to generate expected investment response as elevated uncertainty keeps businesses cautious. GDP growth stagnates at 1.0-1.3% through 2026, while unemployment rises to 4.8-5.0%. The Federal Reserve faces impossible tradeoff: cutting rates risks unanchoring inflation expectations, while holding firm deepens recession risk. Long-term interest rates spike as bond markets react to ballooning deficits, adding $725 billion in extra debt service over the decade. Markets correct 15-20% on stagflation concerns. Political gridlock prevents policy adjustments.
Timeline: Quarter-by-Quarter Roadmap
Q1 2026 (January-March): Peak tariff inflation pressure as businesses fully pass through costs accumulated in 2025. Core PCE inflation likely reaches 3.3-3.5%. Tax refund season delivers approximately $100 billion to households from 2025 provisions. Federal Reserve holds rates steady at January meeting, evaluating incoming data. Labor market shows early stabilization with unemployment around 4.4%. Congressional debates over deficit begin intensifying.
Q2 2026 (April-June): Inflation begins moderating as tariff base effects fade from year-over-year calculations. GDP growth accelerates to 2.3-2.5% annualized rate as tax cut stimulus gains traction and businesses complete inventory adjustments. Federal Reserve likely implements first rate cut of the year, signaling confidence that tariff inflation is transitory. Consumer spending strengthens on improved real wage growth. Housing market shows renewed activity on lower mortgage rates.
Q3 2026 (July-September): Economic picture clarifies with six months of post-tax-cut data. Inflation target of 2.5-2.7% core PCE suggests Fed successfully navigated dual mandate tensions. Business investment data reveals whether full expensing provisions are generating anticipated capital formation. Trade deficit trends indicate whether tariffs achieved administration’s rebalancing goals. Unemployment stabilizes around 4.2-4.3%.
Q4 2026 (October-December): Fed delivers potential second rate cut if inflation and labor market data cooperate. Markets begin pricing 2027 outlook. Congressional Budget Office releases updated 10-year projections incorporating actual policy effects. Financial markets assess whether deficit trajectory is sustainable. Holiday retail sales provide critical real-time indicator of consumer health.
Critical Indicators to Monitor
Several data points will provide early signals of which scenario is unfolding:
Monthly CPI and PCE Reports: Track month-over-month changes in core inflation, particularly goods categories most exposed to tariffs. Sequential deceleration would confirm Powell’s transitory thesis.
Employment Situation Reports: Beyond headline payroll numbers, watch labor force participation rates and real wage growth (nominal wages minus inflation). Strong participation suggests tax cuts are incentivizing work.
Business Investment Data: Equipment and intellectual property investment figures reveal whether companies are deploying tax savings productively or hoarding cash amid uncertainty.
Import/Export Prices: Leading indicators of tariff pass-through and retaliation effects. Stabilization would signal trade tensions easing.
Consumer Confidence Surveys: Forward-looking household sentiment about income prospects and inflation expectations.
Federal Reserve Minutes and Fed Speak: Watch for shifts in committee consensus about inflation persistence versus labor market fragility.
Long-term Treasury Yields: Bond market’s assessment of fiscal sustainability. Sustained moves above 4.5% on 10-year notes would signal deficit concerns.
The Fiscal Reckoning Ahead
Beyond 2026 lies a longer-term question that transcends the immediate growth-versus-inflation debate: fiscal sustainability. The CBO projects debt held by the public will rise from 100 percent of GDP in 2025 to 118 percent by 2035, exceeding any level in American history.
The One Big Beautiful Bill Act adds materially to this trajectory. On a dynamic basis—accounting for economic growth effects—the Tax Foundation estimates the OBBB would increase federal budget deficits by $3.0 trillion from 2025 through 2034, and increased borrowing would add $725 billion in higher interest costs over the decade.
This matters because bond markets have finite patience for fiscal expansion, particularly when growth expectations don’t justify borrowing levels. The experience of the United Kingdom in 2022, when ambitious tax cuts sparked bond market turmoil and forced policy reversal within weeks, serves as a cautionary tale.
The counter-argument holds that reasonable debt-to-GDP ratios depend on growth rates and borrowing costs. If tax cuts generate sustained productivity improvements and GDP growth remains above interest rates, the debt dynamics remain manageable. Proponents point to decades of fiscal space afforded by reserve currency status and deep capital markets.
What’s incontrovertible is that interest costs are rising rapidly as a share of the federal budget. This crowds out other spending priorities and reduces fiscal flexibility for future crises. The political economy challenge—how to address long-term fiscal imbalances when short-term incentives favor tax cuts and spending increases—remains unresolved.
What This Means for Stakeholders
For Households: The net effect depends critically on income level and consumption patterns. Higher earners with diversified investments and professional incomes gain unambiguously from tax cuts. Middle-income families see modest benefits that may be partially offset by tariff-driven price increases on goods. Lower-income households face challenging math: nominal tax benefits often prove smaller than real income erosion from inflation.
The prudent household strategy involves locking in lower borrowing costs where possible (refinancing mortgages, consolidating high-interest debt), building emergency savings to weather labor market volatility, and maintaining flexibility in spending patterns as relative prices shift.
For Businesses: The calculus varies dramatically by sector, import dependency, and customer base. Companies should scenario-plan across tariff persistence versus rollback, model cash flows under different Fed rate paths, and evaluate whether full expensing provisions justify accelerated capital investment. Supply chain diversification—while costly—may provide valuable optionality if trade policy remains volatile.
Service businesses with domestic operations benefit cleanly from tax cuts without significant tariff exposure. Manufacturers must weigh reduced tax rates against higher input costs. Retailers face margin compression that may require pricing power or operational efficiency gains to offset.
For Investors: Portfolio construction should account for regime change from the low-rate, low-inflation era. Fixed income faces ongoing repricing as long-term rates adjust to fiscal realities. Equity valuations near record highs embed optimistic assumptions about earnings growth that may not materialize if stagflation risks increase.
Sector rotation strategies favor domestically-oriented companies with pricing power and low import sensitivity. Technology companies face mixed signals: tax benefits and deregulation support valuations, but some face tariff headwinds on components and consumer electronics. Defensive sectors with inflation-linked revenues (utilities, real estate) may outperform if inflation persists above target.
For Policymakers: The challenge is navigating political economy constraints while addressing legitimate economic concerns. Tariffs provide visible action on trade imbalances but carry significant welfare costs. Tax cuts deliver tangible benefits to constituents but worsen long-term fiscal position.
The optimal policy package would likely involve targeted rather than universal tariffs, offsetting revenue losses from tax cuts with base-broadening reforms rather than deficit spending, and pairing near-term stimulus with credible long-term fiscal consolidation. Political realities make such packages difficult to assemble.
Conclusion: Threading the Needle
As 2026 unfolds, the U.S. economy faces an unusual combination of forces: aggressive fiscal stimulus colliding with trade-induced inflation, an uncertain monetary policy response, and longer-term fiscal clouds on the horizon. The most likely outcome—captured in the base case scenario—sees the tax cut tailwind eventually overcoming tariff headwinds after a bumpy first half, delivering moderate growth with inflation gradually returning toward target.
But the probability distribution is wide. Success requires multiple things going right simultaneously: tariffs causing only temporary inflation without second-round effects, tax cuts spurring productive investment rather than consumption or financial engineering, the Federal Reserve threading its dual mandate needle, and fiscal discipline emerging before bond markets force it.
History offers mixed lessons. Supply-side tax cuts in the 1980s coincided with strong growth but also soaring deficits and eventual tax increases. The 2017 tax cuts generated modest economic gains less dramatic than advertised. Tariff regimes—from Smoot-Hawley in the 1930s to more recent steel tariffs—typically impose welfare costs exceeding any protection benefits.
What’s different this time is scale and simultaneity. Never since World War II has the United States combined such aggressive fiscal expansion with trade barriers of this magnitude while starting from elevated debt levels and near-full employment. We are, in a meaningful sense, conducting a macroeconomic experiment in real time.
The most honest assessment acknowledges uncertainty while identifying mechanisms and monitoring signals. The tax cuts will boost after-tax incomes and may spur investment—that’s economically sound. Tariffs will raise prices and distort resource allocation—that’s equally certain. The Federal Reserve can manage one-time price level shifts if inflation expectations remain anchored—that’s theoretically correct but operationally challenging.
For businesses and households, the prudent response involves flexibility: maintaining liquidity, diversifying risk, and avoiding bets that require a specific policy outcome. For policymakers, it demands intellectual honesty about tradeoffs, responsiveness to incoming data, and willingness to adjust course if outcomes diverge from forecasts.
The U.S. economy enters 2026 with considerable underlying strength: dynamic businesses, flexible labor markets, technological leadership, and resilient consumers. The question is whether policy choices harness these strengths or create headwinds that offset them. The answer will emerge quarter by quarter through 2026, providing lessons for generations of economists and policymakers to study.
One thing seems certain: the debate over whether tax cuts or tariffs represent sound economic policy will continue long after we know which forecast proved most accurate. What matters now is clear-eyed analysis of facts as they emerge, rigorous assessment of competing interpretations, and humility about the limits of economic prediction in a complex, dynamic system.
The economy is about to tell us which story is correct. We should listen carefully to what it says.
Discover more from The Economy
Subscribe to get the latest posts sent to your email.


How once-unimaginable catastrophes become baseline assumptions
There is a particular kind of hubris that infects markets in the long stretches between catastrophes. Volatility compresses. Risk premia decay. The insurance gets quietly cancelled because it hasn’t paid out in years and the premiums feel like wasted money. Then the disaster arrives — not as a distant rumble but as a wall of water — and the entire analytical framework investors have spent years constructing turns out to have been a map of the wrong country.
We are living through one of the most instruction-rich moments in modern financial history. Since February 28, 2026, when the United States launched military operations against Iran and Tehran responded by closing the Strait of Hormuz, markets have been running a live masterclass in catastrophe pricing. West Texas Intermediate crude surged from $67 to $111 per barrel in under a fortnight — the fastest oil spike in four decades. War-risk insurance premiums on shipping through the Gulf soared more than 1,000 percent. The S&P 500 lost 5 percent in a single week, and the ECB and Bank of England are now staring down a renewed tightening scenario they spent the first quarter of 2026 insisting was off the table.
And yet — and this is the part that should make every portfolio manager uncomfortable — the analytical mistakes driving losses right now are not new. They are the same six structural errors investors have made in every previous crisis. Understanding them, really understanding them, is not an academic exercise. It is the difference between surviving the next disaster and being liquidated by it.
Key Takeaways at a Glance
- Markets price first-order disaster impacts; second- and third-order cascades are systematically underpriced
- Volatility is information; price-discovery failure is the true systemic risk — monitor private-to-public valuation spreads
- Tight CAT bond spreads signal capital crowding, not benign risk — use compression as a contrarian indicator
- Emerging market currencies and credit spreads lead developed-market pricing of global disasters
- Geopolitical risk premia decay faster than structural damage — separate the transitory from the permanent
- The best time to buy tail protection is when every indicator says you do not need it
Lesson One: Markets price the disaster they know, not the one that is compounding behind it
The economics of disaster pricing contain a fundamental asymmetry. Markets are reasonably good at incorporating a known risk — geopolitical tension, elevated VIX, stretched valuations — into current prices. What they catastrophically underprice is the second-order cascade that no single model captures.
Consider what the Hormuz closure actually detonated. Yes, oil went to $111 per barrel. Obvious. What was less obvious: the inflation feedback loop that forced investors to reprice central bank paths they had already discounted as settled. The Federal Reserve was expected to hold rates in 2026; futures now assign a 74 percent probability it does not cut at all this year. Europe’s energy import dependency made the ECB’s position worse. That transmission — from oil shock to rate-repricing to credit stress to equity multiple compression — is a chain, not a point event. Most risk models price the first link.
The academic framework for this is well established but rarely operationalised. The NBER disaster-risk literature, particularly Wachter (2013) and Barro (2006), argues that rare disasters produce risk premia that appear irrational in calm periods but are in fact the rational price of tail exposure across long time horizons. What these models miss, however, is that real-world disasters rarely arrive as clean, isolated point events. They arrive as cascades. The COVID-19 pandemic was not just a health shock — it was simultaneously a supply-chain shock, a demand shock, a sovereign-debt shock, and a labour-market restructuring shock. The Hormuz closure is not just an oil shock. It is an inflation shock, a monetary policy shock, a EM balance-of-payments shock, and an AI-investment sentiment shock, all at once.
Key takeaway: Map not just the primary disaster scenario but every second- and third-order transmission mechanism it activates. The primary impact is already partially in the price. The cascades are not.
Lesson Two: The real crisis is not volatility — it is the collapse of price discovery
Scott Bessent, the US Treasury Secretary, said something in March 2026 that deserves to be read not as politics but as a precise financial concept. Asked what genuinely frightened him after 35 years in markets, Bessent answered: “Markets go up and down. What’s important is that they are continuous and functioning. When people panic is when you’re not able to have price discovery — when markets close, when there is the threat of gating.”
Volatility is information. A price moving sharply up or down is a market doing exactly what it should: integrating new signals, adjusting expectations, clearing. The true systemic catastrophe is not a 10 percent drawdown. It is the moment when buyers and sellers can no longer find each other at any price — when the mechanism that produces prices breaks entirely.
This is not theoretical. Private credit markets are currently exhibiting exactly this dynamic. US BDCs — business development companies that provide credit to mid-market companies — have seen share prices fall 10 percent and trade 20 percent or more below their latest stated NAVs. Alternative asset managers that collect fees from these vehicles are down more than 30 percent. The public market is rendering a verdict on private valuations that the private market itself cannot yet deliver, because the private marks have not moved. There is no continuous clearing mechanism. There is no daily price discovery. There is only the last funding round — which is a negotiated fiction, not a price.
Investors who understand this distinction can do something useful with it: treat the spread between public-market pricing and private-market marks as a real-time fear gauge. When that gap widens sharply, the market is not panicking irrationally. It is pricing the absence of price discovery itself.
Key takeaway: Distinguish between volatility (information-rich, manageable) and price-discovery failure (structurally dangerous, contagion-prone). Monitor private-to-public valuation spreads as a leading indicator of the latter.
Lesson Three: Catastrophe bond complacency is always a warning, never a reassurance
In February 2026, Bloomberg reported that catastrophe-bond risk premia had fallen to levels not seen since before Hurricane Ian struck Florida in 2022. The cause was a surge of fresh capital chasing ILS yields. Managers called it a healthy market. A more honest reading is that it was a market pricing the wrong risk for the wrong reasons.
Here is the structural problem with catastrophe bonds, and indeed with most insurance-linked securities: the risk premium is set by the supply of capital chasing the trade, not by the true probability distribution of the underlying disaster. When capital floods in — as it has, driven by institutional allocators seeking uncorrelated returns — spreads compress regardless of whether the actual hurricane, flood, or geopolitical catastrophe risk has changed. The academic literature on CAT bond pricing, including recent work in the Journal of the Operational Research Society, confirms that cyclical capital flows consistently distort the risk-neutral pricing of catastrophe events.
The counter-intuitive lesson: when CAT bond spreads are tightest, protection is cheapest to buy and most expensive to have sold. The compression that looks like market efficiency is often capital crowding masquerading as a risk assessment. A catastrophe-bond market trading at pre-Ian yields six months before an Iran-driven energy crisis was not a serene market. It was a complacent one.
Key takeaway: Use catastrophe-bond spread compression not as a signal of benign risk conditions but as a contrarian indicator of under-priced tail exposure. Buy protection when it is cheap; do not sell it because it is cheap.
Lesson Four: Emerging markets absorb the shock first — and price it most honestly
There is a geographic hierarchy to disaster pricing that sophisticated global investors routinely ignore. When a major geopolitical or macro catastrophe detonates, the signal appears first in emerging market currencies, credit spreads, and energy import bills — not in the S&P 500 or the Dax. This is not because EM markets are more efficient. It is because they have less capacity to absorb shocks and therefore less incentive to pretend the shock is temporary.
The Hormuz closure is a case study. Developed-market investors spent the first week debating whether oil at $111 per barrel was “priced in.” Meanwhile, Gulf states were issuing precautionary production-cut announcements and Middle Eastern shipping had effectively ceased. Economies in South and Southeast Asia — which import 80 percent or more of their petroleum needs — faced simultaneous currency pressure (oil is dollar-denominated), fiscal pressure (fuel subsidies explode), and inflation pressure (food and transport costs surge). Countries like Pakistan, Sri Lanka, and Bangladesh were pricing a recession before most DM economists had updated their Q1 2026 forecasts.
The BIS research on disaster-risk transmission across 42 countries documents precisely this dynamic: world and country-specific disaster probabilities co-move in complex, non-linear ways. When global disaster probability rises, EM asset prices move first and fastest. For a DM investor, this is an early-warning system hiding in plain sight.
Key takeaway: Monitor EM currency indices, sovereign credit spreads, and fuel import data as leading indicators of how the global market is actually pricing a disaster — before the consensus in New York or London has caught up.
Lesson Five: Geopolitical risk premia have a half-life problem — and it is shorter than you think
Markets are extraordinarily good at normalising the catastrophic. This is not a character flaw; it is a survival mechanism. But for investors, the normalisation of extreme risk is one of the most financially treacherous dynamics in markets.
Consider the structural pattern Tyler Muir documented in his landmark paper Financial Crises and Risk Premia: equity risk premia collapse by roughly 20 percent at the onset of a financial crisis, then recover by around 20 percent over the following three years — even when the underlying structural damage persists. Wars display an even more dramatic version of this pattern. The initial shock is priced aggressively. But as weeks become months, the equity market begins to discount the conflict as background noise, even if oil remains $20 per barrel above pre-war levels and inflation continues to compound.
This half-life problem cuts in two directions. On the way in: investors are often too slow to price a new geopolitical risk, underestimating how durable its effects will be. On the way out: investors often reprice risk premia too quickly back to baseline, treating a structural change in the global system as if it were a weather event that has now passed. The Strait of Hormuz may reopen. But global shipping has permanently re-priced war-risk. Sovereign wealth funds in the Gulf are permanently reconsidering their US dollar reserve holdings. Indian and Japanese energy policymakers are permanently accelerating domestic diversification. These structural changes do not vanish when the headline risk premium fades.
Key takeaway: When pricing geopolitical disasters, separate the acute risk premium (which will fade) from the structural repricing (which will not). The former is a trading signal. The latter is an asset allocation decision that most portfolios have not yet made.
Lesson Six: The moment you feel safest is precisely when you are most exposed
The final lesson is the most counter-intuitive, and arguably the most important. There is a specific period in any market cycle — often 18 to 36 months after the previous crisis — when the cost of tail protection is at its cheapest, investor confidence is high, and catastrophe risk feels entirely theoretical. This is exactly when the next disaster is being loaded.
We can locate this period with precision in the current cycle. In early 2026, the CAPE ratio on US equities reached 39.8, its second-highest reading in 150 years. The Buffett Indicator (total market cap to GDP) hovered between 217 and 228 percent — historically associated with the period immediately before major corrections. CAT bond spreads were at post-Ian lows. VIX had compressed back to mid-teens. Private-credit redemption queues were elevated but not yet alarming. And the macroeconomic consensus — including, notably, within the US Treasury — was that tariff-driven inflation would prove transitory and that central banks would be cutting before mid-year.
Every one of those conditions has now reversed. The reversal took six weeks.
The academic literature on learning and disaster risk, particularly the Kozlowski, Veldkamp, and Venkateswaran (2020) framework on “scarring” from rare events, finds that markets systematically underestimate disaster probability in long stretches without disasters, then over-correct sharply when one arrives. This is not irrationality in the pejorative sense — it is Bayesian updating in the presence of genuinely ambiguous information. But the practical implication is stark: the time to buy disaster insurance is not after the disaster has arrived and the VIX has spiked to 45. It is in the quiet months when every indicator says you don’t need it.
Key takeaway: Maintain systematic, rule-based disaster hedges that do not depend on a real-time catastrophe forecast. The moment it feels unnecessary to hold tail protection is the moment the portfolio is most exposed to needing it.
The Synthesis: From Lessons to Portfolio Architecture
These six lessons converge on a single architectural principle: disaster pricing is not a moment-in-time forecast exercise. It is a permanent structural feature of portfolio construction.
The real mistake — the one that has cost investors dearly in 2020, in 2022, and again in 2026 — is not failing to predict the next disaster. It is believing that markets have already priced it in. The history of catastrophe pricing teaches us, with brutal consistency, that they have not. The cascade is underpriced. The price-discovery failure is unmodelled. The CAT bond spread is supply-driven, not risk-driven. The EM signal is ignored. The geopolitical risk premium is given a shorter half-life than the structural damage it caused. And the tail hedge is cancelled precisely when it is most needed.
The investors who will outperform across the full cycle are not those who predicted the Hormuz closure or the tariff escalation or the next crisis that has not yet been named. They are those who understood that unpriceable disasters are not unpriceable because they are impossible to imagine. They are unpriceable because the incentive structures of the investment industry consistently penalise the premiums required to hedge them.
That gap between what disasters cost and what markets charge for protection is not a market inefficiency. It is the most durable alpha in finance. Learning to harvest it is, in the deepest sense, the only lesson that matters.
Discover more from The Economy
Subscribe to get the latest posts sent to your email.
Analysis
How to Make the Startup Battlefield Top 20 — And What Every Company Gets Regardless (Even If You Don’t Win)

Applications close May 27, 2026. TechCrunch Disrupt runs October 13–15 in San Francisco. The clock is already ticking — and the smartest founders I know aren’t waiting.
Let me tell you about a founder I met in Lagos last spring. Her name is Adaeze, and she builds infrastructure for cross-border health payments across West Africa. She submitted to the Startup Battlefield 200 with nine months of runway, a product live in three markets, and the kind of quiet conviction that doesn’t photograph well but moves rooms. She didn’t make the Top 20. She didn’t step onto the Disrupt Main Stage. She didn’t shake hands with Aileen Lee under the camera lights.
What she did get was a TechCrunch profile, two warm intros from Battlefield alumni, a due diligence process that forced her to compress her pitch to its sharpest possible form, and — six weeks later — a Series A term sheet from a fund that had discovered her through the Battlefield ecosystem. “Not winning,” she told me, “was the best thing that happened to my company.”
That’s the story no one tells loudly enough. The Startup Battlefield Top 20 is real, legendary, and worth obsessing over. But the Battlefield 200 is where category-defining companies are actually forged — and the moment you hit submit, the real prize has already begun to arrive.
The Myth of the Main Stage: Why Everyone Chases Top 20 (And Why They’re Half Right)
The cultural mythology of the Startup Battlefield is formidable. Since its inception, the competition has introduced the world to companies including Dropbox, Mint, and Yammer at a moment when most of the investing world hadn’t yet heard their names. That legacy creates an understandable gravitational pull: every founder imagines themselves under those lights, six minutes on the clock, a panel of the most consequential venture capitalists alive leaning slightly forward.
And the 2026 judges panel is, frankly, extraordinary. Aileen Lee of Cowboy Ventures — the woman who coined the term “unicorn” — sits alongside Kirsten Green of Forerunner, whose consumer instincts have been quietly prescient for fifteen years. Navin Chaddha of Mayfield, Chris Farmer of SignalFire, Dayna Grayson of Construct Capital, Ann Miura-Ko of Floodgate, and Hans Tung of Notable Capital round out a panel whose collective portfolio value runs into the hundreds of billions. Six minutes in front of that group is, genuinely, not nothing.
But here’s the contrarian truth most competition coverage won’t say plainly: the Main Stage is a broadcast mechanism, not a selection mechanism. The investors in that room — and the far larger audience watching the livestream globally — are equally attentive to the Battlefield 200 track, the hallway conversations, the TechCrunch editorial context that frames every competing company. Making the Top 20 amplifies a signal. The Battlefield 200 creates the signal in the first place.
The real mistake isn’t failing to reach Top 20. It’s failing to apply.
What It Actually Takes to Make Startup Battlefield Top 20 in 2026
TechCrunch is not secretive about its selection criteria, which makes it all the more remarkable how many applications fail to address them directly. The official 2026 Battlefield selection framework prioritizes four factors — and most founders stack-rank them incorrectly.
1. Product Video: The Most Underestimated Requirement
The two-minute product video is where the majority of applications functionally end. Judges watch hundreds of these. They are, by professional training, pattern-matching for momentum, clarity, and differentiated function — not production quality. A founder filming in a Lagos apartment who shows the actual product moving actual money in real time will outperform a polished agency reel showing a UI mockup every single time.
Your product video needs three things: a real user doing a real thing in thirty seconds, a founder who speaks with the specificity of someone who built it themselves, and a problem framing that makes the viewer feel slightly embarrassed they hadn’t noticed it before. That’s it. That’s the whole brief.
2. Founder Conviction, Not Founder Charisma
There is a widespread and damaging conflation of conviction with performance. TechCrunch’s editorial team has been explicit: they are selecting for companies they believe will define markets, not founders they believe will win pitch competitions. Conviction means you have answered — specifically, not philosophically — why this market, why now, why you, and what happens if you’re right at scale. Charisma is pleasant. Conviction is decisive.
3. Competitive Differentiation That’s Immediately Legible
In a category saturated with AI-adjacent pitches, the differentiation bar has risen sharply for 2026. Judges are looking for what PitchBook’s 2025 venture trends analysis identified as “structural moats” — advantages rooted in proprietary data, regulatory positioning, hardware-software integration, or distribution relationships that aren’t easily replicated by a well-funded incumbent. If your differentiation is “we’re faster/cheaper/cleaner,” you haven’t found it yet.
4. An MVP That’s Actually in Market
The Battlefield 200 accepts pre-revenue companies, but the Top 20 almost universally goes to founders with real users experiencing a real product. This isn’t a formal criterion — it’s an observable pattern. Live usage creates a gravitational narrative that hypothetical TAMs simply cannot replicate. If you’re three months from launch, apply to Battlefield 200 now, use the application process to sharpen your story, and come back with stronger ammunition when your product is breathing.
The Hidden Premium Package: What Every Battlefield Applicant Gets
This is the part of the Battlefield story that receives almost no coverage, and I think that’s partly intentional. TechCrunch benefits from the mythology of the Main Stage. But the Battlefield 200 package — available to every company selected from thousands of global applicants — is, frankly, staggering for an early-stage company.
Every Battlefield 200 company receives:
- A dedicated TechCrunch article — organic, editorial, indexed globally. At a domain authority that rivals the FT for technology coverage, this is not a press release. This is coverage.
- Full Disrupt conference access — three days in the room where allocation decisions happen informally, between sessions, over coffee. Harvard Business Review research on startup ecosystems has consistently found that informal investor touchpoints at concentrated events produce conversion rates multiple times higher than formal pitch processes.
- Exclusive partner discounts and resources — AWS credits, legal services, SaaS tooling — the kind of operational runway extension that actually matters when you’re still pre-Series A.
- The Battlefield alumni network — a cross-vintage community of founders who have navigated similar scaling inflection points and are, as a cultural matter, unusually generous with warm introductions.
- The due diligence forcing function — this is the hidden premium feature nobody talks about. The application process forces you to compress your narrative, clarify your defensibility, and confront your assumptions in ways that three months of internal planning rarely achieves. The best founders I know treat Battlefield applications as strategic planning exercises with publishing rights.
You do not need to win to receive these. You need to be selected for the Battlefield 200. And you need to apply by May 27, 2026.
A Global Economist’s Lens: Why Battlefield Matters Far Beyond San Francisco
Here’s the dimension of this competition that the tech press chronically underweights: the Startup Battlefield is no longer a California story.
The 2026 applicant pool will draw from startup ecosystems that, five years ago, barely registered in global VC data. Lagos. Nairobi. Bangalore. Jakarta. São Paulo. Warsaw. Riyadh. These aren’t edge cases — they’re the growth frontier. The World Economic Forum’s 2025 Global Startup Ecosystem Report found that emerging-market startup activity grew at 2.3 times the rate of Silicon Valley across the prior two years, even as absolute capital remained concentrated in traditional hubs.
The Battlefield, when it amplifies a Nairobi health-tech company or a Warsaw defense-technology startup, isn’t being charitable. It’s being correct about where the next wave of valuable companies is actually forming. The judges know this. The TechCrunch editorial team knows this. The AI wave, the climate infrastructure wave, and the defense-tech wave are all, fundamentally, global waves — and the founders best positioned to ride them often sit far outside Sand Hill Road.
For international founders specifically, the Battlefield 200 functions as a credentialing mechanism in a way that no local competition can replicate. A TechCrunch editorial mention is legible to any investor in any timezone. That’s an asymmetric advantage worth crossing an ocean for.
The Insider Playbook: Application Tactics That Separate Top 20 from the Rest
Let me be direct. After studying Battlefield alumni companies and talking with founders across multiple cohorts, the differentiation between Top 20 and the broader Battlefield 200 comes down to a handful of consistent patterns.
Lead with the insight, not the solution. The most memorable applications open with a counterintuitive observation about a market — something that makes the reader feel briefly disoriented before the product snaps everything into focus. Don’t open with your product. Open with the thing you know that most people don’t.
Show the unfair advantage early. Judges are filtering for irreplaceability. What do you have that a well-funded competitor cannot simply buy? Name it explicitly. Don’t make judges infer it.
Let your numbers do the emotional labor. Retention rates, NPS scores, revenue growth trajectories — when these are strong, they communicate conviction more credibly than any adjective. If your numbers aren’t strong yet, show the qualitative signal with the same specificity: customer quotes, use-case depth, early partnership terms.
Apply even if you think you’re not ready. This is perhaps the most counterintuitive piece of advice I can offer, and I give it with full conviction. The application process itself — the forcing function of articulating your thesis, differentiation, and trajectory in a compressed format — is a strategic tool. The companies that use Battlefield applications as a planning discipline, regardless of outcome, emerge sharper. Apply now. Sharpen later if needed.
Target the Battlefield 200 explicitly, not just the Top 20. Frame your application for a reader who wants to discover a company worth writing about. TechCrunch’s editorial team is not just selecting pitch competitors — they’re selecting companies they want to cover. Give them a story.
The Founder Mindset Shift: Applying Is Never a Risk
There’s a question I hear constantly from founders considering the Battlefield: What if we apply and don’t get in?
I want to reframe this question entirely, because it misunderstands the nature of the opportunity.
The risk isn’t applying and not making Battlefield 200. The risk is building a company in 2026 without forcing yourself through the disciplined articulation that serious competition requires. The risk is arriving at your Series A pitch without having stress-tested your narrative against the sharpest editorial and investor judgment available for free. The risk is letting the May 27 deadline pass while you wait for more traction, more polish, more time — none of which will make the application easier, only theoretically safer.
The $100,000 equity-free prize awarded to the Top 20 winner is real and meaningful. But the actual prize structure of the Startup Battlefield is far more democratic than that figure suggests. Every company in the Battlefield 200 receives resources, visibility, and credibility that early-stage startups typically spend years accumulating through slower, more expensive channels.
The Main Stage is where careers are validated. The Battlefield 200 is where they’re launched.
Apply before May 27, 2026. TechCrunch Disrupt runs October 13–15 in San Francisco. The application is free. The upside is not.
The question isn’t whether you’re ready for the Battlefield. The question is whether you’re ready for what not applying costs you.
→ Submit your Startup Battlefield 2026 application at TechCrunch Disrupt before May 27, 2026. Applications are free. The stage is global. Your category is waiting.
Discover more from The Economy
Subscribe to get the latest posts sent to your email.

The Physical Market Is Screaming What Futures Won’t Admit
On the afternoon of April 7, 2026, as President Donald Trump’s 8:00 p.m. deadline for Iran loomed, something unprecedented happened in the North Sea. Dated Brent—the benchmark for physical cargoes of crude oil being loaded onto ships—touched $144.42 per barrel, surpassing the crisis peaks of Russia’s 2022 invasion of Ukraine and even the 2008 global financial crisis frenzy. By the following day, some North Sea Forties cargoes were effectively pricing north of $150 per barrel.
Meanwhile, Brent futures for June delivery—the paper contracts that dominate news tickers—hovered around $96.50 to $110 per barrel, creating a historic $32-per-barrel premium between physical spot markets and forward contracts. This is not merely a spread. This is a warning siren.
The message from the physical market is unambiguous: the ceasefire is theater, and the energy crunch is only beginning.
The Ceasefire That Isn’t: Iran’s De Facto Hormuz Control
The United States and Iran announced a two-week ceasefire on the evening of April 7, 2026, following nearly six weeks of conflict that began with U.S.-Israeli strikes on February 28. The agreement, brokered with Pakistani mediation, was meant to pause military operations and reopen the Strait of Hormuz—the chokepoint through which 20 million barrels per day of crude and products transited before the war, representing roughly 20% of global seaborne oil trade.
Yet by April 10, the strait remained effectively closed to normal commercial traffic. According to MarineTraffic data, only six ships transited the strait on April 9—including just two oil or chemical tankers—compared to 53 tankers on February 27, the day before hostilities began. The first non-Iranian oil tanker to pass since the ceasefire—a Gabon-flagged vessel carrying 7,000 tonnes of Emirati fuel oil—only transited on April 9, nearly 48 hours after the truce took effect.
The reason for the paralysis is simple: Iran has institutionalized control over the waterway. Under the ceasefire terms announced by Tehran, all vessels must coordinate passage with the Islamic Revolutionary Guard Corps (IRGC) Navy and navigate designated corridors—specifically routes between Qeshm and Larak islands that avoid Iranian-laid sea mines. Iran’s Ports and Maritime Organization explicitly stated that transit requires “coordination with Iran’s Armed Forces and with due consideration to technical limitations”.
This is not freedom of navigation. This is a toll system disguised as security protocol.
The $2 Million Question: Iran’s Economic Warfare
President Trump took to Truth Social on April 10 to warn Iran against charging “fees” to tankers: “They better not be and, if they are, they better stop now!”. But the reality on the water suggests otherwise.
According to maritime intelligence firm Lloyd’s List and multiple ship brokers, Iran has been using Larak Island as a tolling stop for tankers during the war, demanding payments of $1 million to $2 million per vessel—or approximately $1 per barrel—with fees collected in Chinese yuan or cryptocurrency. Iranian-flagged vessels and ships from “friendly” nations like Malaysia reportedly transit toll-free, while vessels from Western-aligned countries face exclusion or exorbitant charges.
If normalized at pre-war traffic levels of roughly 21.5 million barrels daily, a $1-per-barrel toll would generate approximately $645 million monthly—or $7.74 billion annually—for the Iranian regime. This is not incidental revenue; this is a strategic economic weapon that transforms Hormuz from a passive chokepoint into an active taxation regime on global energy flows.
The implications extend beyond immediate costs. As CIBC Private Wealth’s Rebecca Babin notes, “A toll structure effectively puts a straightjacket on flows… creating friction and likely reducing overall throughput”. Even if the ceasefire holds, Iran has demonstrated that it can constrain global supply at will—and profit handsomely from doing so.
The North Sea Premium: A Market Voting With Its Feet
While futures traders price in an optimistic resolution—Brent futures remain in steep backwardation, with front-month contracts commanding premiums over longer-dated ones—the physical market tells a different story. The backwardation structure itself signals acute near-term supply tightness; as Société Générale strategists warned, “The system is running out of buffer and the physical market is now signaling acute stress”.
Dated Brent’s surge to $144+ reflects a brutal scramble for prompt barrels among refiners who cannot wait for Hormuz to reopen. With at least 12 million barrels per day of Middle Eastern supply effectively shut in—roughly 12% of global output—European and Asian refiners are bidding aggressively for replacement cargoes from the North Sea, West Africa, and the Atlantic Basin.
The International Energy Agency has characterized the disruption as the “largest supply disruption in the history of the global oil market”. Gulf production cuts have exceeded 10 million barrels per day, including 8 million barrels of crude and 2 million barrels of condensates and NGLs, with major reductions in Iraq, Qatar, Kuwait, the UAE, and Saudi Arabia. Ras Laffan, the world’s largest liquefaction facility in Qatar, has been offline since March 2.
In response, IEA member countries agreed on March 11 to release 400 million barrels from emergency reserves—the largest coordinated stock release in history. Yet as the IEA itself acknowledged, this remains a “stop-gap measure.” Full restoration of flows, according to the U.S. Energy Information Administration, “will take months,” with modeling indicating fuel prices will continue rising until variables resolve.
The Futures-Physical Disconnect: What Traders Are Missing
The divergence between futures and physical markets reveals a dangerous complacency. Futures traders—betting on financial contracts settled months from now—appear to assume the Hormuz crisis will resolve swiftly. Physical buyers, needing barrels today, have no such luxury.
As Wood Mackenzie’s Alan Gelder observed, the Brent futures curve has shifted from pre-war contango (where future prices exceed spot) to pronounced backwardation extending through 2033, reflecting “the challenge on prompt barrel supply and availability as the market is scrambling for crude barrels in all geographies”. The M1-M3 backwardation has widened from roughly $2-3 per barrel pre-war to $20 per barrel currently.
This is not a market expecting a quick fix. This is a market pricing in sustained structural tightness.
The disconnect carries real-world consequences. When physical prices greatly exceed futures, fuel costs for consumers escalate rapidly. As IDX Advisors’ Ben McMillan noted, “Dated Brent is where the rubber meets the road,” and Brent futures surpassing $150 per barrel remains “certainly within the cards” if negotiations fail.
Washington’s Gambit: Theater Over Strategy
The ceasefire negotiations scheduled for April 10 in Islamabad, Pakistan—led by Vice President JD Vance, senior envoy Steve Witkoff, and Jared Kushner—carry the weight of global expectations. Yet the fundamental dynamics undermine optimism.
President Trump has declared that U.S. military forces will remain in place around Iran until a “REAL AGREEMENT” is reached, threatening that “the ‘Shootin’ Starts,’ bigger, and better, and stronger than anyone has ever seen before” if terms are violated. Simultaneously, he has mused about a U.S.-Iran “joint venture” on Hormuz tolls—a proposal that would effectively legitimize Iranian control over the waterway.
This incoherence reflects a deeper strategic failure. As the Council on Foreign Relations’ Steven A. Cook observed, “There has been no regime change in Iran, the current leadership is not any less radical than their predecessors, the Iranians still have the ability to menace their neighbors, and Iran has leverage over the Strait of Hormuz when it did not before the war began”. The war has not degraded Iran’s Hormuz capabilities; it has demonstrated and monetized them.
Israel’s continued strikes on Lebanon—targeting Hezbollah positions that both Iran and Pakistan claim are covered by the ceasefire—further complicate the truce’s viability. German Chancellor Friedrich Merz warned that “the severity with which Israel is waging war there could cause the failure of the peace process as a whole”. When Israeli Prime Minister Benjamin Netanyahu declares that Lebanon is excluded from the ceasefire while Iranian officials insist it is included, the agreement’s foundations appear sand-soft.
The New Energy Security Architecture
The Hormuz crisis has exposed vulnerabilities that will persist regardless of the ceasefire’s fate. The IEA’s emergency stock release, while unprecedented, cannot replace 20 million barrels per day of disrupted flows indefinitely. Global inventories—while currently at 8.2 billion barrels, their highest since February 2021—are being drawn down steadily as “early-March inventory cushions” thin and pre-conflict cargoes discharge.
More fundamentally, the crisis has shattered the assumption that major shipping chokepoints remain neutral infrastructure. Iran has proven that a mid-tier military power can, through asymmetric capabilities—naval mines, missile threats, and IRGC coordination regimes—effectively tax global trade and force superpowers to the negotiating table.
For energy markets, this means a permanent risk premium. The North Sea’s record premiums are not an anomaly; they are the new baseline for a world where physical availability trumps financial speculation. Refiners will pay whatever it takes to secure prompt cargoes, and producers outside the Hormuz zone—North Sea, West African, U.S. Gulf—will command structural premiums for their reliability.
The Verdict: Structural Risks Baked In
The Washington-Tehran ceasefire is not a resolution; it is a tactical pause in a broader confrontation over control of global energy arteries. Iran retains de facto sovereignty over Hormuz transit, complete with IRGC coordination requirements, toll demands, and the demonstrated capacity to close the strait at will. The North Sea’s record physical prices reflect market recognition that this leverage is not temporary—it is structural.
For sophisticated investors and policymakers, the implications extend beyond the immediate price spike. The energy transition narrative—already strained by years of underinvestment—faces a brutal reality check. As one analyst noted, after two decades and $5 trillion invested in renewable energy, the world remains “utterly dependent on crude oil” when supply tightens. The International Air Transport Association has warned that jet fuel shortages will persist for months even after the strait reopens.
The backwardation in futures curves suggests traders expect normalization eventually. The physical market’s screaming premiums suggest otherwise. When the world’s most liquid benchmark crude—North Sea Dated Brent—trades at $144+ per barrel while futures languish $30+ below, the market is voting with its wallet.
The ceasefire has failed to stem the global energy crunch because it was never designed to. It is a face-saving measure that leaves Iran in control, the strait constrained, and physical markets in acute stress. The North Sea premium is not a bug in the system—it is the system adjusting to a new reality where Hormuz is no longer a free passage, but a toll road run by the IRGC.
For energy security planners in Washington, Brussels, Beijing, and beyond, the message is clear: diversification is no longer optional, and strategic reserves are no longer sufficient. The Hormuz crisis has demonstrated that in an era of asymmetric warfare and economic coercion, the chokepoints that matter most are those that can be monetized by those willing to hold them hostage.
The North Sea’s record prices are the first verdict. They will not be the last.
Discover more from The Economy
Subscribe to get the latest posts sent to your email.
-

 Markets & Finance3 months ago
Top 15 Stocks for Investment in 2026 in PSX: Your Complete Guide to Pakistan’s Best Investment Opportunities
-

 Analysis2 months ago
Brazil’s Rare Earth Race: US, EU, and China Compete for Critical Minerals as Tensions Rise
-

 Banks3 months ago
Best Investments in Pakistan 2026: Top 10 Low-Price Shares and Long-Term Picks for the PSX
-

 Investment3 months ago
Top 10 Mutual Fund Managers in Pakistan for Investment in 2026: A Comprehensive Guide for Optimal Returns
-

 Analysis2 months ago
Top 10 Stocks for Investment in PSX for Quick Returns in 2026
-

 Asia3 months ago
China’s 50% Domestic Equipment Rule: The Semiconductor Mandate Reshaping Global Tech
-

 Global Economy3 months ago
Pakistan’s Export Goldmine: 10 Game-Changing Markets Where Pakistani Businesses Are Winning Big in 2025
-

 Global Economy3 months ago
15 Most Lucrative Sectors for Investment in Pakistan: A 2025 Data-Driven Analysis